Talking Your Book About Value (Part 1)
←
→
Page content transcription
If your browser does not render page correctly, please read the page content below
1
                            Talking Your Book About Value (Part 1)
                            “Once More Unto the Breach, Dear Friends, Once More…”

    Just in case you have been asleep for the past decade Rip Van Winkle style, this has been a terrible period
    for systematic value investors. As clients grow increasingly skeptical, pleas for forbearance on
    redemptions are growing louder and louder. Poorly timed advice from factor-based quants in “Time for
    a Venial Value-timing Sin”1 and “Reports of Value’s Death May Be Greatly Exaggerated”2 turned into
    pennies in front of steamroller experiences for their proponents. More concerningly, there seems to be
    a willful refusal to explain the fundamental drivers of the value factor nearly 30 years after it was first
    identified; instead, we are directed to look at history as evidence of future outcomes. Like the villagers in
    Aesop’s “The Boy Who Cried Wolf,” we are now forced to evaluate whether these firms are simply talking
    their book or if there is genuinely something to pay attention to this time. Interestingly, we think there
    very well may be, but would suggest the proposed implementations from traditional managers leave
    investors subject to significant risk due to changing market structure.

    For the sake of transparency, we are going to use the Kenneth French Data Library3. Per Clifford Asness’
    observation that P/B is not really broken as a metric (maybe not ideal, but not broken)4, we’ll focus on the
    Book/Market metric and the classic HML portfolio introduced in Fama-French 19925. This analysis will be
    broken into three chapters, published independently to expedite the response. After a very brief
    introduction to the underperformance of value issue, this section attempts to address the first of three
    questions:

             1) Is there evidence that cheap relative valuation of the Value Factor as described by Arnott and
                Asness leads to outperformance of the Value Factor? Does this suggest it is a good time to
                buy “cheap” value?

             The second and third parts will be published over the next two weeks:

             2) Do we have a working explanation for why “Value” works, and are there implications?
             3) Given the dynamics outlined in #1 and #2, what are the implications for investor portfolio
                construction?

    The Value Debacle

    Logica Capital                               LOGICAFUNDS.COM                                    424.652.9520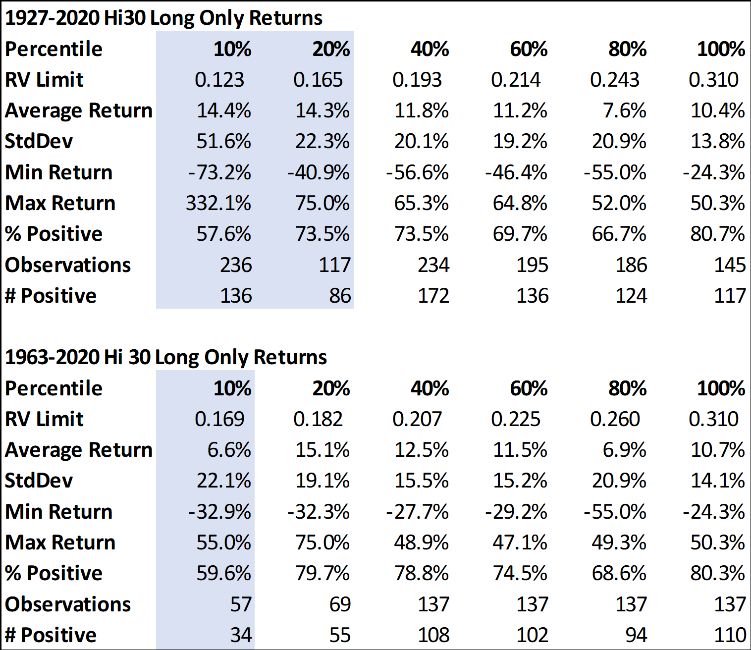
2

    Since peaking in March 2007, the value factor defined in the Fama-French High Book/Market – Low
    Book/Market (HML) framework has experienced an unprecedented drawdown. Excluding dividends,
    historically a major source of return for the value factor but no longer, the drawdown from peak exceeds
    60%.

    Many explanations have been proffered, perhaps the most common being “The Fed has ruined
    everything,” but it’s important to note that the actual returns to the value style in long only format have
    been remarkably robust over the last decade. At the time of Asness’ “Sin” recommendation in November
    2019, the trailing 10yr ex-dividend real return to a long only value portfolio was well above the median
    over history. The much lower dividend yields, potentially indicative of value not being “cheap” over this
    time period, lowered the total return performance to the 36th percentile.

    As Arnott accurately notes, the problem with value has not been the performance of “Value” longs, but
    rather the attempt to short “Glamour.”

    The Relative Valuation of Value as a Measure of “Value of Value”
    Arnott et al introduce the concept of the “Relative Valuation” of the Value factor in their January 2020
    paper, “Report of Value’s Death May Be Greatly Exaggerated.” This is defined as the ratio of Book/Price
    of the High Book/Price segment divided by the B/P of the Low Book/Price segment. Asness replicates this
    analysis, but inverted, with his “Value Spread” in his Nov 2019 blog post, “It’s Time for a Venial Value-
    Timing Sin.” They are functionally identical; Asness has simply flipped the ratio. While Asness’ language
    borrows from the academic literature6, it is less precise (a ratio is not a spread) and we’re going to
    reference Arnott’s Relative Valuation metric going forward.

    Writing at slightly different time periods, Asness in November 2019 and May 2020, and Arnott in January
    2020, both cases make the argument that value stocks have become relatively attractive. Again, Asness

    Logica Capital                              LOGICAFUNDS.COM                                   424.652.9520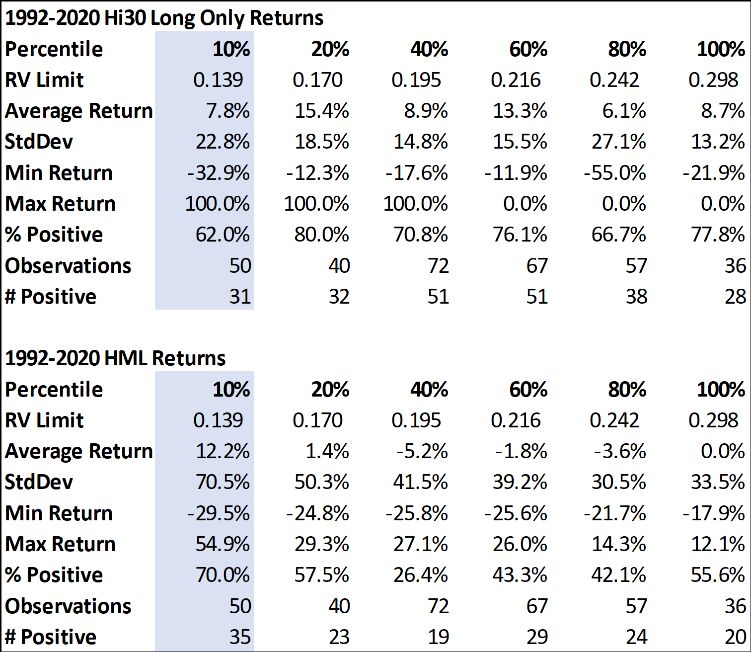
3

    is a little less precise in his language while Arnott acknowledges that relative valuation cheapness is not
    absolute cheapness:

             Arnott (Jan 2020): “Value has become drastically cheaper. This does not mean that value stocks
             are cheap in any absolute sense, only that they are unusually cheap relative to growth stocks. By
             historical standards, both growth and value are expensive relative to past norms.”

             Asness (Nov 2019): “the answer, regardless of the approach taken in measuring cheapness, is that
             value is currently quite cheap compared to history”

             Asness (May 2020): “today looks more like a relative depression in value stock prices rather than
             like euphoria in the expensive stocks” and “value is still super cheap”

    We must side with Arnott as the facts clearly dispute the AQR perspective. Value is not cheap, and it is
    certainly not “super cheap.” When we look at the breakpoints for the high Book/Market systematic value
    basket, value was not cheap as of November 2019 with the value segment B/P at the 27 th percentile of
    cheapness since 1927 and the 39th percentile of cheapness since 1963 (when Arnott’s analysis begins and
    the datasets expand dramatically). As of the end of March 2020 with the recent value “crash,” these
    numbers have shifted towards absolute cheapness relative to 1963 start dates at the 87th percentile, and
    moderate cheapness since 1927 at the 58th percentile. But in no way are we facing a record discount for
    value stocks in absolute terms, especially given the greater than 10% rally in value stocks since end of
    March 2020.

    However, there remains the question of whether the absolute cheapness or relative cheapness is what
    matters. For these purposes, we are going to try to be very precise in our language. For measures of
    absolute cheapness of the long portion of the HML portfolio, we are going to refer to the Hi30 Long Only

    Logica Capital                              LOGICAFUNDS.COM                                   424.652.9520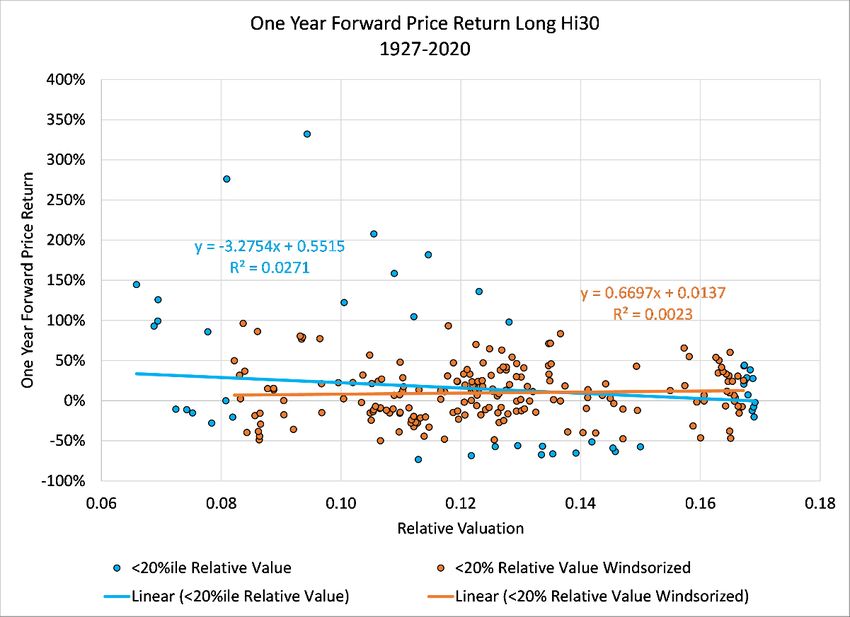
4

    Value and Hi30 Long Only Returns. For measures of relative valuation, which refer to the relative
    attractiveness of the Hi30 portfolio versus the Lo30 portfolio, we will refer to the Relative Valuation and
    HML Return. With Relative Valuation, the evidence begins to shift in favor of the Arnott/Asness focus on
    relative value. If we plot the Relative Valuation (Arnott) of HML, it is indisputable that we are quite cheap
    on a relative basis.

    And from a relative standpoint, it does appear that relative valuation matters. When we plot Relative
    Valuation versus forward 12 month HML return (again, Hi30 less Lo30), we see that relative cheapness
    does indeed result in higher returns once we pass extreme valuation levels.

    Logica Capital                               LOGICAFUNDS.COM                                    424.652.9520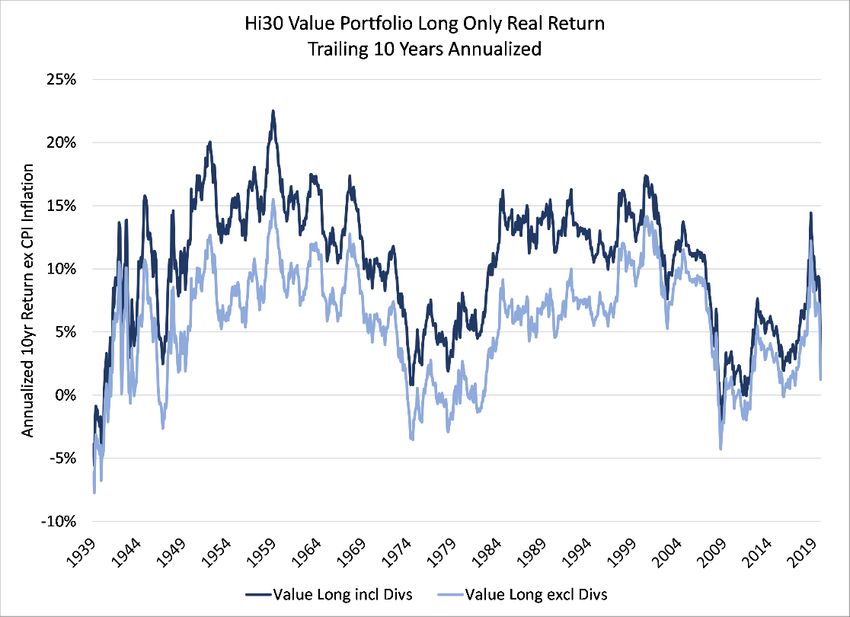
5
Unfortunately, this analysis is rife with caveats. First, we know that prior periods of extreme relative
valuation have resulted in mean reversion and outsized performance for the value factor; otherwise we
would not be having this debate. However, we cannot assume that history will repeat. Second, the
character of the distribution of outcomes is quite important; the entirety of the value excess return
appears to exist in two events over the last 100 years.
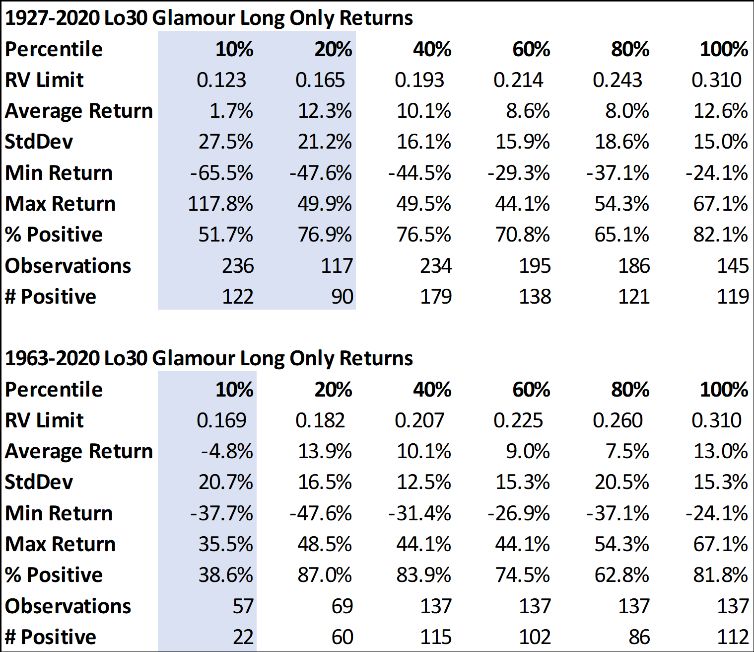
Looked at in tabular format7, the absolute return data is unattractive and gets even worse when we review
the more recent dataset utilized by Arnott. From 1963 to 2020, the “cheapest” decile of relative value
has produced the worst absolute Hi30 performance. More so, the probability of an absolute positive
outcome has been reduced. Why in the world would we want to sin to get poorer performance?
The data deteriorates even further if we look at the evidence since the publication of Fama-French in
1992, consistent with findings from Fama and French themselves in January 20208.
Logica Capital LOGICAFUNDS.COM 424.652.9520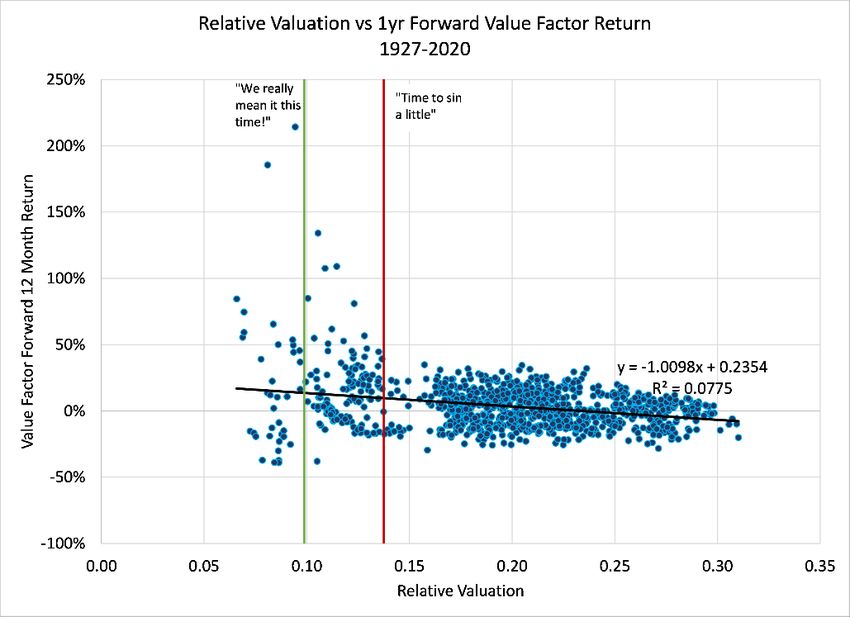
6

    Returning to the more favorable 1927-2020 dataset, if we look at the cheapest quintile of Relative
    Valuation in isolation, there is virtually no predictive power for the absolute return for the Hi30 portfolio.
    In fact, if we Windsorize the dataset to remove the 5% outliers within the cheapest 20%ile of Relative
    Valuation (orange), there is zero predictive power at all, even within the cheapest quintile. The average
    return over the Windsorized dataset is only 9.7% per annum with a wild standard deviation of 32%
    annualized. This is hardly an attractive risk-adjusted return. While criticism can be leveled that with
    Windsorization you are removing the best months, it’s important to note you’re also removing the worst
    months from this sample (most expensive and worst performing) and that the objective is to demonstrate
    the lack of a linear relationship between Relative Valuation and the return of a long only Hi30 portfolio.
    That there is a non-linear relationship opens up a discussion we will address in Part 3 of this series.

    Logica Capital                               LOGICAFUNDS.COM                                     424.652.9520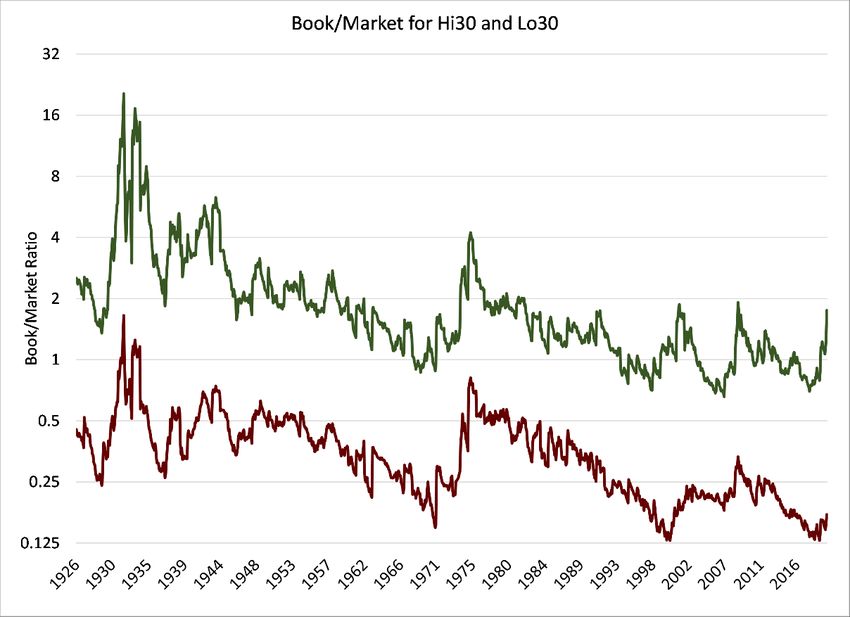
7

    Flipping sides, it is when we look at the results for the Lo30 (Glamour) portfolio that we start to get the
    answer for why anyone seems to care. We are not “leaning” value to invest in value, we just want an
    excuse to short the Lo30 Glamour stocks.

                            Absolute 1Y Forward Price Return Lo30 Glamour Portfolio

    Shorting Glamour Stocks
    The evidence brings us full circle to Arnott’s observation that the problem with the Value Factor has not
    been the absolute performance of Value stocks. The problem has been shorting the Glamour stocks1. It
    is unclear whether Asness realizes the core of his argument for leaning value is really just an excuse to
    short expensive growth stocks, but it is debatable whether we need a PhD from Chicago to tell us that
    shorting Glamour worked in 2000 and that it has been a very painful strategy for the last decade.
    Unfortunately, the same arguments in 1998 and 1999 led to the demise of many value investors and the
    Keynesian adage, “Markets can stay irrational longer than you can stay solvent” comes to mind. In Cliff’s
    defense, it is easy to infer that someone challenging the undeniable history of systematic value is a heretic,
    stupid and incapable of empirical analysis; unfortunately, shouting those insults does not change the facts
    of performance.

    However, history does not make Value attractive or unattractive at the current juncture. Instead, we must
    understand what is driving the observed history of excess returns to the Value factor, and what has
    changed that may make this less true in the observable future. For that, we will wait for Part 2.

                                   Follow Wayne on Twitter @WayneHimelsein

                                       Follow Michael on Twitter @ProfPlum99

    Logica Capital                               LOGICAFUNDS.COM                                     424.652.9520
8
End Notes
1. https://www.researchaffiliates.com/en_us/publications/articles/reports-of-values-death-may-
be-greatly-exaggerated.html
2. https://www.aqr.com/Insights/Perspectives/Its-Time-for-a-Venial-Value-Timing-Sin
3. We are eternally grateful to Kenneth French for his public provision of the Kenneth R. French
Data library https://mba.tuck.dartmouth.edu/pages/faculty/ken.french/data_library.html
4. https://www.aqr.com/Insights/Perspectives/Is-Systematic-Value-Investing-Dead
5. Fama, Eugene F & French, Kenneth R, 1992. "The Cross-Section of Expected Stock
Returns," Journal of Finance, American Finance Association, vol. 47(2), pages 427-465, June
6. Cohen, Randolph B. and Polk, Christopher and Vuolteenaho, Tuomo, The Value Spread (April
2001). NBER Working Paper No. w8242. Available at SSRN: https://ssrn.com/abstract=267426
7. Note on tables and breakpoints. The quintile limits and observations of Relative Valuation
include current observations since April 2019 that affect the quantity of observations, but these
dates are not included in the forward return calculations as future outcomes remain uncertain.
Given poor performance since April 2019 of the value factor and absolute return to value
investing (down 20-30% since April 2019), inclusion of these data points would exacerbate the
existing analysis.
8. Fama, Eugene F. and French, Kenneth R., The Value Premium (January 1, 2020). Fama-Miller
Working Paper No. 20-01 . Available at
SSRN: https://ssrn.com/abstract=3525096 or http://dx.doi.org/10.2139/ssrn.3525096
Logica Capital LOGICAFUNDS.COM 424.652.9520You can also read