TD SECURITIES PAPER & FOREST PRODUCTS VIRTUAL CONFERENCE - SEPTEMBER 29, 2021
←
→
Page content transcription
If your browser does not render page correctly, please read the page content below
TD SECURITIES
PAPER & FOREST PRODUCTS
  VIRTUAL CONFERENCE

                     SEPTEMBER 29, 2021
CAUTIONARY STATEMENTS REGARDING
FORWARD-LOOKING INFORMATION
Statements in this presentation referred to above that are not reported financial results or other historical information of Resolute Forest Products Inc. (with its subsidiaries, “we,” “our,”
“us” or the “company”) are “forward-looking statements” within the meaning of the Private Securities Litigation Reform Act of 1995. They include, for example, statements included in
the Outlook section of this presentation relating to the impact of the novel coronavirus (or “COVID-19”) pandemic and resulting economic conditions on our business, results of
operations and market price of our securities, and to our: efforts and initiatives to reduce costs, increase revenues and improve profitability; business and operating outlook; future
pension obligations; assessment of market conditions; growth strategies and prospects, and the growth potential of the company and the industry in which we operate; liquidity; future
cash flows, including as a result of the changes to our pension funding obligations; estimated capital expenditures; and strategies for achieving our goals generally. Forward-looking
statements may be identified by the use of forward-looking terminology such as the words “should,” “would,” “could,” “will,” “may,” “expect,” “believe,” “see,” “anticipate,” “continue,”
“attempt,” “project,” “progress,” “build,” “plan,” “grow,” “lead,” “drive,” “move,” “accelerate,” “generate,” “allow,” “look” and other terms with similar meaning indicating possible future
events or potential impact on our business or our shareholders.
The reader is cautioned not to place undue reliance on these forward-looking statements, which are not guarantees of future performance. These statements are based on
management’s current assumptions, beliefs and expectations, all of which involve a number of business risks and uncertainties that could cause actual results to differ materially. The
potential risks and uncertainties that could cause our actual future financial condition, results of operations, and performance to differ materially from those expressed or implied in this
presentation referred to above include, but are not limited to, the impact of: the COVID-19 pandemic on our business and resulting economic conditions, developments in non-print
media, including changes in consumer habits, and the effectiveness of our responses to these developments; intense competition in the forest products industry; any inability to offer
products certified to globally recognized forestry management and chain of custody standards; any inability to successfully implement our strategies to increase our earnings power;
the possible failure to successfully integrate acquired businesses with ours or to realize the anticipated benefits of acquisitions, such as our entry into wood manufacturing in the U.S.
and tissue production and sales, or divestitures or other strategic transactions or projects, including loss of synergies following business divestitures; uncertainty or changes in political
or economic conditions in the United States, Canada or other countries in which we sell our products, including the effects of pandemics; global economic conditions; the highly
cyclical nature of the forest products industry; any difficulties in obtaining timber or wood fiber at favorable prices, or at all; changes in the cost of purchased energy and other raw
materials; physical, financial and regulatory risks associated with global, regional, and local weather conditions, and climate change; any disruption in operations or increased labor
costs due to labor disputes or occupational health and safety issues; difficulties in our employee relations or in employee attraction or retention; disruptions to our supply chain,
operations, or the delivery of our products, including due to public health epidemics; disruptions to our information technology systems including cybersecurity and privacy incidents;
risks related to the operation and transition of legacy system applications; negative publicity, even if unjustified; currency fluctuations; any increase in the level of required contributions
to our pension plans, including as a result of any increase in the amount by which they are underfunded; our ability to maintain adequate capital resources to provide for all of our
substantial capital requirements; the terms of our outstanding indebtedness, which could restrict our current and future operations; changes relating to the London Interbank Offered
Rate (or, the “LIBOR”), which could impact our borrowings under our credit facilities; losses that are not covered by insurance; any shutdown of machines or facilities, restructuring of
operations or sale of assets resulting in any additional closure costs and long-lived asset or goodwill impairment or accelerated depreciation charges; any need to record additional
valuation allowances against our recorded deferred income tax assets; our exports from one country to another country becoming or remaining subject to duties, cash deposit
requirements, border taxes, quotas, or other trade remedies or restrictions; countervailing and anti-dumping duties on imports to the U.S. of the vast majority of our softwood lumber
products produced at our Canadian sawmills; any failure to comply with laws or regulations generally; any additional environmental or health and safety liabilities; any violation of trade
laws, export controls, or other laws relating to our international sales and operations; adverse outcomes of legal proceedings, claims and governmental inquiries, investigations, and
other disputes in which we are involved; the actions of holders of a significant percentage of our common stock; and the potential risks and uncertainties set forth under the heading
“Risk Factors” in Part I, Item 1A of the company’s annual report on Form 10-K for the year ended December 31, 2020, which have been heightened by the COVID-19 pandemic,
including related governmental responses and economic impacts, market disruptions and resulting changes in consumer habits.
All forward-looking statements in this presentation referred to above are expressly qualified by the cautionary statements contained or referred to above and in the company’s other
filings with the U.S. Securities and Exchange Commission and the Canadian securities regulatory authorities. The company disclaims any obligation to publicly update or revise any
forward-looking information, whether as a result of new information, future events or otherwise, except as required by law.
The information on industry and general economic conditions in this presentation was derived from third-party sources and trade publications we believe to be widely accepted and
accurate. We have not independently verified the information and cannot assure you of its accuracy.

                                                          All figures in US$ unless otherwise noted.

                                                                                   TD Securities Paper & Forest Products Virtual Conference                        September 29, 2021              2
WHO WE ARE
NORTH AMERICAN FOREST PRODUCTS COMPANY WITH A LEADING MARKET PRESENCE
3
13 pulp, paper and tissue mills2 21 wood products facilities
2020 Sales 7,1001
• Market pulp (5 facilities): • Wood products shipments:
$2.8 billion Employees 2.0 million mbf
1.1 million mt shipments
• Paper (8 facilities):2 • Remanufactured wood
production: 54 million FBM
• Newsprint:
0,8 million mt shipments2 • Engineered wood production:
100%
134 million linear feet
Products of managed • Specialty papers:
marketed in woodlands 0.6 million mt shipments • Wood pellet production:
roughly 50 are certified 41,000 mt
by • Tissue (3 facilities): 95,000 st
countries Energy assets installed
independent shipments (86,000 mt)
third parties • 1 converting facility • Total installed capacity: 440 MW
• 13 converting lines • 7 hydroelectric facilities
• 6 cogeneration facilities
Toundra Greenhouse Performance Biofilaments Inc.
Largest Canadian producer of wood products east of (49% interest) (joint-venture with Mercer
the Canadian Rockies Saint-Félicien (QC) International)
Fifth largest pulp producer in N.A. Cellulose Filament Manufacturing
One of the largest producers of paper in N.A Kenogami (QC)
Established tissue producer
1. As at December 31, 2020
2. Excludes Amos and Baie-Comeau newsprint mills, indefinitely idled since Q1 2021
3. Annual shipments and production as per 2020 10-K
TD Securities Paper & Forest Products Virtual Conference September 29, 2021 3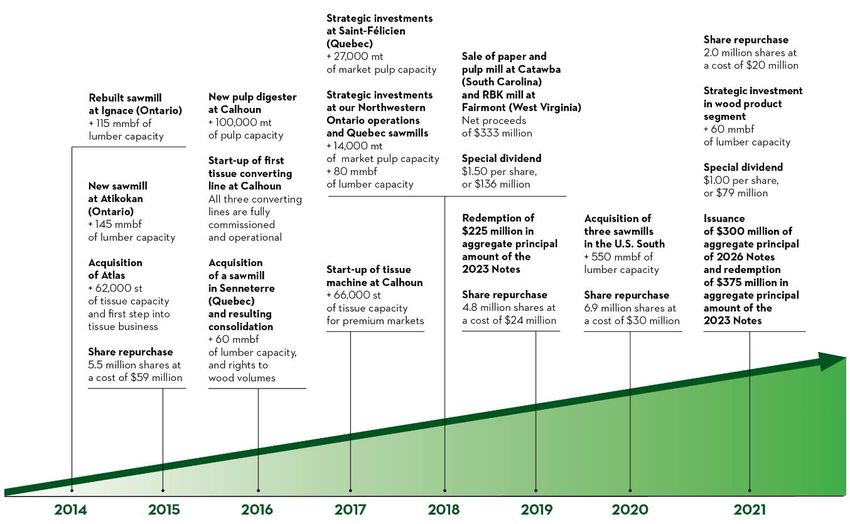
OUR OPERATIONS
                    1.   Montreal (Quebec)
                                                                        29.    Abitibi and Nord-du-Québec (Quebec)
                                                                        30.    Côte-Nord (Quebec)
                                                                        31.    Lac-Saint-Jean (Quebec)
                                                                        32.    Mauricie (Quebec)
                    2.   Calhoun (Tennessee)*
                                                                        33.    Northwestern Ontario (Ontario)
                    3.   Coosa Pines (Alabama)*
                                                                        34.    Outaouais (Quebec)
                    4.   Menominee (Michigan)
                                                                        35.    Southeastern U.S. (Tennessee)
                    5.   Saint-Félicien (Quebec)*
                    6.   Thunder Bay (Ontario)*

                                                                        36.    Calhoun (Tennessee)
                    Sawmills                                            37.    Hagerstown (Maryland)
                                                                        38.    Hialeah (Florida)
                    7.   Atikokan (Ontario)
                                                                        39.    Sanford (Florida)
                    8.   Comtois (Lebel-sur-Quévillon, Quebec)
                    9.   Cross City (Florida)
                    10. El Dorado (Arkansas)
                                                                        40.    Amos (Quebec) (indefinitely idled)
                    11. Forest Products Mauricie (La Tuque, Quebec)
                                                                        41.    Baie-Comeau (Quebec) (indefinitely idled)
                    12. Girardville (Quebec)                            42.    Clermont (Quebec)
                    13. Glenwood (Arkansas)                             43.    Gatineau (Quebec)*
                    14. Ignace (Ontario)                                44.    Grenada (Mississippi)
                                                                        45.    Thunder Bay (Ontario)*
                    15. La Doré (Quebec)
                    16. Maniwaki (Quebec)
                    17. Mistassini (Quebec)
                                                                        46.    Alma (Quebec)
                    18. Opitciwan (Obedjiwan, Quebec)
                                                                        47.    Calhoun (Tennessee)
                    19. Outardes (Pointe-aux-Outardes, Quebec)
                                                                        48.    Dolbeau (Quebec)*
                    20. Saint-Félicien (Quebec)                         49.    Kénogami (Saguenay, Quebec)
                    21. Saint-Thomas (Quebec)
                    22. Senneterre (Quebec)
                    23. Thunder Bay (Ontario)
                                                                        50.    Hydro-Saguenay (Saguenay, Quebec)
                    Wood pellet plant
                    24. Thunder Bay (Ontario)
                    Remanufactured wood products facilities
                    25. Château-Richer (Quebec)                         51.    Normandin (Quebec) - Planer mill
                    26. La Doré (Quebec)                                52.    Roberval (Quebec) - Lumber drying facility
                    Engineered wood products facilities                 53.    Saint-Prime (Quebec) - Lumber drying facility
                    27. Resolute-LP - Larouche (Quebec)                 54.    Talladega (Alabama) - Chip production mill
                    28. Resolute-LP - Saint-Prime (Quebec)              55.    Tampa (Florida) - Paper recycling center

                                                                      * On-site cogeneration facility

             TD Securities Paper & Forest Products Virtual Conference September 29, 2021                                       4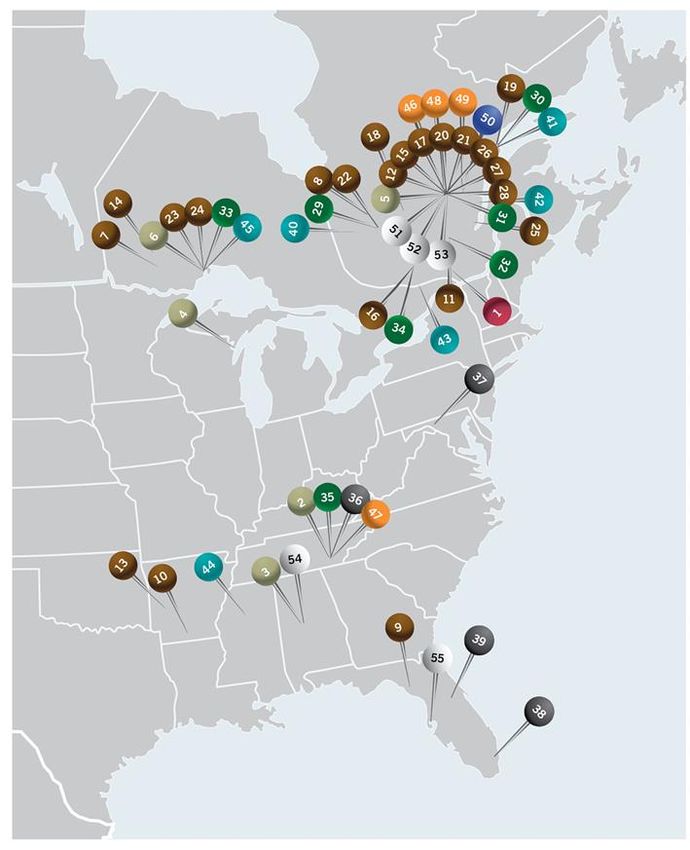
OUR STRATEGY
                                                                                                                Industry
                                                                                                                 Growth

 Wood      • Capitalize on favorable macro environment
           • Scale opportunities through M&A
Products   • Invest in high return and short payback capital projects

 Market    • Build on key top-quality assets
  Pulp     • Focus on organic growth projects and leverage low-cost operations

 Tissue    • Drive operational performance and leverage integration with market pulp
           • Optimize converting and distribution capacity geographically

           • Maximize free cash flow generation from existing operations and assets
 Paper     • Manage structural demand decline
           • Leverage potential conversion opportunities

                                              Legend

                                         Growth Markets

                                          TD Securities Paper & Forest Products Virtual Conference September 29, 2021   5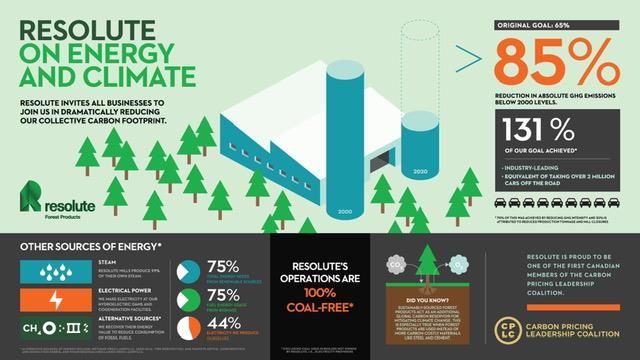
OUR CAPITAL ALLOCATION
                                     TOP PRIORITIES

   Acquisition opportunities – lumber and pulp at the right price

   Internal growth projects – harvest low hanging fruit opportunities

   Capex investments – focus on strategic opportunities and transformation

   Debt reduction – continue deleveraging to offset pension

   Opportunistically return cash to shareholders

                                        TD Securities Paper & Forest Products Virtual Conference September 29, 2021   6
STRATEGY TRANSFORMATION

             TD Securities Paper & Forest Products Virtual Conference   September 29, 2021   7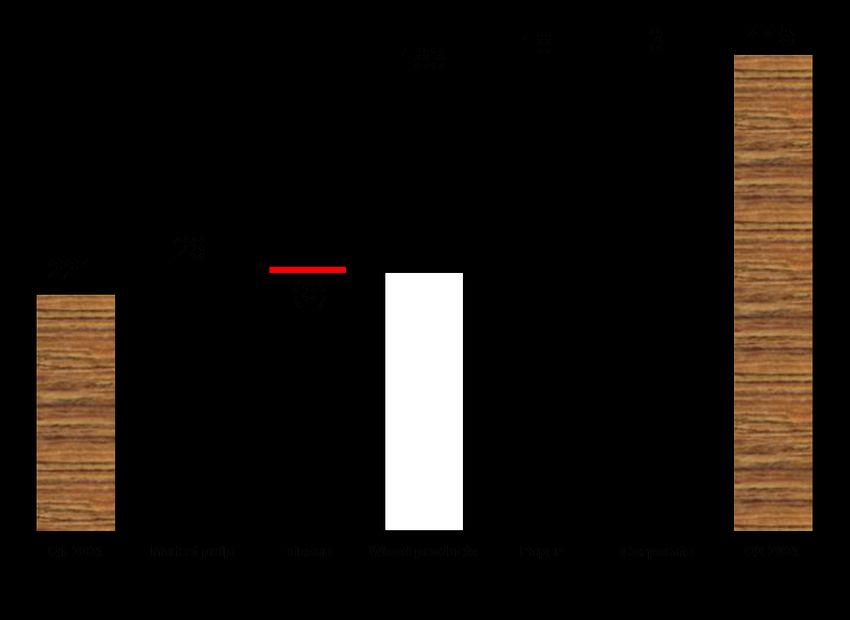
STRATEGY TRANSFORMATION
                                 2011                                                               LTM Q2 2021
                                                                     Growth Markets                                                          Growth Markets
                              $4.8 billion                               = 24%                          $3.5 billion                             = 74%
                                                 Market pulp                                                             Market pulp
                                                    14%                                         Paper                       20%
                                                                                                 26%
     Sales

                                                         Wood
                                                        products
                                                          10%                                                                   Tissue1
                                                                                                                                  4%

                                                                                          Wood
                                                                                         products
                                                                                           50%
                         Paper
                          76%

                             $481 million                            Growth Markets
                                                                         = 25%
                                                                                                    $988 million                             Growth Markets
                                                                                                                                                = 100%
                                                    Market
                                                     pulp                                                                   Market pulp
EBITDA2,3

                                                                                                                                5%
Adjusted

                                                     23%

                                                                                                                                Tissue
                                                                                                                                  1%
                                                           Wood
                                                          products
                                                             2%

                                                                                          Wood
                         Paper                                                           products
                          75%                                                              94%

    1.   Operating results of our Calhoun (Tennessee) tissue operations have been recorded in our tissue segment since April 1, 2018.
    2.   For illustrative purposes, chart excludes adjusted EBITDA for “corporate and other” of negative $7 million for the year ended December 31, 2011 and
         negative $53 million for the 12 months ended June 30, 2021.
    3.   Adjusted EBITDA is a non-GAAP financial measure. Refer to Appendices A, B and C for a definition and reconciliation of non-GAAP financial measures.

                                                                   TD Securities Paper & Forest Products Virtual Conference            September 29, 2021      8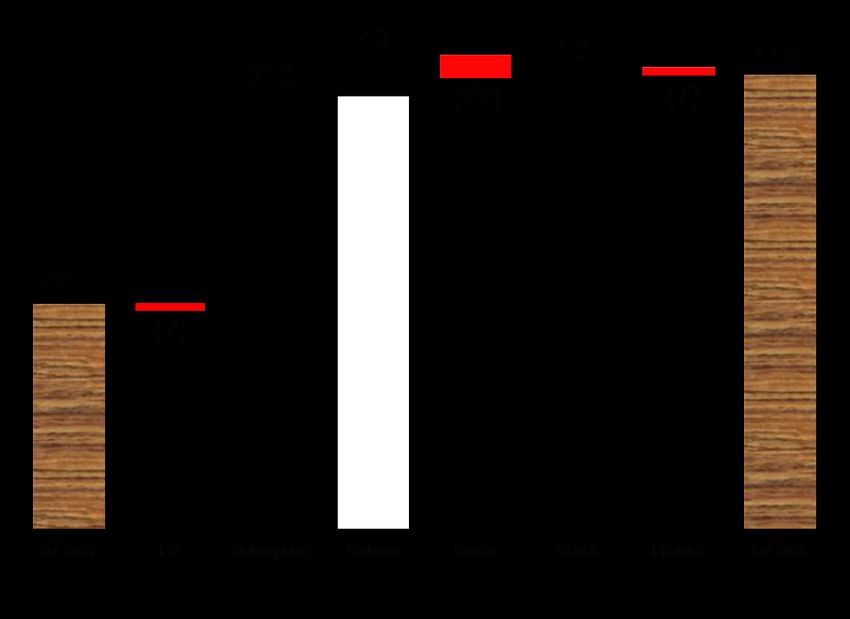
OUR COMPETITIVE STRENGTHS

                          • Developed a sophisticated infrastructure to manage fiber flows from
    FIBER ACCESS            harvesting through transformation into a range of end products to maximize
                            resource utilization and process efficiency
                          • Harvesting rights for the majority of fiber needs in Canada

                          • Large-scale and cost-effective operations, including significant internal
  COMPETITIVE COST          energy production, which support our value proposition
    STRUCTURE             • Integration = control over fiber transformation chain from stump to end
                            product for majority of offering

                          • Strong liquidity
STRONG BALANCE SHEET      • Favorable financing and strong liquidity = maximum flexibility
                          • Significant tax attributes available

                          • Deep industry expertise with influential leaders in forestry, operations,
SEASONED MANAGEMENT         environmental risk management and public policy
                          • Culture of accountability, encouraging transparency and straightforwardness
       TEAM               • Core identify tied to renewable resources.thus harvesting in a truly
                            sustainable manner

     Fiber from trees is renewable, reusable and fossil-free, representing a
        core pillar in moving the world away from fossil-based material
                                   TD Securities Paper & Forest Products Virtual Conference   September 29, 2021   9
FINANCIALS LIQUIDITY
2021 2020 2019
Available liquidity
(US$M) Q2 Q1 Q4 Q3 Q2 Q1 Q4 Q3
Total debt $303 $482 $561 $561 $630 $821 $449 $424
Cash on hand 177 33 113 20 27 116 3 69
Available under revolving credit facilities 873 620 580 457 369 233 580 497
Available liquidity $1,050 $653 $693 $477 $396 $349 $583 $566
LTM Adj. EBITDA1 $935 $527 $338 $213 $96 $141 $213 $314
Net debt / LTM Adj. EBITDA1 0.1x 0.9x 1.3x 2.5x 6.3x 5.0x 2.1x 1.1x
Capital expenditures $33 $14 $25 $16 $16 $21 $31 $37
Q2-2021 Liquidity Highlights
• Strong liquidity position at $1.1 B
• Q2 repayment of revolving and term credit facilities of $180M
• 2021 CAPEX guidance increased to $125M, up by $25M, following the announcement of $50M
investments in wood projects expected to be completed by end of 2022
• Repurchased 0.3 million shares, or 0.4%, in Q2 ($3M) and 8.7 million shares in LTM, or 10% ($49.5M)
• Q2 lumber cash duty deposits of $57M (cumulative of $332M)
• Special cash dividend of $1.00 per share paid on July 7
TD Securities Paper & Forest Products Virtual Conference September 29, 2021 10FINANCIALS PENSION
FUNDING & ACCOUNTING POSITION – CANADA & U.S. (USD)
Total Pension Contributions
Pension Plans Deficit
1
160 Actual/estimate
Accounting Basis Dec. 2020
150
Net pension liabilities
140 1,440
(US$M)
Millions of USD
130 Funded ratio (%) 73%
120
Discount rate (%) 2.5%
110 Pension Plans Deficit
100 Funding Basis 2 Dec. 2020 June 2021 Variance
90 Funding deficit
629 445 (184)
(US$M)
80
2016 2017 2018 2019 2020 2021
1. Includes all pension contributions, excludes OPEB
2. Funding for pension plans in Canada are on a going concern basis and in the U.S. on a 25-year average interest rate basis. The funding results above suppose valuations
are performed on the date specified.
TD Securities Paper & Forest Products Virtual Conference September 29, 2021 11FINANCIALS TAX ATTRIBUTES
• Significant U.S. net operating losses (NOL); state NOL start
expiring in 2021 and federal in 2023
• Accounting “valuation allowance” does not affect ability to use
tax attributes for tax purposes
• Potential source of synergy on M&A transactions
TAX
Est. Tax attributes (US$) PRE-TAX
as of December 31, 2020 EFFECTED*
U.S. NOL carryforwards and deduction limitations $2.5B $647M
Canadian NOL carryforwards $39M $12M
Tax basis of depreciable assets (mainly Canada) 2.0B $555M
Canadian attributes - R&D expenses and credits N/A $273M
*At enacted future income tax rates
Note: Additional information on tax attributes available in our Q2 10-Q report
TD Securities Paper & Forest Products Virtual Conference September 29, 2021 12Q2-2021 FINANCIALS
FINANCIALS OVERVIEW
                           Adjusted EBITDA : Q2’21 vs. Q1’21

•   Higher selling price : wood products ↑ 32%; market pulp ↑ 22%; paper ↑ 7%
•   Higher shipments : wood products ↑ 17%
•   Higher costs : stumpage-fee driven input costs and freight costs
•   Lower selling, general and administrative expenses

             Adjusted EBITDA is a non-GAAP financial measure. Refer to Appendices A and B for a definition and reconciliation of non-GAAP financial measures.

                                                                    TD Securities Paper & Forest Products Virtual Conference                 September 29, 2021   14
FINANCIALS OVERVIEW
Adjusted EBITDA : Q2’21 vs. Q2’20
390 5 445
500 8
(1)
445
(53) (4) (4)
20
37 37
(6)
(39)
Q2 2020 FX Sales price Volume Costs SG&A Freight Q2 2021 Q2 2020 Market pulp Tissue Wood products Paper Corporate Q2 2021
• Higher selling price : wood products ↑ 202%; market pulp ↑ 27%; paper ↑ 7%
• Higher costs : higher fiber and maintenance costs
• Stronger Canadian dollar
Adjusted EBITDA is a non-GAAP financial measure. Refer to Appendices A and B for a definition and reconciliation of non-GAAP financial measures.
TD Securities Paper & Forest Products Virtual Conference September 29, 2021 15WOOD PRODUCTS U.S. housing starts seasonally adjusted annual
(US$M) Q2 2021 Q1 2021 rate average of 1.6 million in Q2, ↓ 2% vs. Q1
Q2 shipments ↑ 83k mbf vs. Q1
Sales 664 430 Q2 transaction price ↑ $282/mbf vs. Q1
Q2 delivered cost 2 ↑ $30/mbf vs. Q1
Operating income (loss) 405 221 Finished goods inventory ↓ 19k mbf vs. Q1
1 Inventory (000's mbf)
EBITDA 415 232
148 143
133
122 119 121 124
Shipments (mmbf) 575 492 97
shipments average transaction price (right-hand scale) Q3 2019 Q4 2019 Q1 2020 Q2 2020 Q3 2020 Q4 2020 Q1 2021 Q2 2021
1156 2x4 -RL #1-2 KD GL 2x4x8 Stud KD GL
900 1200
2x4 - RL #2 KD Southern Pine (Eastside) 2x4 - RL #2 KD Southern Pine (Westside)
850
1800
800 1000 Q2
1700
2021
750 1600
800 1500
700
1400
000's mbf
$/mbf
650 1300
600
600 575 1200
$/mbf
550 1100
400 1000
500 900
450 200 800
700
400
600
350 0 500
Q3 2019 Q4 2019 Q1 2020 Q2 2020 Q3 2020 Q4 2020 Q1 2021 Q2 2021 400
300
200
1. EBITDA is a non-GAAP financial measure. Refer to Appendices A and B for a definition and reconciliation of non-GAAP financial measures.
2. The delivered cost is the total cost of each ton shipped (cost of sales, distribution costs, selling, general and administrative expenses, and depreciation and amortization).
TD Securities Paper & Forest Products Virtual Conference September 29, 2021 16MARKET PULP
Market dynamics influenced by pandemic; tight
(US$M) Q2 2021 Q1 2021
supply and demand
World demand of chemical pulp ↓ 2% vs 2020 2
Sales 199 176
Hardwood ↓ 1%
Operating income (loss) 30 4 Softwood ↓ 5%
Q2 shipments ↓ 19k mt vs. Q1
1
36 10 Q2 transaction price ↑ $140/mt vs. Q1
EBITDA
Q2 delivered cost ↑ $35/mt vs. Q1
Shipments (000’s mt) 253 272 Finished goods inventory ↑ 17k mt vs. Q1
shipments average transaction price (right-hand scale)
550 900
787
500 800 Inventory (000's mt)
450 700
000's mt
400 600 $/mt
87
350 500 74 71
68 69
63
300 400 53
46
253
250 300
200 200
Q3 2019 Q4 2019 Q1 2020 Q2 2020 Q3 2020 Q4 2020 Q1 2021 Q2 2021 Q3 2019 Q4 2019 Q1 2020 Q2 2020 Q3 2020 Q4 2020 Q1 2021 Q2 2021
1. EBITDA is a non-GAAP financial measure. Refer to Appendices A and B for a definition and reconciliation of non-GAAP financial measures.
2. For the five months ended May 31, 2021 vs. May 31, 2020.
TD Securities Paper & Forest Products Virtual Conference September 29, 2021 17TISSUE
(US$M) Q2 2021 Q1 2021 US consumption ↓ 5% vs 2020 2
At-home shipments ↓ 12%
Sales 35 42 Away-from-home shipments stable
Q2 shipments ↓ 4k st vs. Q1
Operating income (loss) (7) (2) Q2 transaction price ↓ $56/st vs. Q1
Q2 delivered cost ↑ $295/st vs. Q1
1
EBITDA (3) 3 Finished goods inventory unchanged vs. Q1
Shipments (000’s st) 19 23
shipments average transaction price (right-hand scale)
45 1,900
1782
40 1,800
35 1,700 Inventory (000's st)
30 1,600
000's st
25 1,500 $/st
20 19 1,400
15 1,300
8 8 8
10 1,200 6 6 6
5 5
5 1,100
0 1,000
Q3 2019 Q4 2019 Q1 2020 Q2 2020 Q3 2020 Q4 2020 Q1 2021 Q2 2021 Q3 2019 Q4 2019 Q1 2020 Q2 2020 Q3 2020 Q4 2020 Q1 2021 Q2 2021
1. EBITDA is a non-GAAP financial measure. Refer to Appendices A and B for a definition and reconciliation of non-GAAP financial measures.
2. For the five months ended May 31, 2021 vs. May 31, 2020.
TD Securities Paper & Forest Products Virtual Conference September 29, 2021 18PAPER
2021 North America demand vs. 2020 2
(US$M) Q2 2021 Q1 2021
‒ flat for uncoated mechanical papers
‒ ↓ 10% for newsprint
Sales 242 225
Q2 shipments ↑ 4 mt vs. Q1
Q2 transaction price ↑ $39/mt vs. Q1
Operating income (loss) (7) (24)
Q2 delivered cost ↓ $13/mt vs. Q1
EBITDA1 9 (9) Finished goods inventory ↓ 15k mt vs. Q1
Shipments (000’s mt) 382 378
shipments average transaction price (right-hand scale)
800 700
635 650 Inventory (000's mt)
700
600
600
000's mt
550 $/mt
500 148 150
142
500 130 124
400 382
450 96
87
300 72
400
200 350
Q3 2019 Q4 2019 Q1 2020 Q2 2020 Q3 2020 Q4 2020 Q1 2021 Q2 2021 Q3 2019 Q4 2019 Q1 2020 Q2 2020 Q3 2020 Q4 2020 Q1 2021 Q2 2021
1. EBITDA is a non-GAAP financial measure. Refer to Appendices A and B for a definition and reconciliation of non-GAAP financial measures.
2. For the six months ended June 30, 2021 vs. June 30, 2020.
TD Securities Paper & Forest Products Virtual Conference September 29, 2021 19OTHER ACTIVITIES POWER GENERATION
External sales
Capacity Annualized external sales
Mill Type
(MW) (MWh/year)
Dolbeau-Mistassini, QC Cogen 28 193,000
Gatineau, QC Cogen 15 106,000
St-Félicien, QC Cogen 43 290,000
Thunder Bay, ON Cogen 65 431,000
TOTAL 151 1,020,000
EBITDA1 Q2 Q1 Q4 Q3 Q2 Q1 Q4 Q3 Q2
contribution 2021 2021 2020 2020 2020 2020 2019 2019 2019
from COGEN
(in $US 8 11 7 10 10 11 8 9 8
millions)
Cost savings
To generate lower cost energy for internal consumption, we operate cogeneration facilities and a network of
hydroelectric installations with total capacity of 284MW
Approximate annualized cost savings to operations:$40-45 million
1. EBITDA is a non-GAAP financial measure. Refer to Appendices A and B for a definition and reconciliation of non-GAAP financial measures.
TD Securities Paper & Forest Products Virtual Conference September 29, 2021 20SUSTAINABILITY
SUSTAINABLE FOREST MANAGEMENT
AND CHAIN OF CUSTODY CERTIFICATION
100% of Resolute-owned or managed Resolute is the world’s
woodlands are third-party certified to at least largest holder of SFI
one internationally recognized forest certification and among the
management standard: largest holders of FSC
Sustainable Forestry Initiative® (SFI®) certification in North
Forest Stewardship Council® (FSC®) America.
100% 3rd-PARTY-CERTIFIED Chain
of Custody (CoC)
• 13 PULP, PAPER AND TISSUE MILLS1 SUBSEQUENT USERS MUST
• 22 WOOD PRODUCT FACILITIES ALSO BE CoC-CERTIFIED
WOOD SUPPLIER TRANSPORT PUBLISHER/PRINTER
CERTIFIED FOREST PAPER MILL PAPER BROKER END USER
OR SOURCES
1. Excludes Amos and Baie-Comeau newsprint mills, indefinitely idled since Q1 2021
TD Securities Paper & Forest Products Virtual Conference September 29, 2021 22ENERGY AND CLIMATE CHANGE
Fiber from trees is renewable, reusable and fossil-free representing a core pillar in moving
the world away from fossil-based materials
TD Securities Paper & Forest Products Virtual Conference September 29, 2021 23APPENDIX A
TD Securities Paper & Forest Products Virtual Conference September 29, 2021 25
TD Securities Paper & Forest Products Virtual Conference September 29, 2021 26
TD Securities Paper & Forest Products Virtual Conference September 29, 2021 27
TD Securities Paper & Forest Products Virtual Conference September 29, 2021 28
APPENDIX B
TD Securities Paper & Forest Products Virtual Conference September 29, 2021 30
TD Securities Paper & Forest Products Virtual Conference September 29, 2021 31
TD Securities Paper & Forest Products Virtual Conference September 29, 2021 32
TD Securities Paper & Forest Products Virtual Conference September 29, 2021 33
TD Securities Paper & Forest Products Virtual Conference September 29, 2021 34
TD SECURITIES
PAPER & FOREST PRODUCTS
  VIRTUAL CONFERENCE

                     SEPTEMBER 29, 2021
You can also read