Tech in the Town How the Fourth Industrial Revolution could transform local government - The Social Market Foundation
←
→
Page content transcription
If your browser does not render page correctly, please read the page content below
Tech in the Town
How the Fourth Industrial Revolution could transform local
government

Scott Corfe
SOCIAL MARKET FOUNDATION

FIRST PUBLISHED BY
The Social Market Foundation, May 2019
11 Tufton Street, London SW1P 3QB
Copyright © The Social Market Foundation, 2019
ISBN: 978-1-910683-65-1

The moral right of the author(s) has been asserted. All rights reserved. Without limiting the rights under
copyright reserved above, no part of this publication may be reproduced, stored or introduced into a
retrieval system, or transmitted, in any form or by any means (electronic, mechanical, photocopying,
recording, or otherwise), without the prior written permission of both the copyright owner and the
publisher of this book.

THE SOCIAL MARKET FOUNDATION
The Foundation’s main activity is to commission and publish original papers by independent
academic and other experts on key topics in the economic and social fields, with a view to stimulating
public discussion on the performance of markets and the social framework within which they operate.
The Foundation is a registered charity and a company limited by guarantee. It is independent of any
political party or group and is funded predominantly through sponsorship of research and public policy
debates. The views expressed in this publication are those of the author, and these do not necessarily
reflect the views of the sponsors or the Social Market Foundation.

CHAIR                                                  DIRECTOR
Mary Ann Sieghart                                      James Kirkup

TRUSTEES
Baroness Grender MBE
Nicola Horlick
Tom Ebbutt
Rt Hon Nicky Morgan MP
Rt Hon Dame Margaret Hodge MP
Peter Readman
Melville Rodrigues
Trevor Phillips OBE
Professor Tim Bale

KINDLY SUPPORTED BY
This report was funded by Vodafone.

                                                                                                         2
TECH IN THE TOWN

CONTENTS

ACKNOWLEDGEMENTS........................................................................................................................ 4
ABOUT THE SOCIAL MARKET FOUNDATION ........................................................................................... 4
ABOUT THE AUTHORS ......................................................................................................................... 4
FOREWORD FROM THE SPONSOR ........................................................................................................ 5
EXECUTIVE SUMMARY ........................................................................................................................ 6
CHAPTER 1: INTRODUCTION ................................................................................................................ 9
CHAPTER 2: SETTING THE SCENE – THE CHALLENGES FACING LOCAL GOVERNMENT IN THE 21ST CENTURY
........................................................................................................................................................ 12
   Local government finances under significant pressure .....................................................................13
   Gridlock Britain - pressures on local transport networks ................................................................... 14
   The need to create greener communities ......................................................................................... 17
   Growing populations - with associated pressure on public services ................................................. 19
CHAPTER 2: HOW CAN 4IR HELP? ....................................................................................................... 20
   Greener and cleaner streets –smart bins and street lighting ............................................................ 20
      Environmental monitoring........................................................................................................... 20
      Smart street lighting .................................................................................................................. 20
      A recycling revolution ................................................................................................................. 22
      Goodbye to gridlock – the impact of 4IR on cars and roads ........................................................... 23
      Encouraging greener, more efficient use of cars .......................................................................... 23
      New charging models for roads ................................................................................................... 24
      Finding a parking space - at a fair price ....................................................................................... 25
      Smart signage............................................................................................................................ 25
   Increasing the attractiveness of public transport............................................................................. 27
   Creating towns and cities fit for the future ...................................................................................... 28
CHAPTER 3: CHALLENGES IN REALISING THE BENEFITS OF 4IR ............................................................ 30
   Financing the 4IR revolution and building an evidence base ............................................................ 30
   Public concerns ............................................................................................................................ 30
   Has local government got what it takes? The digital skills gap ...........................................................31
   Will 4IR make some things worse? .................................................................................................. 32
CHAPTER 4: WHAT NEXT FOR POLICYMARKETS? ................................................................................. 34
   Creating a local government 4IR innovation fund ............................................................................. 34
   Embedding innovation into outsourcing with outcome-based contracts ........................................... 35
   Carrots, not sticks. Getting public support for new pricing structures ............................................... 36
ENDNOTES ....................................................................................................................................... 37

                                                                                                                                                         3
SOCIAL MARKET FOUNDATION

ACKNOWLEDGEMENTS
The SMF is grateful to the Vodafone for sponsoring this research. The views in the report do not
necessarily reflect those of the Vodafone. The Social Market Foundation retains full editorial
independence with respect to its research. The authors are grateful to all those who participated
in the two roundtable discussions held as part of the work.

ABOUT THE SOCIAL MARKET FOUNDATION

The Foundation’s main activity is to commission and publish original papers by independent
academic and other experts on key topics in the economic and social fields, with a view to
stimulating public discussion on the performance of markets and the social framework within
which they operate.

The Foundation is a registered charity and a company limited by guarantee. It is independent of
any political party or group and is funded predominantly through sponsorship of research and
public policy debates. The views expressed in this publication are those of the author, and these
do not necessarily reflect the views of the sponsors or the Social Market Foundation.

ABOUT THE AUTHORS

Scott Corfe

Scott Corfe joined the SMF as Chief Economist in 2017. Before joining, he was Head of
Macroeconomics and a Director at the economics consultancy Cebr, where he led much of the
consultancy’s thought leadership and public policy research. His expert insights are frequently
sought after in publications including the Financial Times, the Sunday Times, the Guardian and
the Daily Telegraph. Scott has appeared on BBC News, Sky News, Radio 4 and a range of other
broadcast media.

Scott was voted one of the top three forecasters of UK GDP by Focus Economics in 2016.

                                                                                               4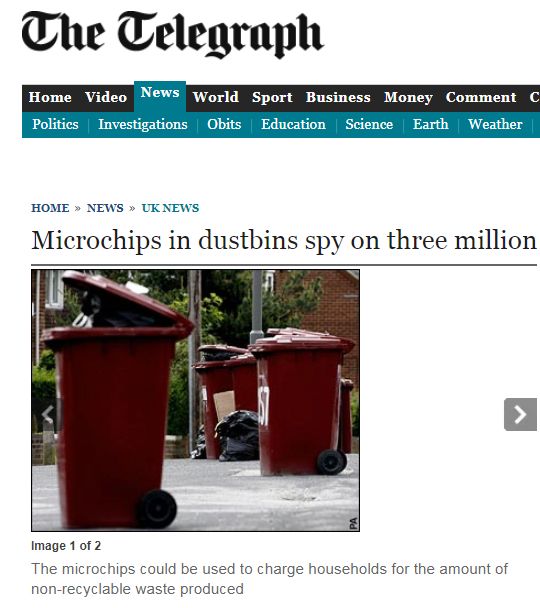
TECH IN THE TOWN

FOREWORD FROM THE SPONSOR

Just as technology in our homes and workplaces is changing the way we live and do our jobs, it
is also transforming the villages, towns and cities around us. Faster, more reliable mobile
coverage, full fibre broadband and the Internet of Things are not only changing how we interact
with our public services, but the very fundamentals of how they operate.

The Fourth Industrial Revolution is making it easier and cheaper for decision makers to deliver
responsive, high quality services to residents and businesses across the UK. Whether it is CCTV
that also measures congestion and pollution, street lights that automatically adapt to the
weather, or bins that announce when they need emptying, avoiding unnecessary collections,
new technologies are making an impact.

Vodafone is proud to be the global leader in Internet of Things technology, with over 70 million
devices connected around the world. Whether it’s this extensive grid of connected sensors or
our 5G and full fibre networks, we see the difference that these technologies make to people’s
lives every day. I am delighted to support this report from the Social Market Foundation, which
serves as an important intervention in the debate on how best to maximise the benefits of these
technologies for all of us.

Anne Sheehan, Enterprise Director, Vodafone

                                                                                              5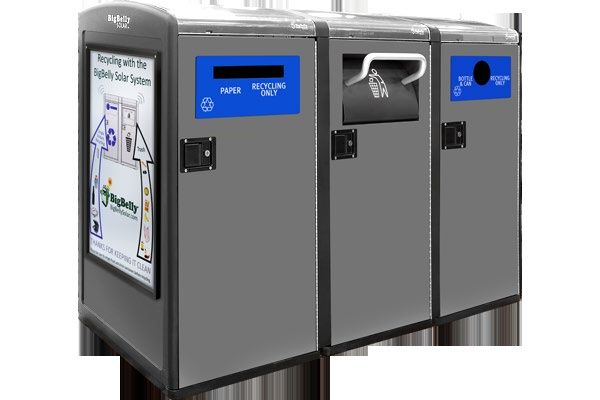
SOCIAL MARKET FOUNDATION

EXECUTIVE SUMMARY

This report explores the role that Fourth Industrial Revolution (4IR) technologies can play in
improving the UK’s urban areas and local public services. It is the third in a series of SMF reports
on 4IR, following our 2018 reports on the use of 4IR in the home and the workplace.

Terms:

4IR refers to the latest technologies which are building on the digital revolution that commenced
in the second half of the 20th Century. This includes internet-connected household appliances
(“the internet of things”), driverless cars, big data, robotics and artificial intelligence.

Context:

Many communities find themselves in a challenging set of circumstances in 21st century Britain.
While local government finances remain under strain after years of fiscal austerity, local
authorities are under significant pressure to address a wide range of issues. This includes air
pollution, light pollution, congestion, waste and other local-level environmental issues.

Analysis in this report shows that:

   •     Local government finances remain under pressure. Local government has been running
         a fiscal deficit almost constantly for the past two decades.

   •     Local transport infrastructure will struggle as the number of cars on the road is set to
         increase. Across England and Wales, the proportion of roads that are heavily congested
         in the morning peak is set to increase from 11% in 2015 to 17% by 2050.

   •     UK roads are in poor shape. 905,000 potholes were reported on UK roads in the 2017/18
         fiscal year, costing councils on average £169 each to address.

   •     Local government is struggling to address environmental concerns, including the need
         to improve household recycling rates. While 64.5% of household waste was recycled,
         reused or composted in the East Riding of Yorkshire in 2017/18, just 14.1% of waste in the
         London borough of Newham was.

   •     Growing populations will place pressure on local community infrastructure, to a varying
         degree across the country.

Benefits of 4IR in local government

The Fourth Industrial Revolution can address a number of the challenges outlined above. Benefits
outlined in this report include:

   •     Saving money and reducing light pollution with smart street lighting. Smart street lighting
         is currently being explored as a way of reducing light pollution, generating financial
         savings and offering other benefits to local government.

                                                                                                  6
TECH IN THE TOWN

   •    A recycling revolution with smart bins. This includes bins fitted with fill-sensors,
        identifying when they require emptying. Smart bins have also been developed which
        automatically sort recyclable and unrecyclable waste.

   •    Improved road quality via the use of road-repairing drones which can detect potholes and
        are fitted with 3D printers which are able to spray asphalt into potholes. In addition,
        telematic boxes and cameras fitted to cars can detect potholes and notify highway
        maintenance authorities about repair needs.

   •    Autonomous public transport. In Singapore, there are plans to introduce driverless buses
        on its public roads by 2022.

   •    Smarter road pricing and parking charges which encourage individuals to travel into urban
        areas when traffic is less congested.

   •    The ability to rethink planning and urban spaces. For example, increasing proportions of
        inner-city land can be devoted to housing as retail increasingly shifts from being store-
        based to web-based. Shared smart town/city data (for example on footfall) can help
        businesses decide where to locate, as well as their opening hours.

Challenges in realising these benefits

While 4IR brings with it a wide range of opportunities for local government, realising these
benefits is not without its challenges. This includes:

   •    Financing challenges. 4IR has the potential to offer significant improvements and cash
        savings for local government, but in several instances there may be significant upfront
        costs and infrastructure requirements.

   •    Public concerns. For example, recent news stories have raised concerns about “spying
        bins and cars” with respect to smart, internet-connected technologies.

   •    A shortage of digital skills in local government. In its 2014/15 workforce survey, the Local
        Government Association found that over two thirds (68%) of local authorities in England
        had a capability or capacity gap in terms of supporting digitisation.

   •    The potential for 4IR to create and exacerbate economic and social problems in local
        communities. For example, the decline of high street retail could erode receipts from
        business rates and parking charges, and isolate the digitally excluded.

The role for policymakers

This report sets out three practical policy recommendations that we believe could encourage
more widespread use of 4IR technologies across local communities in the UK – creating a wave
of “smart cities” and even “smart towns”:

   1.   Create a local government “4IR innovation fund” to incentivise the rollout of 4IR
        technologies such as smart street lighting, drones, autonomous public transport and

                                                                                                  7
SOCIAL MARKET FOUNDATION
smart bins, and to help build an evidence base on the long-term financial benefits of
such technologies.
2. Explore the role that outcome-based contracts could play in encouraging private sector
providers of outsourced services to roll out new technologies. Under outcome-based
contracts, service providers are paid according to the outcomes they deliver, rather than
the means with which they reach such outcomes. In the case of waste collection, for
example, service providers could be paid to ensure that bins are never overfull. Under
outcomes-based contracts, waste collecting firms might be incentivised to roll out bin-
fill sensors and only empty bins on an as-needed basis, as a way of saving money.
3. Dynamic road and parking charges, and new smart bin collection charges, should either
operate on a largely revenue-neutral basis, or in a way that generates clear, tangible
benefits to households and businesses. A carrot rather than a stick-based approach to
dynamic pricing might be most acceptable to the public. For example, households that
produce less waste or recycle more could be awarded some form of Council Tax rebate.
8TECH IN THE TOWN
CHAPTER 1: INTRODUCTION
A technological epoque – the Fourth Industrial Revolution (4IR) – is dramatically changing the
way we live, work and travel. The rise of automation, robotics, artificial intelligence and data
analytics is opening up new possibilities for individuals and companies to realise productivity
gains and improve living standards – as discussed in past Social Market Foundation (SMF)
reports on 4IR in the home and the workplacei.
But the potential benefits of 4IR extend beyond the home and work– into the streetscapes of our
towns, cities and villages, and the services provided by local government. This report explores
the role that 4IR can play in improving our urban areas and local public services – and the policy
interventions needed to ensure these benefits manifest in reality.
At present, local government in the UK is just dipping its toes into the water in its use of 4IR
technologies. While some local authorities, such as Glasgow City Council and Rugby Borough
Council, are being innovative and exploring the benefits of “smart city” technologies, for the
most part UK local authorities are not being bold enough in taking advantage of new internet-
connected devices, robotics, artificial intelligence and data analytics.
Yet, as we discuss in this report, the benefits of utilising these technologies could be enormous.
For example, the initial rollout of smart street lighting, drones, autonomous public transport and
bins, in the UK and elsewhere, is already highlighting the potential for automation and internet-
connectivity to both enhance public services and deliver substantial financial savings for local
government.
The Fourth Industrial Revolution comes at a time when local government finances in the UK
remain under pressure. Rolling out new technologies – such as smart streetlights and bins – will
often require upfront capital investment, raising questions around where such funds will come
from. Critically, as we argue in this report, government needs to take a medium-to-long term view
on large investments. Evidence shows that they can pay for themselves and generate significant
financial savings for local government after a number of years.
Other 4IR technologies, such as internet-connected heat sensors which detect ice and enable
more efficient road gritting, are much cheaper, paying for themselves more rapidly through cost
savings.
Ensuring that investments do indeed pay off will require policymakers to start building a more
robust evidence base on the long-term financial implications of new technologies. The use of
“4IR innovation funds” for local government, to encourage experimentation and help build this
evidence base, could prove invaluable here. In addition, with respect to outsourced services,
outcomes-based contracts can create stronger incentives for service providers to adopt new
productivity-enhancing technologies.
Done right, the use of 4IR in our communities can deliver a range of benefits for local authorities
– and the individuals living in them. This includes more efficient access to services, improved
transportation, cleaner streets and better-designed urban environments. There is scope for
these technologies, provided they are rolled out across the UK, to help narrow some of the stark
economic divides which dog the country.
9SOCIAL MARKET FOUNDATION
As recent news stories have highlighted, 4IR will only succeed if it has widespread public
support. This means emphasising the benefits of these technologies to households and
addressing concerns about the risks – such as intrusive monitoring and increased costs for
services such as car parking.
The structure of the report is as follows:
● Chapter 2 examines some of the challenges facing local government in 21st century
Britain.
● Chapter 3 explores the applications of 4IR technologies in addressing these challenges
and delivering other benefits.
● Chapter 4 examines the challenges associated with realising the benefits of 4IR in local
communities.
● Chapter 5 explores the role for policymakers in maximising the benefits of 4IR in local
government.
10TECH IN THE TOWN
What do we mean by 4IR?
The Fourth Industrial Revolution (4IR) is a term that is gaining mainstream use as the technology that underpins
it is becoming more and more relevant in our day-to-day lives. Yet many of us do not know what the Fourth
Industrial Revolution is, or are confused by the terms used to describe the technologies that comprise 4IR – the
internet of things, big data and machine learning, for example. This report seeks to address this issue.
A simple way to consider progress is that:
• The First Industrial Revolution saw water and steam used to power and mechanize production.
• The Second used electric power to create mass production.
• The Third used electronics and information technology to automate production.
• The Fourth Industrial Revolution is building on the Third, the digital revolution that has been
occurring since the middle of the last century.
4IR is characterized by a fusion of technologies that is blurring the lines between the physical, digital, and
biological spheres – artificial intelligence, big data, machine learning and “the internet of things” which is
seeing an increasing proportion of household and business appliances connected to the internet.
According to the World Economic Forum, there are three reasons why today’s transformations represent more
than a prolongation of the Third Industrial Revolution but rather the arrival of a Fourth and distinct one: speed,
scope, and systems impact. On speed, when compared with previous industrial revolutions, the Fourth is
evolving at an exponential rather than a linear pace. In scope, it is disrupting almost every industry in every
country, with robotics and artificial intelligence potentially changing the types of jobs available in our economy
dramatically – and the skills needed to perform them. The breadth and depth of these changes could transform
the entire system of production, management, and governance.
Definitions of the types of technologies comprising the Fourth Industrial Revolution vary from source to
source, though in this research our focus lies on:
• The internet of things –appliances and devices that are connected to the internet, enabling them
to send and receive data. Examples include “smart” washing machines and thermostats which can
be controlled remotely, for example via a smartphone.
• Big data – the use of large datasets (e.g. of consumer behaviours) created and analysed using
new technologies.
• Artificial intelligence – complex algorithms capable of decision-making and learning over time.
• Robotics – the use of machines to automate tasks.
• Connected and autonomous vehicles such as “driverless cars”.
11SOCIAL MARKET FOUNDATION
CHAPTER 2: SETTING THE SCENE – THE CHALLENGES FACING LOCAL GOVERNMENT IN THE 21ST
CENTURY
Many communities find themselves in a challenging set of circumstances in 21st century Britain.
While local government finances remain under strain after years of fiscal austerity, local
authorities are under significant pressure to address a wide range of issues. This includes
increased demand for social care as the population ages, rising crime in some parts of the
country, air pollution and other local-level environmental issues. Transport infrastructure is under
pressure, with news stories aplenty about poor public transport, congested roads and “pothole
Britain”.
There are also questions around how different communities will fare, economically, over the
coming decades. There is a risk that while automation, AI and the “data revolution” could kick-
start productivity growth in some parts of the country, it could lead to job losses elsewhere and
widen the already stark variations in economic performance across the UK. This has implications
for local government itself, both in terms of the demand for the services it provides, as well as
the tax receipts that it receives. As industries such as retail change dramatically through the rise
of the internet, areas which fail to adapt to change risk seeing business rate receipts dry up as
traditional high street stores fade away.
As the table below shows, local government is responsible for a wide range of services, many of
which are likely to see significant changes and demand pressures over the coming years.
Table 1 Responsibilities of local government
County councils/Unitary District, borough, unitary and Parish, community and town
authorities city councils councils
Education Rubbish collection Allotments
Transport Recycling Public clocks
Planning Council Tax collections Bus shelters
Fire and public safety Housing Community centres
Social care Planning applications Play areas and play equipment
Libraries Grants to help local
organisations
Waste management Consultation on
neighbourhood planning
Trading standards Issuing fixed penalty fines for
things such as litter, graffiti, fly
tipping and dog offences
12TECH IN THE TOWN
This chapter of the report provides an overview of the challenges and issues that local
government is likely to face over the coming years and decades in meeting these responsibilities.
In particular, we focus on local government services that have a direct bearing on our local
environments – our houses, roads and centres of commerce.
Local government finances under significant pressure
The financial situation in which local communities will need to address substantial economic,
environmental and social challenges over the coming decades is difficult. Local government
remains in the midst of a significant funding crisis. Over the 12 months to January 2019, net local
government borrowing – the extent to which UK local government spending exceeded revenues
– stood at £5.6bn. As Figure 1 shows, local government has been running a fiscal deficit almost
constantly for the past two decades. Consequently, local government debt levels have been
rising, and are set to soon pass the £100bn mark, mostly consisting of loan debt.
At the same time, many local government services are under pressure. A growing and ageing
population, deteriorating roads, and the need to address environmental concerns mean that
financial pressures on many services are increasing – not decreasing. Pressures to spend more
money on social care, amid an ageing population, mean money for environmental services and
transport infrastructure could become increasingly squeezed.
Figure 1 Local government borrowing and debt
120
100
80
60
40
20
0
-20
Jan-99
Jan-00
Jan-01
Jan-02
Jan-03
Jan-04
Jan-05
Jan-06
Jan-07
Jan-08
Jan-09
Jan-10
Jan-11
Jan-12
Jan-13
Jan-14
Jan-15
Jan-16
Jan-17
Jan-18
Jan-19
Local government gross debt - bonds, £bn
Local government gross debt - loans, £bn
Local government net borrowing (£bn, 12 month rolling total, negative value implies a fiscal
deficit)
Source: ONS, SMF analysis
13SOCIAL MARKET FOUNDATION
Figure 2 Estimated net current local authority expenditure, by service, England, 2018-19, £bns
Education
Adult Social Care
Police services
Children's Social Care
Environmental services
Highways and transport
Public Health
Central services
Cultural services
Fire and rescue services
Housing services
Planning and development
Other
0 5 10 15 20 25 30 35 40
Source: Ministry of Housing, Communities & Local Government
Gridlock Britain - pressures on local transport networks
Travelling – for work, leisure and other purposes – is a key part of our day-to-day lives. Road
congestion, high travel costs, delays and overcrowding on public transport can all have a
significant negative impact on our wellbeing. Research by the Office for National Statistics shows
that those with lengthy commutes tend to have lower levels of happiness and higher anxiety than
non-commuters ii.
Yet, official forecasts suggest commutes across the UK are set to become more stressful.
Increasing numbers of cars on the road over the coming years mean that a growing proportion of
the road network will be heavily congested, leading to declining average speeds. Across England
and Wales, the proportion of roads that are heavily congested (flowing at 80% or more of
capacity) in the morning peak is set to increase from 11% in 2015 to 17% by 2050. In Greater
London, this proportion is set to rise from 28% to 37%.
14TECH IN THE TOWN
Figure 3 Percentage of traffic in heavily congested conditions (flowing at 80% or more of
capacity), weekday morning peak
40%
35%
30%
25%
20%
15%
10%
5%
0%
London West Eastern North North East Yorks & East South Wales South
Midlands England West Humber Midlands East West
2015 2050
Department for Transport Road Traffic Forecasts, central scenario
Figure 4 Average car speed in England and Wales, weekday AM peak, miles per hour
40
35
30
25
20
15
10
5
0
London North East Yorks & West North West Eastern East South East South Wales
Humber Midlands England Midlands West
2015 2050
Source: Department for Transport Road Traffic Forecasts, central scenario
Ensuring road infrastructure keeps up with demand will be a key challenge for local government.
15SOCIAL MARKET FOUNDATION
As well as building new stretches of road where relevant, the quality of the existing road network
will need to be maintained. Already, councils are struggling to do so; a freedom of information
request submitted by the price comparison website Confused.com revealed that 905,000
potholes were reported on UK roads in the 2017/18 fiscal year, costing councils on average £169
each to address iii. According to the Annual Local Authority Road Maintenance (ALARM) Survey
produced by the Asphalt Industry Alliance, a growing proportion of roads in England are in such
bad condition that they have less than 5 years’ life remaining. In London, over a quarter (26%) of
roads are in such a poor state of repairiv.
The ALARM survey also estimates that, at present, the shortfall in funding provided for
carriageway repairs, compared with what is needed, stands at over £650m.
Figure 5 Percentage of roads with less than five years’ life remaining
30%
25%
20%
15%
10%
5%
0%
2016/17 2017/18 2018/19
England (exc. London) London Wales
Source: Annual Local Authority Road Maintenance Survey produced by the Asphalt Industry Alliance
Car parking – or rather the lack of it – is also set to become a growing issue for local authorities
over the coming years. As well as ensuring an economically and socially optimal number of
parking spaces, local authorities will increasingly need to think about the pricing mechanism for
parking. As a report by the RAC Foundation noted, there is currently a considerable divergence
between current parking charges and “efficient” market-based prices based on the underlying
supply and demand for parking v. This leads to situations where demand for car parks is either too
high (leading to cars circling urban areas in search of spaces) or too low (meaning local
authorities are losing out on parking revenue).
Addressing the growing problem of congestion on UK roads will require local (and indeed
national) government to do more to encourage alternative modes of travel beyond private cars.
16TECH IN THE TOWN
This includes increased use of car sharing clubs, encouraging walking and cycling, and improving
the public transport infrastructure in local communities. For many councils across the UK, this
will require a dramatic step-change from where they are now in terms of public transport
provision – as well as some honest conversations with the public about the unsustainability of
our current dependence on private transport.
The need to create greener communities
Increasingly, there is an expectation for local government to address some of the substantial
environment issues facing the UK, and indeed the world.
In addition to global warming and climate change, recent years have seen increased concern
about air pollution. A recent study published in the European Heart Journal found that emissions
are responsible for 64,000 annual deaths in the UK, just 18% less than the 78,000 deaths caused
by tobacco vi.
Beyond air pollution, there are also concerns about the environmental and health impacts of light
and sound pollution. While not as widely discussed as air pollution, light pollution has a range of
environmental impacts, including disrupting the sleeping behaviour and safety of animals such
as birds and bats vii. There is also evidence that light pollution has a negative impact on quality of
sleep among humans – for example by making individuals fall asleep later and then struggle to
wake up in time for work, school and social engagements viii.
As we discuss in the next chapter of this report, technology is providing new opportunities to
monitor and limit air, light and noise pollution going forward, through the use of smart, internet-
connected monitoring devices.
Finally, local authorities are under growing pressure to reduce waste and improve rates of
recycling. At present there are substantial variations in the amount of waste generated that is
recycled across the UK; while 64.5% of household waste was recycled, reused or composted in
the East Riding of Yorkshire Council in 2017/18, just 14.1% of waste in the London borough of
Newham was. For the UK to match EU ambitions to increase household recycling rates to 50% in
2020, 55% in 2025 and 60% in 2030 ix, such substantial differences in regional recycling rates
will need to be reduced.
17SOCIAL MARKET FOUNDATION
Figure 6 % of household waste that is recycled, reused or composted, by local authority in
England
70%
60%
50%
40%
30%
20%
10%
0%
Epsom and Ewell Borough…
Surrey Heath Borough Council
Liverpool City Council
Nottingham City Council
Amber Valley Borough Council
Merseyside WDA (MBC)
Woking Borough Council
Lincolnshire County Council
Calderdale MBC
Shropshire
Sefton MBC
Mid Suffolk District Council
Newham LB
Daventry District Council
Stoke-on-Trent City Council
Carlisle City Council
Rugby Borough Council
Ryedale District Council
Source: SMF analysis of Defra waste data
Table 2 Top 10 and bottom 10 local authorities in England, by recycling rate
Top 10 local authorities, by household Bottom 10 local authorities, by household
recycling rate recycling rate
Local authority Recycling Local authority Recycling
rate rate
East Riding of Yorkshire Council 64.5% Newham 14.1%
Rochford District Council 63.0% Westminster City Council 18.8%
South Oxfordshire District Council 63.0% Barrow-in-Furness Borough Council 19.6%
Three Rivers District Council 62.4% Birmingham City Council 20.7%
Surrey Heath Borough Council 61.4% Council of the Isles of Scilly 21.2%
Stroud District Council 61.2% Lewisham 21.8%
South Northamptonshire District
Council 60.5% Wandsworth 22.1%
Vale of White Horse District Council 60.4% Gosport Borough Council 23.0%
Derbyshire Dales District Council 60.3% Hammersmith and Fulham 23.7%
Stratford-on-Avon District Council 60.3% Slough Borough Council 23.9%
Source: SMF analysis of Defra waste data
18TECH IN THE TOWN
Growing populations - with associated pressure on public services
The population of the UK is growing. Critically, population growth will not be even across age
groups or local authorities – leading to widespread variations in demographic trends over the
coming years.
While Tower Hamlets is expected to see its population increase by about a quarter (24%)
between 2019 and 2039 (the highest of any local authority in England), the population of Barrow-
in-Furness is expected to decline by 9% (the biggest decline of any local authority in England).
Where populations are growing more strongly, local authorities will have to contend with
increased pressure on local community infrastructure, such as road and public transport
networks. As the government has noted in its Future of Mobility Urban Strategy, increased
demand for road travel over the coming years will largely be due to population growth rather than
people travelling more miles on average. Indeed the strategy notes that people are travelling less
per person now than one or two decades ago x.
Table 3 Top 10 and bottom 10 local authorities in England, by population growth between 2019
and 2039
Top 10 local authorities, by population growth Bottom 10 local authorities, by population
growth
Local authority Expected Local authority Expected
population population
growth growth
Tower Hamlets 23.9% Barrow-in-Furness -8.8%
Corby 23.1% Copeland -8.3%
Coventry 22.8% Richmondshire -4.4%
Havering 21.7% Isles of Scilly -4.2%
Barking and Dagenham 21.3% Hyndburn -3.1%
Dartford 20.6% North East Lincolnshire -1.8%
Aylesbury Vale 20.0% Blackpool -1.7%
Hackney 19.3% South Lakeland -1.6%
Central Bedfordshire 19.0% Blackburn with Darwen -1.6%
Greenwich 18.8% Tamworth -1.5%
Source: ONS principle population projections, SMF analysis
19SOCIAL MARKET FOUNDATION
CHAPTER 2: HOW CAN 4IR HELP?
The Fourth Industrial Revolution can address a number of the challenges outlined in the previous
chapter of the report – as we discuss here. From smart bins to pothole-detecting drones, new
technologies can help tackle some of the greatest challenges facing local communities across
the UK. Further, as we discuss, these technologies can help address some of the financial
constraints facing local government at present – offering potential efficiency gains and cost
savings.
Greener and cleaner streets –smart bins and street lighting
Tackling climate change, air and light pollution, and increasing the rates at which households
recycle waste, are likely to be key issues for local government in the future. The emergence of
new monitoring tools, robotics and automation all offer possibilities to address these challenging
issues. Below we discuss several examples of how 4IR can meet the environmental goals of local
government.
Environmental monitoring
Smart sensors are likely to be increasingly rolled out in local communities as a way of monitoring
the environment and intervening where appropriate. Connected sensors can be used to monitor
a wide range of environmental issues, including water quality, air quality, solid waste levels, noise
pollution, energy usage and light pollution. Critically, these issues can be monitored both
remotely and in real-time, allowing rapid responses where appropriate. Two examples of this are
the use of smart street lighting and smart bins – both of which are generating environmental and
financial benefits in the communities in which they are being rolled out.
Smart street lighting
Smart street lighting is currently being explored as a way of reducing light pollution, generating
financial savings and offering other benefits to local government. By being able to detect the
presence of people and vehicles nearby, smart street lighting can activate itself only when it is
needed – it can switch off or lighting levels can be dimmed accordingly when people or vehicles
are not present.
The experience of smart street lighting in Oslo shows that this technology can pay for itself over
a relatively short space of time, through electricity savings. Norway’s capital saw smart street
lighting pay for itself in less than three years xi.
As well as reduced electricity costs, smart street lighting in Oslo delivered further financial
savings through its ability to share data more effectively with local government. Smart,
connected street lighting in Norway’s capital is able to transmit maintenance data, such as bulb
replacement information, to better enable city officials to provide systemwide maintenance and
servicing. Previously, city officials had to drive to the specific light location in order to see if a
light was on. This has vastly improved the maintenance capabilities of the city because it learns
about outages and burnouts much quicker, in real time. It has also led to a reduction in
maintenance costs, by enabling local government to focus maintenance efforts where they are
needed the most – for example in areas where several streetlights have stopped functioning.
20TECH IN THE TOWN
Oslo’s smart street lighting uses a dimming feature to save electricity by changing the lighting
levels depending on time of day and the amount of natural light. It can also increase or decrease
light levels in certain areas based on a particular need, such as responding to a road accident or
large-scale activity. The previous lighting system in Oslo operated on a purely on-or-off basis,
resulting in significant energy waste as lights were turned on at full power during dawn and dusk
periods, when lower levels of lighting were sufficient to meet the city’s safety and security needs.
Beyond being able to better control lighting and maintenance, smart, connected streetlights
could bring a range of other benefits to local communities. This includes:
• Increased revenue opportunities for local government with add-ons such as digital
signage/advertising and wi-fi hotspots xii.
• Providing analytics for other uses. Cameras, water sensors and sound detectors can
provide local authorities with additional information about the weather, traffic flows and
even crimes (such as fly-tipping) and parking violations.
• Environmental monitoring such as examining levels of air pollution.
• More timely and efficient gritting of roads, through the installation of cost-effective
temperature sensors onto streetlights. Such sensors have been developed by
meteorologists at the university of Birmingham and Amey plc, an Oxford-based
engineering consultancy. Each of the hand-sized sensors costs only around £200,
compared with the £10,000 or so needed to maintain a weather forecasting station like
those currently relied on by local authorities to help them make decisions on when and
where to grit. The sensors were successfully trialled in Birmingham, London and
elsewhere in the UK xiii.
In the UK, Glasgow City Council has also reported successful outcomes through the deployment
of smart street lighting, as described in the case study box below.
Case study: smart street lighting in Glasgow
In 2013, Glasgow City Council won a Future City Demonstrator competition run by the UK
government’s Technology Strategy Board. The city received £24m to showcase a number of
smart city projects that aimed to improve the local economy, increase quality of life and reduce
the impact on the environment. This included funding to support a smart street lighting trial.
The Intelligent Street Lighting Project demonstrated how the city can use smart streetlights to
improve lighting quality, reduce energy usage, improve public safety and make maintenance
more efficient.
The lights were initially deployed in three locations. One was Riverside Walkway, where a
dynamic lighting system was integrated with movement sensors that reacted to the presence of
citizens. Lights would be set to 20% brightness, but this increased to 100% when movement
was detected.
The trial of smart streetlighting was successful in demonstrating efficiency savings and other
benefits. Subsequently, Glasgow City Council progressed a project to retrofit approximately
3,500 columns across the city centre’s street lighting network with more efficient, controllable
LED lighting. The smart street lighting also helped form a wifi network across the city centrexiv.
21SOCIAL MARKET FOUNDATION
A recycling revolution
As we discussed in the previous chapter of the report, there are currently substantial variations
in recycling rates across the UK. Addressing this needs to form a key part of improving the
environment in the future.
Already, emerging evidence suggests that 4IR has the potential to revolutionise waste collection
in the UK through the use of smart, connected bins.
The use of bin-fill sensors can alert local authorities to when and where bins need to be emptied,
helping to save time and money spent collecting waste. Indeed, evidence suggests the
efficiency savings are potentially enormous. Rugby Borough Council, for example, replaced 56
traditional bins, each of which had traditionally received between two and three collections per
day, with 23 “BigBelly” stations fitted with bin-fill sensors. In only 12 months it reduced manual
waste collections from 51,100 per year to just 1,509 per year – a saving of 49,591 collectionsxv.
Figure 7: A “BigBelly” smart bin
Going forward, the use of internet-connected bin-fill sensors in household bins could generate
savings for local government through reduced collections, as well as providing new financial
incentives for homes to recycle more. For example, rather than funding household waste
collection through Council Tax, bin-fill sensors could help pave the way for households paying
on a per-collection basis. Households would be incentivised to produce less waste and
recycle/reuse more frequently. Having said that, while such a charging model could bring
environmental and efficiency benefits, public opposition could be sizeable. Even without new
charging regimes or internet connectivity, concern has been expressed in recent years about the
use of “spying” microchips in some local authority bins for the purpose of data collection xvi.
Furthermore, savings might not be achievable in all instances. Economies of scale mean that,
particularly in urban areas, it might make more sense to retain the current system of collecting
bins regularly on a house-by-house basis. Savings might be more obvious in more rural areas,
where distances between houses are greater.
22TECH IN THE TOWN
Finally, the smart bins of the future are set to be increasingly able to sort waste as well as detect
when bins are full – driving up recycling rates significantly. A bin, designed by start-up company
Bin.E, recognizes different type of waste via a system positioned inside the bin which uses
sensors, image recognition and artificial intelligence. Once waste is placed inside, the camera
and sensors identify its type and place it in one of the smaller bins. Then it compresses the waste
so it occupies less space xvii.
Goodbye to gridlock – the impact of 4IR on cars and roads
Transport – both private and public – is set to transform over the coming decades. The rise of
electric, autonomous vehicles provides opportunities to both reduce air pollution and
congestion. Further, autonomous vehicles, “smart cities” and data analytics can improve
experiences on public transport – encouraging more individuals to leave their cars at home.
Encouraging greener, more efficient use of cars
4IR will change the way individuals travel to and from where they live, with the rise of car clubs,
telematics and autonomous vehicles.
The car industry is already evolving from one providing goods (vehicles) to households to one
providing services. Car-sharing services such as Zipcar have enabled people living in urban
areas to minimise the costs associated with car usage – hiring a car when they need to use one,
rather than owning a car that is rarely used. Zipcar recently announced that more than 250,000
UK residents have now signed up to use its service, with one third of members having joined
since January 2018 xviii.
Uber has dramatically changed the taxi landscape, bringing in a new era of convenience for
individuals who can now summon a taxi using their smartphone.
Further change is set to come in over the coming years as 4IR gains momentum, with the rise of
autonomous and electric vehicles. The UK Government has announced plans to ban sales of new
diesel and petrol vehicles by 2040 xix and there have been calls for this to be brought forward to
an earlier datexx. A shift towards electric vehicles will help tackle the challenge of air pollution
described in the previous chapter. In London, for example, road transport currently accounts for
about half of all nitrous oxide and particulate matter emissions xxi.
Autonomous vehicles could significantly increase the efficiency with which cars are used. At
present, individual cars spend the overwhelming majority of their time idle – research by the RAC
Foundation found that the average car is parked at home for 80% of the time, parked elsewhere
for 16% for the time and only on the move for 4% of the timexxii. We could imagine, instead, a
world with fleets of autonomous vehicles which can be hired using a mobile phone app. Once an
individual has been dropped off, the autonomous vehicle would then proceed to pick up its next
passenger – a “driverless Uber” service. This approach to motoring could cut congestion by
reducing the number of cars on the road. A fleet of driverless taxis could be nearly constantly in
use (at least during the day), taking individuals to and from destinations and spending relatively
little time parked. Reduced levels of on-street parking could also contribute to reduced
congestion and improved traffic flows in some areas.
23SOCIAL MARKET FOUNDATION
New charging models for roads
As we discussed in our report on 4IR in the home, one implication of a shift towards electric
vehicles is that the government is set to lose a substantial pool of tax revenues currently
associated with car usage. At present fuel duty revenues account for about 4% of all government
current tax receipts. As petrol and diesel vehicles are phased out, this source of revenue is set
to disappear – highlighting the need for new forms of tax revenue from motorists.
One option is for the government to increase vehicle excise duty (“road tax”), including for
electric vehicles, to ensure a continued flow of revenues from motorists. But this would be a
highly inefficient way of raising revenue. Critically, as vehicle excise duty does not vary according
to how much an individual uses the road network, both heavy and light users of the roads would
face equal levels of taxation.
A new system of road pricing seems, from an economic perspective, by far the best long-term
form of motoring taxation. Under road pricing, an individual pays a fee to use a stretch of road –
potentially a per-mile charge. The level of road pricing would vary depending on the time of day
and the location. City and town centres may face higher road prices, for example, to reflect higher
levels of demand to use roads in these areas. Similarly, road pricing would be higher in the “rush
hour” to reflect greater levels of demand.
As well as making up for tax revenues lost from the elimination of road fuel duty, road pricing
could decrease congestion on local road networks. By varying road prices according to the time
of day, individuals would be encouraged to (if they can) use the road network when prices are
cheapest and roads are less congested. This should in turn lead to a greater spread of traffic
throughout the day, reducing the bunching of traffic around rush hours. The London Congestion
Charge demonstrates the reductions in congestion that can be achieved through even a
relatively basic form of road pricing; the number of private cars entering Central London’s
congestion charging zone has fallen by about two fifths since 2002 xxiii (the Congestion Charge
was introduced in 2003).
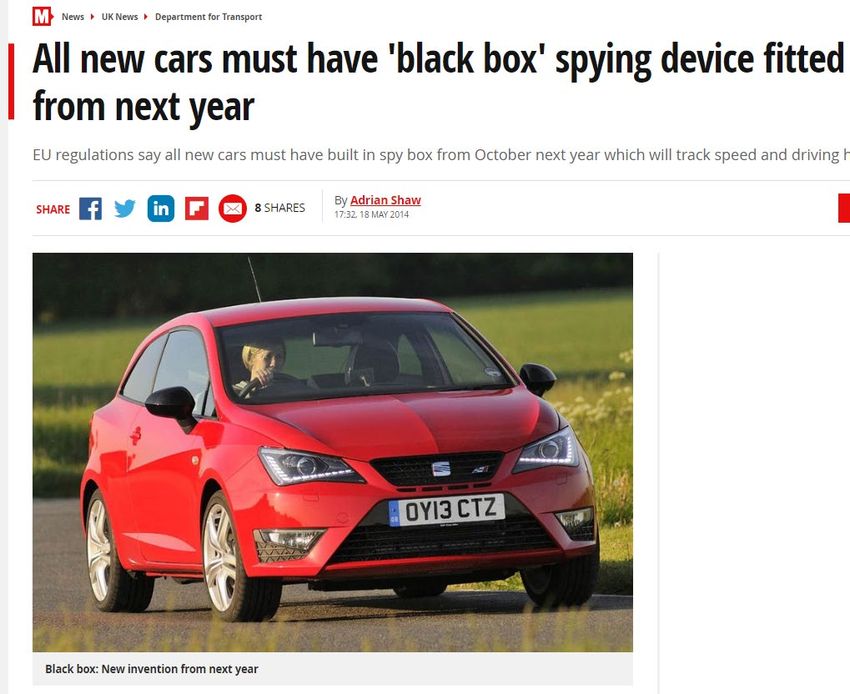
The long term need for a sophisticated road pricing system across the UK is likely to increase the
extent to which vehicles are connected – for example, vehicles may need to be fitted with “black
box” telematics devices which report on the road prices prevalent in a particular area, so
motorists can make informed decisions about where to drive. Such devices, which would be
receiving dynamic pricing data on the road network, could provide guidance for motorists on
routes they can take to reduce road charges.
As we discussed in our report on the benefits of 4IR for households xxiv, telematics also offers the
potential for cheaper vehicle insurance for motorists that drive in a safe manner, by collecting
accurate information on driving patterns. In Italy, legislation was introduced in 2012 making it
compulsory for telematics boxes to be fitted in all new cars, as a response to the rising number
of fraudulent whiplash claims in the country which was leading to higher insurance costs.
Further, in Italy, provision of telematics insurance is required by law to be cheaper than non-
telematics insurance xxv, to encourage uptake.
24TECH IN THE TOWN
Finding a parking space - at a fair price
In addition to dynamic road pricing, there is scope for local government to phase in increasingly
smart forms of car parking charges, as well as technologies which make it easier for motorists to
find vacant parking spaces in urban areas. The political challenges around road pricing – which
we discuss in the next chapter of this report – mean that “smart parking” might be more viable
than smart road pricing – at least in the short-term.
As mentioned in the previous chapter of the report, current car parking charges are often
inefficient – leaving car parks either under or overutilized depending on the time of day. By
monitoring levels of occupancy (and thus demand), “smart car parks” could vary parking charges
accordingly to encourage a more even distribution of usage throughout the day.
By collecting data on occupancy, smart car parks, in conjunction with connected automobiles,
can help ensure that motorists are guided towards car parks where spaces are available – helping
to reduce congestion in urban areas causes by motorists searching in vain for parking spaces. In
Barcelona, space-vacancy sensors in multistorey car parks have been a big success, helping
drivers find spaces and increasing the city’s parking revenues xxvi.
In the future, the concept of smart car parks in towns and cities could go a step further –
allowing individuals to increasingly reserve a space online (for example using their
smartphone). At present, parking reservation facilities are very limited across the UK.
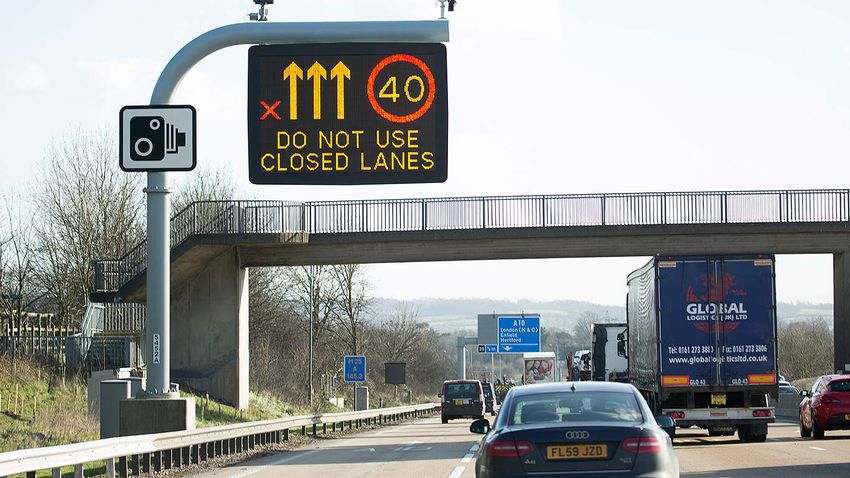
Smart signage
Increasingly, we are likely to see digital, smart signage on the road network, which utilises data
on traffic flows, road incidents, weather and other factors to divert traffic and change speed
limits. This can help reduce congestion and increase safety on the road network.
Already, smart motorways are being rolled out in the UK, and there is scope for similar smart
signage to become an increasing feature of our urban areas.
Figure 8: Smart motorway signage
25SOCIAL MARKET FOUNDATION
Improving road quality
As well as reducing congestion on the roads, there is scope for 4IR to improve the physical quality
of the road network – with new tools for detecting and fixing the potholes which blight so much
of the road network.
One way of dealing with potholes might be through the use of drones. Academics at the
University of Leeds have developed a drone which not only spots cracks and potholes in roads,
but is also able to address these. The drone has a built-in 3D printer which is able to spray asphalt
into cracks and potholes. Leeds City Council is working closely with the university, looking to
pioneer the use of drones in a concept described as “self-repairing cities” xxvii.
Figure 9: Road-repairing drone developed by academics at the University of Leeds
Other technologies are also being explored as a means of identifying potholes and other road
defects – including using data gathered from devices fitted to cars and other vehicles (known as
“car as a sensor”). The latest Ford Focus has optional pothole-detecting technology that can
smooth out a car’s ride over broken roads xxviii. It uses 12 high-resolution sensors that can “see”
potholes before the car drives over them. Once a pothole is identified, dampers are automatically
adjusted to their hardest setting, so the wheels that run over the hole do not fall so deep into it
– improving the ride and reducing the chances of damage.
Going forward, we expect such technologies to not only be utilised to improve ride quality and
reduce damage to cars, but to share data on potholes and other road maintenance issues with
government. This will facilitate much more rapid detection and repair of potholes than is feasible
at present. It will also facilitate earlier detection of road defects, when repair costs are likely to
be lower and involve less disruption to traffic flow.
A new software system developed by researchers at the University of Waterloo in Canada
automatically analyses photographs taken by vehicle-mounted cameras to flag potholes, cracks
and defects. The intention of the software is to ensure that governments have the information
that they need to better plan when to repair a particular road and to do it at a lower cost xxix (for
example by addressing faults early, when repair costs are lower). In addition to refining their road
assessment technology, the researchers are exploring the use of the AI software on images
26You can also read