The future of non-metropolitan England - Moving the conversation on - DEVOLUTION - Local Government ...
←
→
Page content transcription
If your browser does not render page correctly, please read the page content below
DEVOLUTION

The future of
non-metropolitan England
Moving the conversation on

Interim report of the Post-Brexit England Commission
This paper is the very start of our campaign
                ahead of the Spending Review.
                We have published a series of papers, commissioned by LGA boards,
                which start the new thinking around building the case for long term,
                sustained investment in local government as well as laying out the
                positive outcomes this would deliver for the country:
                • local government funding
                • housing, planning and homelessness
                • improving schools
                • Brexit
                • the future of non-metropolitan England
                • a sustainable adult social care and support system for the long term.
                Over the coming months, we will be seeking your thoughts and evidence
                to further strengthen the rallying call to Government.
                Find out more at www.local.gov.uk/moving-the-conversation-on

       "Pass down the baton of power
       to councils and reconnect
       communities to the decisions
       and services that most affect
       their lives."

2 | The future of non-metropolitan England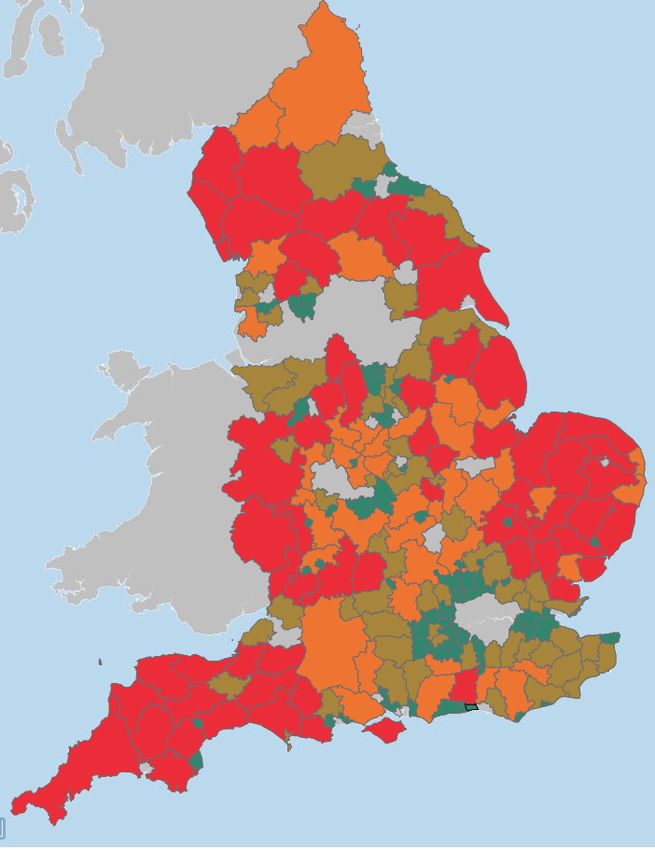
Contents

Foreword........................................................................................................................................................................4

Introduction .................................................................................................................................................................5

The Commission’s work to date............................................................................................................................6

The demographic drivers..........................................................................................................................................7

Framing the challenge...............................................................................................................................................9

An affordable and suitable place to live for all...............................................................................................10

Skills and support to secure a good quality job near to home.................................................................14

Access to a fast and reliable digital connection...........................................................................................19

Support services to help maintain health and wellbeing...........................................................................25

High quality transport provision and infrastructure....................................................................................28

Support for businesses to export and attract foreign direct investment...........................................31

Increasing non-metropolitan productivity and securing inclusive growth...........................................33

Conclusion.................................................................................................................................................................37

The Commission’s South West roadshow......................................................................................................38

The Commission’s East Midlands roadshow..................................................................................................39

                                                                                                                                           The future of non-metropolitan England | 3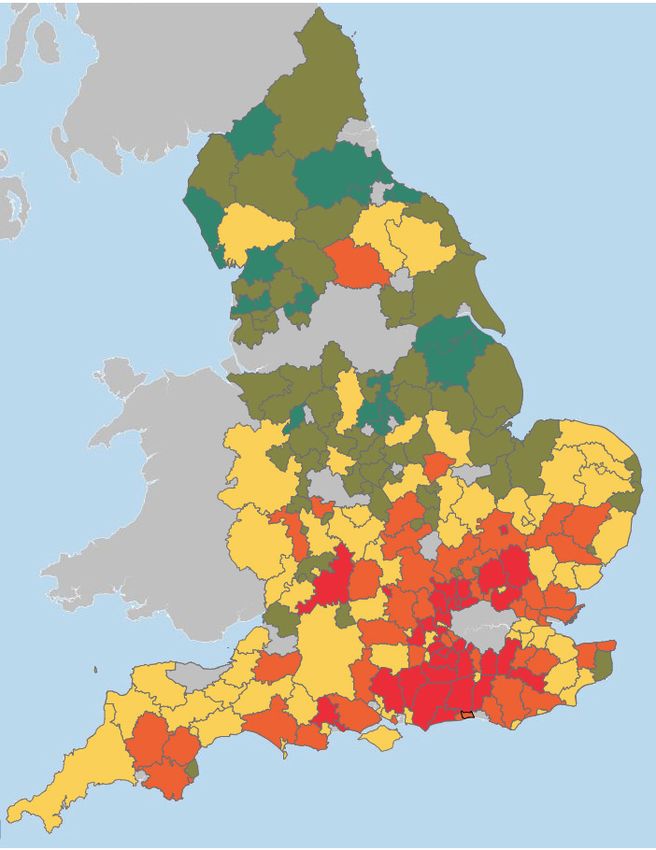
Foreword

If Britain is to make the most of a successful        This report represents not only the views of
future outside the European Union (EU) it will        local government but draws on evidence from
need to ensure communities across England             a wide range of stakeholders. The Commission
have the powers and resources to take control of      has engaged with business associations,
the opportunities, the offers and the challenges      health organisations, housing and public sector
that can only be addressed at the local level.        stakeholders, recognising that while councils
                                                      have a unique role as civic leaders they do
Over the coming years, it is clear that Brexit,       so by building strong and diverse partnerships
possibly the greatest public policy challenge for     with local institutions.
a generation, will continue to fully occupy the
attention and resources of national government.       This report is a milestone, not the final
This will leave it with little scope to tackle the    destination. The Commission will continue to
major barriers to success and prosperity facing       run a series of roadshows across the country,
non-metropolitan England, such as residents           gathering evidence and ideas in support of a
of all ages struggling to stay in their local         final report to be published early next year.
community due to a lack of suitable homes at
a price they can afford; businesses with patchy       Between now and then we want to hear from
mobile and broadband connectivity that cuts off       councils, public sector agencies, businesses,
their access to new markets; and a top-down           the voluntary sector and perhaps most crucially
employment and skills system that is failing to       from residents in non-metropolitan England on
equip people with the skills they need to get a       what they see as the long-standing challenges
good quality job and progress towards more            their local areas face and how councils and
rewarding employment.                                 local partners can help build a thriving and
                                                      prosperous country.
In the face of this perfect storm and at a time
of historic change for the country, this report       While the scale of this task is significant, the
outlines a firm offer from local government – give    message to Government is simple – pass down
local leaders the powers and funding to deliver       the baton of power to councils, get on with
for their communities and we will significantly       delivering a successful Brexit and let us seize
improve the viability, productivity and opportunity   this once in a lifetime opportunity to reconnect
of non-metropolitan England.                          communities to the decisions and services
                                                      that most affect their lives. In doing so, we will
                                                      strengthen the country for the future ahead.

                                                      Councillor Mark Hawthorne MBE
                                                      Chairman of the LGA People and Places Board

4 | The future of non-metropolitan England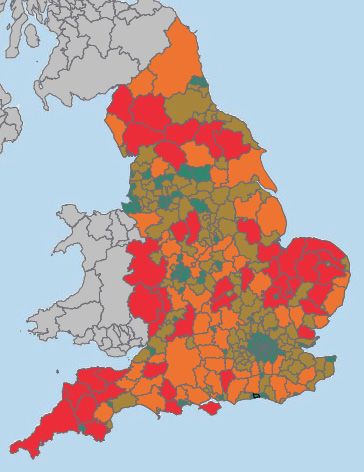
Introduction

‘Non metropolitan England’ is an expression that      In this interim report, we outline seven key
captures the large and small towns, the villages      challenges which local government can address
and hamlets, the coastal communities and the          in order to support the future success of the
rural and the deeply rural areas in which 62          towns, villages, rural, deeply rural and coastal
per cent of the English population live.1 It refers   communities of non-metropolitan England:
to a diverse range of places with significant
differences in their demographic make-up,             • distortions in local housing markets that are
geography and economy, populated by people              making it impossible for many residents to buy
who want to live fulfilled and successful lives and     a suitable home at an affordable price in their
build businesses that prosper and grow.                 local community
                                                      • an overcentralised skills system which is
The Post-Brexit England Commission has                  struggling to train and upskill residents,
been established by the Local Government                especially in more rural settings, and failing to
Association’s (LGA) People and Places Board             meet the needs of businesses
to consider in detail the challenges and
                                                      • a lack of mobile and broadband connectivity
opportunities faced by non-metropolitan England
                                                        which is excluding residents and businesses
and to outline to Government local government's
                                                        from the opportunities of growth
offer to help build thriving, connected and
healthy communities.                                  • public services which are finding it harder to
                                                        support residents to maintain their health and
The terms of Britain’s departure and indeed             wellbeing across dispersed populations
its future relationship with the EU still require     • a significant decline in bus transport
detailed negotiations. It is also clear that            provision and inadequate national funding of
preparations for Brexit and its implications            local road and rail infrastructure
are likely to dominate the legislative and
                                                      • a sub-national trade and investment policy
political agenda for much of the next decade.
                                                        framework that could do much more to help
While Government’s capacity and focus will
                                                        local businesses to export and attract foreign
be directed towards negotiating Britain’s
                                                        direct investment
successful withdrawal, establishing new trade
deals and developing new relationships with           • an approach to local growth that risks
the international community, local government           fragmentation and fails to harness
is making a firm offer: give us the powers and          opportunities for increased local productivity.
resources and we will tackle the issues that our      Over the next few months the Commission will
residents and businesses face and ensure their        continue to explore these challenges, evidence
health, happiness and prosperity.                     in more detail the cost of failing to address
                                                      them and highlight the opportunity for national
                                                      government to take up local leaders on their
                                                      offer to develop solutions that work for non-
                                                      metropolitan communities.

1   Population and migration, ONS, LGA Analysis

                                                                    The future of non-metropolitan England | 5
The Commission’s work to date
The Commission launched in February 2018 and issued a call for evidence to
inform the findings of this interim report. Since then it has engaged a broad
coalition of stakeholders with an interest in the future of non-metropolitan
England.
These include representatives from the District Building to a final report next year, in which
Councils' Network, the County Councils Network, the Commission will present its more detailed
the Federation of Small Businesses, the Institute findings and recommendations, we invite
of Directors, the Home Builders Federation, responses from businesses, the voluntary and
members of the House of Lords, NHS England, community sector, public sector organisations
the National Housing Federation, Public Health and residents who live in non-metropolitan
England (PHE), the Social Mobility Commission, England to the questions raised in this
SOLACE, the Tourism Alliance and a range of interim report.
councils from across the country.
If you are interested in attending one of the
The Commission has begun a series of Commission’s future roadshows, or wish to
roadshows hearing from local communities on share your views and comments, please email
the opportunities and challenges they face, PBECommission@local.gov.uk
and the policy levers they need to seize to
tackle them. Many of the views it has heard, on
local skills deficits, poor connectivity, and the
challenges of an ageing population, have been
outlined in this report. Detailed write ups of the
roadshows held so far are available at the end of
this document.
6 | The future of non-metropolitan EnglandThe demographic drivers
In the coming years, the population will become
older, with the most pronounced effects of this
shift expected to be felt in non-metropolitan
England. National population projections show
that by 2039: While the working population is set to
increase in urban areas, outside cities we
+65 years expect to see a lack of growth or even a
decline in the working aged population.
For every 100 working-age (16-64) This demographic change will have major
residents in non-metropolitan England, implications for areas across non-metropolitan
there will be 53 people aged 65 or older. England with many facing a deficit of people of
working age and a surplus of local job vacancies.
83%
There will also be an inevitable increase in
pressure on adult social care services.
More people will be living in cities, with
urban areas absorbing 83 per cent of total
population growth, with the remaining 17
per cent expected to occur in rural areas.2
2 Demographic change and housing wealth, National Housing Federation, 2018
The future of non-metropolitan England | 72024
reas
2025
2026
2027
2028
0.00
0.50
1.00
1.50
2.00
2.50
3.00
2029
0
10
20
30
40
50
60
aged 0
2030
aged 2 2014
aged 4 2031
aged 6 2015 2032
Mean for non-metropolitan areas
aged 8 2033
2016
aged 10
England
2034
aged 12
2017
2035
aged 14
aged 16 2018 2036
aged 18 2037
aged 20
2019
2038
aged 22
2020 2039
aged 24
aged 26 2021
aged 28
8 | The future of non-metropolitan England
aged 30 2022
aged 32
2023
aged 34
aged 36 2024
Mean for metropolitan areas
aged 38
aged 40 2025
2014
aged 42
aged 44
2026
aged 46
2027
aged 48
aged 50 2028
(NUMBER OF RESIDENTS OLDER THAN 64 PER 100 PEOPLE)
aged 52
0.50
1.00
1.50
2.00
2.50
3.00
2039
aged 54 2029
aged 56
2030
aged 58
aged 60 2031
aged 62
aged 64 2032
Mean for non-metropolitan areas
aged 66
2033
aged 68
aged 70
2034
aged 72
aged 74 2035
aged 76
aged 78
2036
OLD AGE DEPENDENCY RATIOS FOR METROPOLITAN AND NON-METROPOLITAN ENGLAND
aged 80
2037
aged 82
aged 84 2038
aged 86
aged 88 2039
aged 90 and over
THE PERCENTAGE OF THE POPULATION BY AGE BAND IN NON-METROPOLITAN AREAS – 2014 VS 2039
0
20
40
60
80
100
120
140
160
180
200
2006/07
2007/08
2008/09
2009/10
English metropolitan arFraming the challenge
Drawing on the experience of councils and In each case we have sought to show the
the evidence of stakeholders from across the negative impact on residents, damage to the
business, academic and public sectors, the economy and missed opportunities that are
following sections detail the challenges facing arising from the current national approach to
non-metropolitan England in seven key areas: non-metropolitan England.
• availability of an affordable and suitable We believe this is a unique opportunity to pass
place to live power to local leaders to secure better outcomes
• skills and support to secure a good quality for communities and businesses. Moreover, we
job near to home have the backing of residents with 71 per cent
trusting local government most to make the
• access to a fast and reliable digital
decisions that affect their local area.3
connection
• support to maintain health and wellbeing While we have a clear understanding of the
• high quality transport provision and challenges, local leaders also recognise the
infrastructure necessity of partnership and the value of
contributions from those with an interest in non-
• support for businesses to export and attract
metropolitan England. Over the coming months
foreign direct investment
the Commission will work towards developing
• increasing productivity and securing detailed solutions in each of these areas,
inclusive growth. building on the key questions set out in this report.
We believe this is a unique
opportunity to pass power to local
leaders to secure better outcomes
for communities and businesses
3 Polling on resident satisfaction with councils, LGA, May 2018
The future of non-metropolitan England | 9An affordable and suitable
place to live for all
Non-metropolitan England is in the midst of a housing crisis. From young
families and lower income workers unable to get on the property ladder,
to older people who want to downsize but can’t find the specialist housing
they need, to those in substandard accommodation or struggling with
homelessness, people are being affected up and down the country. In coastal
areas and large towns, villages and the deeply rural parts of non-metropolitan
England, the shortage of housing is having significant knock-on effects for
communities, local economies and the provision of public services.
The LGA’s Housing Commission highlighted the In the coming decades, across the country the
broad agreement between councils, developers, biggest population increase will be of those of
charities and health organisations on both the pensionable age. This will be felt most profoundly
urgent need for more homes of all tenures, in non-metropolitan areas; between 2014 and
and the wider benefits of proper investment 2039, 86 per cent of projected household growth
in housing. Building the right homes in the will be made up of households with someone
right places plays an essential role in wider aged 65 or older.4 As a result, the homes we
place-based strategies that boost employment, build will need to be at the heart of areas’
improve health outcomes and support an ageing integrated health and care strategies, responsive
population. But questions remain as to whether to the needs and aspirations of an ageing
national policy will adequately empower areas population, able to help them stay supported
outside cities to tackle the distortions within their in their homes for longer and remain integrated
local housing markets and support thriving and within their local communities.
sustainable communities, post-Brexit.
Investment in affordable homes will also be
"Buckinghamshire, alongside other crucial to ensure the sustainability of local
rural areas in the South East, has communities. Across non-metropolitan England,
the average house price in 2016 was £233,006
particularly high house prices and
compared with £142,577 in metropolitan areas
high affordability ratios … which outside London.5 In predominantly rural areas,
makes it harder to attract the skilled where the average workplace based earnings
workers needed for growth sectors, are lowest in the country, residents face house
such as construction and high tech. prices 8.7 times higher than their income.6
Buckinghamshire County Council,
Buckinghamshire Thames Valley Local
Enterprise Partnership (LEP) and
Buckinghamshire Business First
4 Household projections, MHCLG, LGA analysis
5 Housing, ONS, LGA analysis
6 Statistical Digest of Rural England, Defra, February 2018
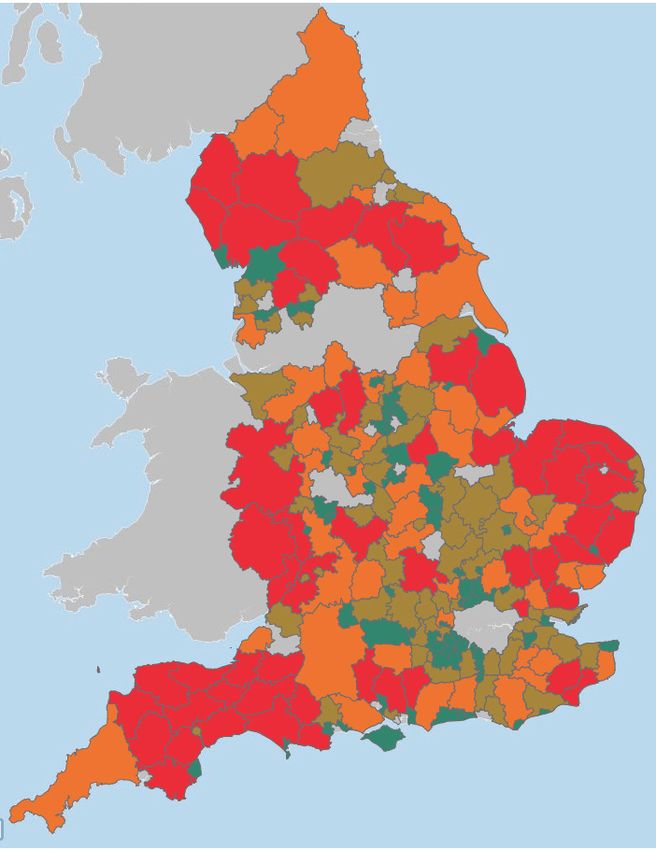
10 | The future of non-metropolitan EnglandIn coastal areas with high levels of tourism, the RATIO OF HOUSE PRICE TO WORKPLACE-BASED
market can be further distorted by second home EARNINGS IN NON-METROPOLITAN ENGLAND
ownership, where in some places, up to 15 per (2016)
cent of housing stock is owned by someone who 2.71 ≤ 6.00 6.00 ≤ 8.00 8.00 ≤ 10.00 10.00 ≤ 12.00 12.00 ≤ 18.04
lives elsewhere.7
Comparing median house prices to median
workplace-based earnings in local areas
highlights that the housing crisis is most severe
in the southern parts of non-metropolitan
England. However, house prices are still
greater than incomes in areas with some
of the cheapest housing in the country,
such as Durham or West Lindsey. Furthermore,
there still remain complexities within local
housing markets, hidden by this type
of analysis, which create issues with
affordability across the whole country.
"We are an area of high housing
demand across all tenures but
we have significant issues with
developer viability and high
affordability ratios. Getting our
housing balance right is key to
our future success.
The current housing delivery
models are not fit for purpose and
create unintended consequences
by trying to shoehorn national
solutions in a local context.
Heart of the South West Joint
Committee, Brexit Resilience and
Opportunities Group
7 Home Truths, National Housing Federation, 2017
The future of non-metropolitan England | 11By 2039, 86 per cent of projected household growth in
non-metropolitan England will be made up of households
with someone aged 65 or older
Higher house prices make it extremely difficult To tackle the housing crisis, councils share
for people to get on the housing ladder, leaving the collective national ambition to increase the
them with no choice but to rent. On average, housing supply of all tenures. Latest house
renters will pass on a third of their income to building figures are encouraging with 215,000
a landlord.8 For some households, this means new homes being built last year, 65 per cent of
having to move out of the local area in which which were built in non-metropolitan areas.15
they have built lives for themselves and their But the Government has set a target to build
families. For the communities that remain, the 300,000 a year.
long-term sustainability of local amenities and
businesses becomes increasingly at risk if the The last time the country built more than 250,000
individuals and families that would use and work homes, councils were building 40 per cent
in them have had to move away.9 of them.16 This has led to other organisations
joining the LGA in calling for the Government to
Non-metropolitan England has also seen a trigger a renaissance in council house-building,
rise in homelessness. Traditionally seen as a by lifting the housing borrowing cap for all local
challenge faced by our large town and cities, government and removing Housing Revenue
this is a misconception masking a hidden Account (HRA) borrowing from contributing
rural population who are encountering severe to public debt.17 The LGA has also called for
housing challenges.10 At the end of last year, councils to be able to keep 100 per cent of their
48 per cent of cases of homelessness were Right to Buy receipts to help homes being sold
in non-metropolitan England, a rise of 15 per under the scheme.18
cent over the last five years.11 In our deeply rural
communities 50 per cent more people went Councils are working hard with communities to
into temporary accommodation over the same approve 9 in 10 planning applications and last
period.12 It is an issue further compounded year worked with developers to grant permission
by inadequate national data which lacks the to over 350,000 homes, an 11 year high.19 In fact
granularity to identify pockets of deprivation housebuilders currently have 423,000 homes
that exist amidst rural affluence13 and does not across the country with permission that they are
record the number of affordable homes built in still to build.20
communities of less than 3,000.14
8 The LGA Housing Commission final report, LGA, 2016
9 Affordable housing saving rural services: Rural life monitor, The National Housing Federation, 2017
10 Right To Home? Rethinking homelessness in rural communities, IPPR, 2017
11 Homelessness statistics, MHCLG, LGA analysis
12 ibid
13 Health and wellbeing in rural areas, LGA and PHE, 2017
14 Final Report, The Select Committee on the Natural Environment and Rural Communities Act 2006. 2018
15 House building: new build dwelling statistics, MHCLG, LGA analysis
16 'LGA responds to latest Government house-building figures', LGA, 2017
17 'Abolish borrowing cap so local authorities can increase housing supply', Treasury Select Committee, 2018
18 'LGA responds to latest Government Right to Buy sales stats', LGA, 2017
19 'Record planning permissions show house builders’ investment continuing to rise', Home Builders Federation, 2018
20 'More than 423,000 homes with planning permission waiting to be built', LGA, 2018
12 | The future of non-metropolitan EnglandThis is a positive base reflecting improving To ensure suitable,
economic conditions following the recession.
However, national housing policy can still do
affordable housing for all
more to empower councils in their role as Government must:
planning authorities, and ensure that local
• Give councils sufficient powers and resources
communities' trust in the planning system is
to drive non-metropolitan housing growth and
rewarded with homes that are good quality,
ensure house builders deliver homes that
affordable and suit their needs.
meet the full range of local needs, that are
Analysis by Shelter and the Campaign to Protect affordable, and that are supported by services
Rural England has found that non-metropolitan and infrastructure that communities expect.
councils’ efforts to encourage developers
• Bring about a renaissance in house building
to build more affordable housing are being
by councils, including supporting development
undermined by the use of viability assessments.
of housing companies and joint ventures and
These give builders the right to cut their agreed
through Housing Revenue Accounts by lifting
affordable homes quota if they conclude it would
the borrowing cap and reforming Right to Buy.
reduce their profits to below 20 per cent and
allows them to utilise their own frameworks for
judging what might be unviable.21 Our offer
In some rural areas this has led to half the • Councils will work positively with house
affordable homes that councils had required builders to drive non-metropolitan housing
developers to build being lost.22 The LGA growth in ways that are supported by
has long raised concerns about the use of communities, that contribute to local economic
the viability process and has called for the growth and public services, and that are good
Government to establish a clear, robust and quality and affordable.
transparent procedure. While the revised
National Planning Policy Framework includes • Councils will step up to deliver additional
some welcome and well-intentioned steps it must supply, plugging gaps left in local markets
go much further in empowering councils and for affordable homes, key worker homes, and
communities to shape this kind of development homes supporting positive ageing across non-
locally. metropolitan England.
Looking to the future
• How can we adapt national housing delivery
models to meet the expected changes in rural
demography and economic geography?
• How can we reform housing viability
assessments to ensure more affordable homes
are built in non-metropolitan England?
21 Slipping through the loophole, Shelter, 2017
22 'Rural communities denied affordable housing as developers exploit loophole', Shelter, 2018
The future of non-metropolitan England | 13Skills and support to secure a
good quality job near to home
Ensuring that local residents in non-metropolitan areas have access to
education and training that provides them with the skills to get a good
quality job is key to building strong and resilient local economies where
everyone can contribute to and benefit from growth.
It is essential we ensure the right balance Forecasts produced for the LGA by the Learning
between local labour market skill sets and and Work Institute predict that by 2024, we will
business demand. However, the current jobs have too many intermediate and low-skilled
and skills system is failing to have an impact workers and not enough high-skilled workers
on the varying social and economic challenges to fill the jobs that the national economy will
faced by local areas or help change residents' generate. The growing skills gap is stark. By
prospects for the better. This has had a profound 2024, there will be a shortage of 4.2 million
effect on non-metropolitan England’s diverse skilled people in the UK to meet the demand for
residents, businesses and economies where high skilled jobs and a surplus of more than 6
challenges are compounded by barriers million people with low skills. Failure to address
associated with dispersed communities and this challenge puts at risk up to 4 per cent of
declining transport provision. future economic growth – a loss of £90 billion
economic output, with the average worker £1,176
Research for the LGA found that the national a year worse off.24
system comprises 20 employment and skills
funding streams managed by eight departments Crucially, local government is not alone in
or agencies, totalling more than £10 billion a recognising the limitations of the current national
year (2016/2017)23 with no duty to discuss with system, with business leaders from across
councils how provision will be delivered locally. the country highlighting skills reform as a key
This results in a confusing picture for residents, opportunity to boost productivity and improve
with fragmented and often competing provision competiveness.25
on the ground. In non-metropolitan areas, where
training providers already face challenges
associated with a lack of economies of scale,
this affects the ability of providers to serve
residents in more isolated communities.
23 Work Local - Our vision for Employment and Skills, LGA, 2017
24 ibid
25 In Perfect Harmony, CBI, 2018
14 | The future of non-metropolitan EnglandAdding weight to these calls is intelligence Many local authorities have also highlighted
from the business community that highlights possible shortages of workers in particular
the significant variation in skills gaps across sectors post-Brexit, subject to the terms of the
non-metropolitan England, with the Greater UK’s departure from the EU. The most commonly
Lincolnshire LEP experiencing vacancy rates of cited industries at risk are agriculture, food
64 per cent for skilled trades roles, compared manufacturing and tourism with a number of
with 34 per cent in the Worcestershire LEP.26 reports,27 including the LGA’s submission28 to the
Across the South East LEP, qualification levels Migration Advisory Committee on EEA nationals
are failing to keep up with the national average in the UK labour market, underlining the potential
and are well below those of neighbouring and implications for non-metropolitan areas.
similar LEPs such as Hertfordshire, Coast to
Capital and London. Growth forecasts for Lincolnshire, for example,
predict that between 2014 and 2024 there will
"…one third of vacancies [within the be vacancies for a total of 207,000 local jobs in
Heart of the South West LEP area sectors such as wholesale and retail, health and
social care, construction, hospitality and food
in 2015] were hard-to-fill due to
manufacturing to be filled. This will largely be
skills shortages. as a result of retirements but also some natural
…The labour market impact on growth within sectors. Based on population
many of our dominant sectors such projections, it is estimated that only 111,000
as health, agriculture, hospitality, people will enter the labour market across the
tourism and construction as a result same period, leaving a significant gap in the
workforce. Where this gap might have previously
of Brexit is particularly stark.
been filled by the migration of non-UK born and
Heart of the South West Joint Committee, European Nationals, a change in migration policy
Brexit Resilience and Opportunities could have a significant impact at a local level.
Group
"(In) Cornwall and the Isles of Scilly…
employers are struggling to recruit
people with the right skills and/or
qualifications, particularly in sectors
where there are higher skills needs.
Our agricultural, food processing and
hospitality sectors are particularly
…vulnerable to reductions in the
availability of ‘low’ skilled EU labour.
Cornwall Council
26 The Data Deficit, The Centre for Progressive Policy, 2018
27 In place of work, Localis, 2017
28 LGA submission to Migration Advisary Committee inquiry, 2017
The future of non-metropolitan England | 15Ensuring effective and locally relevant employment
support is available for the unemployed in
non-metropolitan areas is crucial
The future automation of manual jobs also This is a missed opportunity to help reintegrate
presents a major change for non-metropolitan people into the labour market. While it is too early
areas.29 Analysis by CCN shows that county to understand the impact of the WHP, we know
councils and county unitary authorities face job that its predecessor Work Programme struggled to
losses of 144,000 in the manufacturing sector help people with weaker labour market prospects.
between 2017 and 2027, owing to the industry’s After two years on the scheme, 70 per cent of all
particular susceptibility to automation.30 However, jobseekers and 87 per cent of all employment
across local areas, automation and its effects and support allowance (ESA) claimants returned
will be highly variable, with areas such as County to the job centre looking for work.33
Durham, where more than one in ten local
jobs are in manufacturing, more likely to face As well as being able to respond to the variations
unemployment as a consequence compared in local need, the delivery of education and
with Surrey, with less than half this number.31 training in non-metropolitan England will also
need to overcome the barrier of provision
Ensuring effective and locally relevant within more sparsely populated areas. In its
employment support is available for the State of the Nation report, The Social Mobility
unemployed in non-metropolitan areas is Commission highlighted many isolated rural and
crucial. Yet the current support available is coastal towns across England as ‘social mobility
primarily nationally designed, commissioned coldspots’ where young people increasingly
and controlled. Without devolution, councils face a lack of access to further education and
have very limited or no ability to influence employment opportunities.34
provision. Mainstream support for job seekers
comes via Jobcentre Plus (JCP), while targeted The limited availability of public transport in
support is available through the Work and Health these areas, as well as the difficulty providers
Programme (WHP), a relatively new initiative can face in achieving the economies of scale to
based on the predecessor Work Programme. meaningfully engage isolated areas35, presents
a strong case for a rethink in how we deliver
The LGA believes that JCP is not doing enough skills provision and employment support in our
to identify and attract the unemployed with their more rural communities.
support offer. Analysis by the Learning and Work
Institute reveals that in October 2016, half of
all unemployed people received no benefits or
government support through JCP.32
29 In place of work, Localis, 2017
30 Understanding County Economies,Oxford Economics and County Councils’ Network, 2017
31 Localis - In place of work
32 Work Local - Our vision for employment and skills, 2017
33 Improving Lives - The Work, Health and Disability Green Paper, LGA submission, 2017
34 State of the Nation, The Social Mobility Commission, 2017
35 Barriers to education, employment and training for young people in rural areas, Commission for Rural Communities, 2012
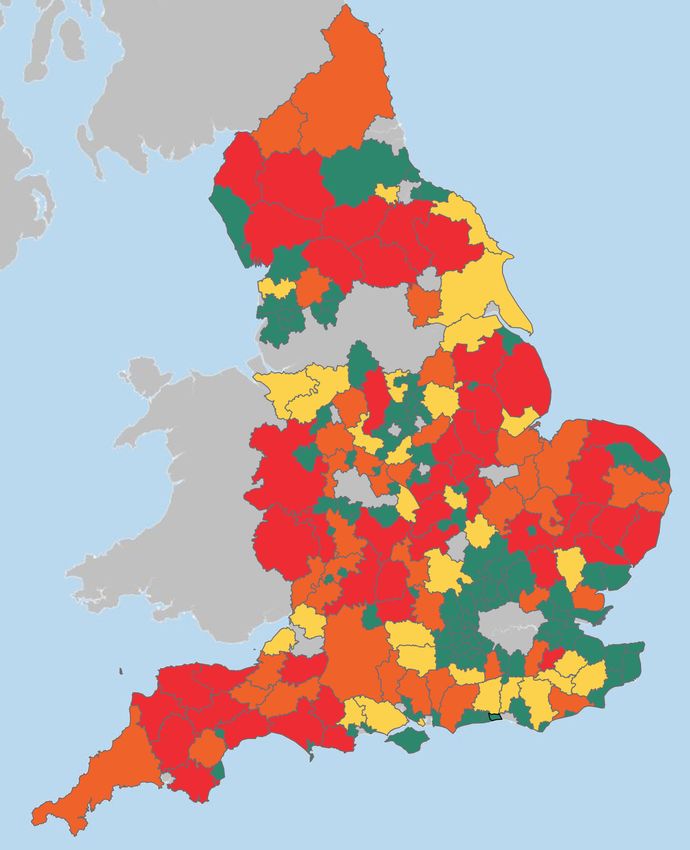
16 | The future of non-metropolitan EnglandPERCENTAGE OF RESIDENTS WITHIN 45 "Hampshire Jobcentre Plus offices
MINUTES OF EMPLOYMENT CENTRES BY PUBLIC are located in predominantly urban
TRANSPORT OR WALKING IN NON-METROPOLITAN
ENGLAND (2016)
centres with the exception of a
couple located in market towns.
0.00 ≤ 85.00 85.00 ≤ 92.00 92.00 ≤ 96.00 96.00 ≤ 100.00 100.00 ≤ 100.00 Benefits claimants living in rural
areas are more likely to depend on
public transport. This means their
issues are compounded by whether
or not there is suitable public
transport at the necessary times,
and the cost of travel.
Hampshire County Council
This is especially important as there is strong
evidence that work is good for health and
unemployment is bad for it. Ill health can also
affect people’s participation in the labour market,
with over 300,000 people annually falling out
of work and onto health-related welfare.36 This
has a huge cost to the individual, families,
communities, employers and public services.
Helping people with health issues to obtain or
retain work, and be happy and productive within
the workplace, is a crucial part of the economic
success and wellbeing of every community.
Evidence also shows that good quality work is
beneficial to an individual’s health and wellbeing
and protects against social exclusion through
the provision of income, social interaction,
identity and purpose. However, jobs need to be
sustainable and offer a minimum level of quality,
to include not only a decent living wage, but
also opportunities for in-work development, the
flexibility to enable people to balance work and
family life, and protection from adverse working
conditions that can damage health.37
36 Health, work and health related worklessness: A guide for local authorities, LGA, Public Health England, 2016
37 Health, work and worklessness, LGA, 2016
The future of non-metropolitan England | 17Taken together, the importance of rewarding To ensure everyone can find
employment and the limitations of the current
employment and skills system present a
a good job locally,
compelling case for radical reform. Government must:
The LGA vision for a new approach, Work Local, • Work with the LGA and our member authorities
outlines how, with the right mix of devolved to pilot our Work Local approach to deliver
powers and funding, groups of councils and a devolved and integrated skills and
combined authorities can work together with employment system that is more coherent
their local partners to provide a ‘one stop’ for local people and more effective for local
service solution. businesses.
In place of a top-down approach, Work Local
would use local opportunities and needs to Our offer
provide a better targeted and more integrated
• Councils in non-metropolitan England will
skills and employment offer for both individuals
work collaboratively to bring together local
and employers.
partners and national agencies, and ensure
This would enable areas to plan, commission there is a shared vision for the local area. This
and have oversight of joined-up information, coordinated and locally tailored approach will
advice and guidance alongside the delivery more effectively identify and target the unique
of employment, skills, apprenticeships and skills and jobs challenges in rural and deeply
wider support for individuals and employers. rural areas, be more responsive to the needs
of employers, better target retraining and
The Work Local approach has the potential to upskilling support for the current workforce
make significant savings. Across a medium and ensure young people are trained
sized combined authority, it is estimated that for current and future jobs.
an additional 8,500 people will be taken off
out of work benefits and 6,000 people will
attain better skills, creating additional fiscal Looking to the future
benefits of £280 million and a benefit to the
economy of £420 million.38 • How could we use a devolved approach to
employment and skills to practically meet the
needs of rural communities and businesses?
38 Work Local - Our vision for Employment and Skills, LGA, 2017
18 | The future of non-metropolitan EnglandAccess to a fast and reliable
digital connection
To prosper in the digital age, residents and businesses need access to fast
and reliable digital connectivity at home, at work and while on the move.
Digital connectedness is now part of the fabric of our modern society. It is
the fourth utility – an essential way of keeping in touch with friends and
family, a pillar of the local economy, a key driver of growth, a creator of jobs
and an enabler of public sector transformation.
Broadband connectivity "[One local business] that signed
up to the [council-led] superfast
While the commercial broadband market
broadband rollout in Lincolnshire
has provided urban consumers with an ever
increasing range of products and speeds, it attributes £1 million of its additional
has failed to expand provision to many of its turnover to its ability to access the
rural customers without the support of significant web, new markets, the cloud and
public subsidy. The last five years have seen accounting tools.
the Superfast Broadband Programme step in to Lincolnshire County Council
successfully extend superfast connectivity to
95 per cent of premises across the country, with The standard of digital connectivity provided
public bodies and smaller alternative network to rural new build homes is also below
providers partnering to provide solutions to the par, and doesn’t reflect the Government’s
hardest to reach areas. However, despite this national ambition to roll out world-class digital
progress, there is still an unmistakable digital infrastructure across the country. At present, one
divide in the country between urban and non- in five rural homes built in the last three years
metropolitan areas not captured by national is still not connected to superfast broadband.
aggregate figures. Moreover, one in 10 is unable to achieve the
USO minimum speeds.40 In the absence of
Premises in non-metropolitan England account
planning authority powers to obligate developers
for the vast majority of the ‘final five per cent’
to connect properties to future-proofed
unable to receive superfast broadband speeds.39
digital connectivity, the LGA has called for the
Whilst the Government’s proposed solution of a
introduction of a new Fibre to the Premises
broadband universal service obligation (USO)
Kitemark to make it clear to the public whether
presents an opportunity to further leverage
or not their new home will have a fully future-
public subsidy, demand aggregation and the
proofed internet connection.41
increasing capacity of the industry to roll out
faster speeds, its minimum download speed of
10mbps and upload speed of 1mbps will only
serve as a basic safety net at best.
39 Connected Nations Report, Ofcom, 2017
40 LGA commissioned research from Thinkbroadband.com, 2018
41 'Housing developers must adopt a ‘fibre to the premises’ kitemark for new builds', LGA, 2018
The future of non-metropolitan England | 19Mobile connectivity To encourage mobile network operators to extend
their coverage, the Government set a series of
With website traffic from mobile devices having obligations which they had to meet in exchange
overtaken desktops in 2017, and mobile data for legislative and planning reform to make the roll
consumption in the UK forecast to increase out of mobile infrastructure simpler. The LGA is
sevenfold by 2021, good mobile coverage is concerned by the recent disclosure that, owing to
necessity of modern day life.42 For many it is the low performance thresholds set in the original
replacing the need for fixed line telephone and agreement, the resulting coverage will not be
broadband services. of sufficient strength or capacity to support the
needs of modern day smartphone users.44
However, while non-metropolitan residents will
have seen significant advances in the power of With the Government having pledged to extend
their smartphone devices, they have not seen an mobile coverage to 95 per cent geographic
equivalent increase in the strength, speed and coverage of the UK by 2022, the failure of these
capacity of their mobile network. obligations to secure a modern standard of
coverage highlights the need for Ofcom to have
"Broadband and mobile connectivity the right measurement mechanisms to hold
are critical to the ability of tourism mobile operators to account on the quality and
providers to be operationally strength of the coverage they provide. This will
effective and meet the demands of be especially important when the regulator sets
consumers who are increasingly its conditions on mobile operators’ coverage in
looking to book and interact online. rural areas as part of its auction of the spectrum
formerly used for digital terrestrial television, later
The Tourism Management Institute
this year.
Ofcom reports that national mobile connectivity
is improving, but country-wide coverage figures
have a tendency to mask the deep disparity
Premises in non-metropolitan
between coverage in urban and rural areas.
When disaggregated, Ofcom’s latest figures
England account for the vast
reveal only 60 per cent of rural premises can
majority of the ‘final five per
receive an outdoor 4G signal from all operators, cent’ unable to receive superfast
falling to 19 per cent for indoor coverage.43 broadband speeds
42 StatsCounter - Mobile and tablet internet usage exceeds desktop for first time worldwide
and CCS Insight: UK mobile data usage will grow sevenfold by 2021
43 Connected Nations Report, Ofcom, 2017
44 ibid
20 | The future of non-metropolitan EnglandPERCENTAGE OF HOMES IN NON-METROPOLITAN PERCENTAGE OF HOMES IN NON-METROPOLITAN
ENGLAND UNABLE TO ACHIEVE 10MBPS ENGLAND WITH AN OUTDOOR 4G SIGNAL FROM
DOWNLOAD SPEED BY LOCAL AUTHORITY ALL OPERATORS
0.00 ≤ 1.00 1.00 ≤ 3.00 3.00 ≤ 5.00 5.00 ≤ 17.00 0.00 ≤ 75.00 75.00 ≤ 85.00 85.00 ≤ 95.00 95.00 ≤ 100.00
The future of non-metropolitan England | 21Businesses’ access to and
adoption of faster digital
connectivity
The economy continues to undergo a digital
revolution catalysed by the increasing
processing power of computer hardware and
faster connectivity. However, in non-metropolitan
areas many rural businesses are still deeply
In a recent survey conducted by dissatisfied with the broadband services
Amazon, almost 40 per cent rated available to them. In a recent survey conducted
their internet connection speed as by Amazon, almost 40 per cent rated their
poor, and a quarter were dissatisfied internet connection speed as poor, and a
with the reliability of their connection quarter were dissatisfied with the reliability
of their connection.45 Ofcom analysis has also
found that a third of rural firms believe poor
connectivity is hampering their growth.46
This is not just a concern for our economy of
today, but for the growth potential of the high-
value industries that will come to supplant the
key sectors, such as manufacturing, that are
predicted to decrease in non-metropolitan
England in the coming years. There is already
evidence showing that non-metropolitan
economies are lagging behind the rest of
England in ‘high productivity’ sectors reliant on
digital infrastructure as well as fast and reliable
digital connectivity, such as information and
communications, finance and insurance.47
To build a prosperous economy, non-metropolitan
England will require digital infrastructure capable
of supplying upload and download speeds not
just to meet the present demand, but which
will be capable of meeting the needs of the
industries of the future.
It will also be essential that businesses are
provided with support to take up faster services
when they become available.
45 Unlocking the digital potential of rural, Rural England, 2018
46 The SME experience of communications services: research report, Ofcom, 2016
47 County Councils Network Submission
22 | The future of non-metropolitan EnglandAt present the take up of superfast services where Many of these services can already be
they have been rolled out in non-metropolitan areas supported by 4G coverage, but
lies between 40 to 60 per cent.48 This shows there only where it is available and of consistent
is more work to be done to encourage residents reliability. This places non-metropolitan areas
and businesses to utilise the speeds they have at a considerable disadvantage considering
available. Tackling constraints to digital adoption the poor rates of both outdoor and indoor
for rural businesses, especially small and micro coverage they receive from mobile providers.
businesses, can also offer substantial increases
in productivity, with current barriers to take-up
4G
thought to be costing the economy up to £26 billion
in lost Gross Value Added (GVA).49
Enabling Digital by Default only 60 per cent of rural premises can
public services receive an outdoor 4G signal from all
The digitisation of public services offers an operators, falling to 19 per cent for
important opportunity to support sustainable indoor coverage
local services in more remote settings and
overcome the barriers of isolation in non-
metropolitan areas. And there is a clear
willingness from the public to use more services
online; a recent survey has shown that 89 per
cent of residents are ready and willing to use
additional digital services when they become
available.50 However, the full transition to Digital
by Default will be premature if not all residents
have adequate connectivity.
For healthcare, connectivity presents an
opportunity to reduce the demand on services,
such as hospital admissions, by providing
support to enable assisted living or helping
residents better manage longer term conditions
like Type 2 diabetes through remote healthcare
devices. The Government has recognised the
potential of digital health and will invest £4.2
billion over the next five years in areas such as
apps, wearable devices, telehealth and assistive
technologies.
48 ISP Review - take-up Progress of the BDUK Superfast Broadband Rollout
49 Unlocking the digital potential of rural, 2018
50 The Citizen View of Government Digital Transformation, Rural England, Ipsos Mori and Sopra Seria, 2017
The future of non-metropolitan England | 23To ensure universal access Looking to the future to fast, reliable digital • How can we better evidence the importance connectivity of ubiquitous high-speed digital coverage, Government must: particularly in more rural areas? • Give councils the statutory backing to ensure all new build homes are connected to future- proofed digital infrastructure. • Work with Ofcom to ensure mobile coverage data is accurate, up-to-date and reflects consumer experience in non-metropolitan areas. Our offer • Councils in non-metropolitan England will engage with developers through the planning system to ensure that digital connectivity is a key consideration in planning applications so residents can be assured their new homes will have future-proofed digital connectivity. • Councils will work constructively with mobile network operators to understand the role local policy and public sector infrastructure can play in helping expand mobile connectivity across rural and deeply rural areas. 24 | The future of non-metropolitan England
Support services to help
maintain health and wellbeing
It is sometimes assumed that residents in non-metropolitan
areas are the healthiest in the country. On the face of it, the evidence base
would appear to support this assertion; statistics show that in rural areas
self-reported wellbeing is higher49, life expectancy is longer50, and the infant
mortality rate is lower51 than in other areas. However, these broad-brush
indicators can mask pockets of significant deprivation and poor health
outcomes for residents within rural and deeply rural communities.52

This raises key questions for public service                           Delivering health and social care
providers on how best to identify areas of
isolated deprivation, ill health and the factors
                                                                       services to non-metropolitan
impacting them, and how health and social care                         areas
provision can be better designed to tackle them.
                                                                       Rural populations typically consist of larger
This gap in the evidence base is by no means                           proportions of older people and smaller
the only challenge inhibiting the effective                            proportions of younger adults. In rural areas,
delivery of health and social care. In non-                            an average of 23.5 per cent of the population
metropolitan areas these services also face                            is over 65, compared with 16.3 per cent in
challenges responding to rising demand and                             urban areas.55 Given that national population
reducing resources, challenges in recruitment                          projections anticipate the percentage of people
and retention, and barriers preventing rural                           aged over 85 will double over the next twenty
populations from accessing services.                                   years, it is likely that these rural demographic
                                                                       dynamics will accelerate further, placing
                                                                       increasing pressure on health and social
                                                                       care services as a result.56
      Non-metropolitan areas face
      increasing difficulties delivering
      health and social care services
      with decreasing resources over
      wide and sparsely populated areas.

51   Statistical Digest of Rural Areas, Defra, January 2018
52   Public Health England, life expectancy statistics: www.phoutcomes.info
53   Child mortality in England and Wales, ONS, LGA analysis
54   Health and wellbeing in rural areas, LGA, Public Health England , 2017
55   The State of Rural Services 2016, Rural England, 2017
56   The coming crisis: access to health services in our towns,The Centre for Towns, 2018

                                                                                        The future of non-metropolitan England | 25
At present, councils across the country are TIME TRAVEL IN MINUTES TO EIGHT KEY SERVICES also facing the increasing costs of providing BY PUBLIC TRANSPORT OR WALKING ACROSS ALL social care for those aged between 18 to 64 COUNCILS years old. A survey of local authorities found that working-age adult social care expenditure almost 8.8 ≤ 15.0 15.0 ≤ 20.0 20.0 ≤ 25.0 25.0 ≤ 81.2 matched that of adults aged 65 or older, and accounts for a rising proportion of the pressure on local authority adult social care budgets.57 Furthermore, national analysis conducted by the LGA shows that as of March 2018, there will be a gap for adult social care funding at a local level of £2.2 billion by 2020. In non-metropolitan areas, these challenges are exacerbated by the difficulty of delivering health and social care services to wide and sparsely populated areas with decreasing resources. It is often older people, and disabled and vulnerable adults, that are disproportionately more likely to experience transport isolation.58 Indeed, Age UK found that cuts to bus services had made it more difficult for older people in particular to get to their local doctor’s surgery and hospital59, an issue compounded by the fact that residents in rural areas are already less likely to live in close proximity to health settings, and more likely to experience ‘distance decay’ where service use decreases with increasing distance.60 For services delivered within the home, such as social care, the sparsely populated geography of more rural areas can also result in higher service delivery costs and shorter care visits because of longer journey times between appointments. 57 Adass Budget Survey 2017 58 Buses in Crisis, Campaign for Better Transport, 2017 59 Missed opportunities, the impact on older people of cuts to rural bus services, Age UK, 2015 60 Health and wellbeing in rural areas, LGA, Public Health England, 2017 26 | The future of non-metropolitan England
This is before one considers any post-Brexit                    To help maintain residents'
changes to migration which might affect the
7 per cent of care workers or the 16 per cent
                                                                health and wellbeing,
of registered nurses working in care that are                   Government must:
originally from the EU.61
                                                                • Urgently address the projected funding gap
The Commission has also received evidence                         facing adult social care and support by 2020.
from areas that some of the most significant
savings within healthcare costs lie in the
development of technologies that will allow
                                                                Our offer
rural communities to be looked after with smart                 • Councils will have the right resources to
devices, negating some of the need for outreach                   continue to tackle some of the unique non-
services. However, as detailed previously, issues                 metropolitan challenges to health provision,
with digital connectivity in non-metropolitan                     such as population sparsity, to better support
areas remain a barrier to their implementation on                 vulnerable and ageing populations to stay
a wider scale.62                                                  healthy and live within their own communities;
                                                                  mitigate high demand for NHS services;
Addressing the wider social and economic
                                                                  alleviate the pressure on the provider
factors is of critical importance in improving
                                                                  market; decrease strain on informal carers
health and wellbeing in rural areas. A good
                                                                  and alleviate the pressure on an already
job, a warm and secure home, a social network,
                                                                  overstretched care workforce.
clean air, a reliable internet connection and
access to transport links are all vital in
maximising the health and independence of                       Looking to the future
residents, yet access to these components is by
no means guaranteed to all in non-metropolitan                  • How can we develop an integrated approach
England. Councils are also clear that the long                    to social and physical infrastructure that
term solution for the financial and demographic                   directly contributes to improving the health
challenges facing local government and the                        and wellbeing of residents?
NHS is to invest in prevention and address
the wider determinants of physical and
mental health, with councils and health
and wellbeing boards as the vehicles
for driving this action forward.

61 The state of the adult social care sector and workforce in England, Skills for Care , 2017
62 Submission to Commission from Buckinghamshire County Council, Buckinghamshire Thames Valley LEP and Buckinghamshire
   Business First Response

                                                                               The future of non-metropolitan England | 27
High quality transport
provision and infrastructure
Communities rely on high quality transport provision and infrastructure
to get on in life. In non-metropolitan England, transport is key to helping
maintain access to vital amenities and services, but local policy makers face
a significant challenge of working within increasingly limited budgets to
ensure our transport systems serve those in the most remote areas.
Buses in rural areas In non-metropolitan areas, passenger bus
journeys have fallen almost 6 per cent in the last
Of the total public transport trips taken in non- 10 years with the distance travelled on council
metropolitan areas last year, seven out of 10 supported buses having decreased by over 50
were made on a bus, making them the most per cent over the same period.66
significant part of public transport provision
outside major cities.63 From services that weave MILES TRAVELLED ON COUNCIL-SUPPORTED
through networks of smaller towns, to the longer- BUS ROUTES IN THE LAST 10 YEARS.
distance routes set up to serve isolated villages,
buses connect communities and residents to 200
friends and family, public services, training
180
courses, employment opportunities and much
more. Across the country, they support the wider 160
functioning of the economy, taking 40 per cent 140
of shoppers to the high street compared with 30
per cent who choose to travel by car.64 They are 120
a lifeline for the vulnerable, a route to opportunity 100
for the young, and an essential service for those
80
who do not own a car.
60
Councils play a vital role in maintaining and
improving bus transport for the communities 40
and local economies they serve. However, in
20
the face of cuts to government funding, over
2,000 bus services have had to be reduced, 0
altered or withdrawn across the country since
2006/07
2007/08
2008/09
2009/10
2010/11
2011/12
2012/13
2013/14
2014/15
2015/16
2016/17
2010.65
English metropolitan areas English non-metropolitan areas
63 National Travel Survey, LGA analysis, 2016
64 Making the connections, Urban Transport Group, 2014
65 Buses in crisis, Campaign for Better Transport, 2017
66 Transport statistics, ONS, LGA analysis
28 | The future of non-metropolitan EnglandYou can also read