Technical Advisory Group - Policy modelling update 11 January 2022 - GOV.WALES
←
→
Page content transcription
If your browser does not render page correctly, please read the page content below
Technical Advisory Group

       Policy modelling update
       11 January 2022

© Crown copyright 2021
TAG ADVICE ONLY NOT WELSH GOVERNMENT POLICY
Policy modelling update 11 January 2022
Welsh Government COVID-19 TAG Policy Modelling Subgroup
This is the latest in a series of papers on modelling the pandemic in Wales.
This paper includes scenarios from Swansea University that were produced on
22 December 2021, and further scenarios that were produced on 5 January
2022.
The 22 December 2021 scenarios took into account accelerated booster rollout
that was not in the 17 December 2021 scenarios – assuming 45,000 booster
doses per day. The 17 December 2021 scenarios also featured high and low
severity assumptions where high severity had a case hospitalisation ratio of
2.5%, low severity had 1%.
The 22 December 2021 and 5 January 2022 scenarios were focused around
the ‘low’ severity assumption as more evidence had emerged of decreased
intrinsic average severity being observed for Omicron compared with Delta,
making the ‘high’ scenarios less likely. The basic reproduction number (R0) for
the 22 December 2021 and 5 January 2022 scenarios was increased from 5.1
to 6.5 to reflect the rapid growth that had been observed. The low severity
assumption was also updated to include a higher proportion of asymptomatic
cases.
Omicron became the dominant variant (accounting for more than 50% of cases)
in Wales by the end of December with rising numbers of cases of Omicron in
Wales throughout December 2021. This led to debate on whether measures
needed to be taken to bring the spread of COVID-19 under control. At this point
there was a lot of uncertainty about the level of pressure that could be seen in
the NHS from an Omicron wave, as well as pressure from a lot of the
population being infected at the same time.
The decision to move to Alert level 2 in Wales was made prior to the production
of the scenarios included in this paper. This paper looks at modelling scenarios
based on different sets of population protections being applied for set periods of
time. In particular, the scenarios consider a move on 26 December 2021 to
Alert Level 2 for two or four weeks.1 In the event, Wales moved to introduce
Alert Level 2 – type restrictions on 26 December. An unmitigated scenario
where no population protections are introduced is also included. The models
assumed there was a reduction in the number of contacts on average in the
week before Christmas; however this may not be the case based on COMIX
data.
There is data emerging that suggests the intrinsic severity of Omicron is lower
than the previous dominant Delta variant, with Omicron 60-80% less likely to
1
Alert levels are set out in the coronavirus control plan for Wales.
Page 2 of 21
TAG ADVICE ONLY NOT WELSH GOVERNMENT POLICY
lead to hospitalisation and death. However, because there has been an
unprecedented number of COVID-19 cases with the Omicron variant, there is
still concern about pressure on the NHS, from community acquired cases, as
well as hospital-acquired cases, and patients incidentally testing positive on
admission.
There is also concern about the sustainability of health, social care, and other
essential public services with such high prevalence and rates of sickness
absence, as well as isolation for contacts of cases. Data on staff absence in
Wales has some limitations but so far, data up to 3 January 2022 suggest that
sickness absence and self-isolation in NHS staff has not yet been as high in the
Omicron wave as it has reached in the winter 2020/21 wave but has increased
at the end of December 2021.
The high prevalence has put pressure on the Test, Trace Protect (TTP) system
which means confirmed case data is potentially distorted where testing demand
has outstripped capacity, and the impact of TTP may be reduced when contact
tracing is not able to keep up with the volume of cases. Also the change to
asking people not to have a PCR test following a positive LFD test will affect
the COVID-19 case data.2
This paper assumes a 25% increase in asymptomatic infections compared with
Delta. The Delta variant in Wales had produced a case-hospitalisation ratio
(CHR) of around 2%3. Here, the ‘low severity’ scenarios have a CHR of 1%.
Hospital cases may be inflated due to people being admitted for other reasons
who test positive, or nosocomial infections.
Early studies from England4 and Scotland5 suggest a reduction in the chance of
needing hospital treatment for Omicron when compared to Delta cases. The
Imperial analysis looking at data from England found a reduction in the range
20-25% when using any attendance at hospital as the endpoint, and 40-45%
when using hospitalisation lasting 1 day or longer.
The analysis from Scotland6 also found a 50-80% reduction in the number of
hospitalisations with Omicron when compared with the expected rate for Delta.
A paper from South Africa7 found a reduction of around 80% in the risk of being
hospitalised for S gene target failure (a proxy for Omicron) compared with S
gene positive (likely to be mostly Delta).
All of these analyses are subject to some biases in terms of timings and being
able to accurately measure reinfections, and UK data is limited as the majority
2
COVID-19 case data in Wales reported here: Rapid COVID-19 virology - Public | Tableau Public
3
Technical Advisory Group: policy modelling update 30 November | GOV.WALES. See the Annex for a time series of the CHR
in Wales from early November to early December 2021.
4
https://www.imperial.ac.uk/mrc-global-infectious-disease-analysis/covid-19/report-50-severity-omicron/
5
https://www.research.ed.ac.uk/en/publications/severity-of-omicron-variant-of-concern-and-vaccine-effectiveness-
6
https://www.research.ed.ac.uk/en/publications/severity-of-omicron-variant-of-concern-and-vaccine-effectiveness-
7
Wolter et al. Early assessment of the clinical severity of the SARS-CoV-2 Omicron variant in South Africa link
Page 3 of 21
TAG ADVICE ONLY NOT WELSH GOVERNMENT POLICY
of cases have been in young people so far and there were small numbers of
hospitalisations included in the analysis.
These reductions in severity are positive news but must be balanced against
the much larger risk of infection with Omicron, due to the reduction in protection
provided by both vaccination (including boosters) and natural infection. Some of
the most pessimistic scenarios around Omicron can be ruled out but it could
still cause a significant wave of hospital admissions and other harms, and a lot
of people being absent due to sickness at the same time.
Each scenario was run for varying levels of vaccine effectiveness, from 60% to
80% vaccine effectiveness against infections – this was calibrated to the Delta
variant and updated with decreased effectiveness for Omicron.
In light of Omicron, the booster vaccination programme was ramped up in mid-
December. All eligible adults in Wales were offered and encouraged to receive
a booster vaccination by the end of the year.8 Booster vaccinations up to 8
December 2021 were included in the 22 December 2021 and the 5 January
2022 modelling9 with an assumption of 45,000 vaccines being administered per
day in Wales after this date.
Swansea University produced an additional low severity scenario on 5 January
2022, updated to fit the initial Omicron Rt rise more closely.
The scenarios suggest a peak of up to around 12,000 – 19,000 daily cases
between 1 December 2021 and 30 March 2022 depending on levels of
protective measures and how effective these restrictions are. However the peak
may be less sharp, and more drawn out, dependent on the mixing behaviour
over the Christmas period and the subsequent weeks. COMIX data suggests
slightly increased contacts in Wales up to the end of December, albeit with a lot
of uncertainty.10
Schools returning may be associated with increased mixing or adults returning
to the workplace so the data may change in the next week – there may be an
increase in transmission which would be observed in the ONS covid infection
survey and other metrics such as waste water.
There are some signs that some areas like London may have seen a peak of
cases in younger age groups, but cases are transitioning into older age groups
who may be at higher risk of severe outcomes.
With a large proportion of the population being infected, or reinfected, in the
Omicron wave, consideration of long covid and other sequelae of COVID-19 is
important because even if the risk is reduced, this may cause a significant
8
First Minister outlines ambitious aim to offer all eligible adults a booster appointment by end of year | GOV.WALES
9
Previous COVID-19 modelling (dated17 December 2021) assumed booster vaccinations were administered at a rate of
20,000 per day. The paper detailing this modelling is published here: Technical Advisory Group: policy modelling update 17
December 2021 | GOV.WALES
10
https://cmmid.github.io/topics/covid19/reports/comix/Comix%20Weekly%20Report%2092.pdf
Page 4 of 21
TAG ADVICE ONLY NOT WELSH GOVERNMENT POLICY
future burden of disease. Understanding how many Omicron cases still have
symptoms at four weeks may give an early indication of this burden.
Understanding more about the balance of economic and social harms as well
as direct COVID harms, and indirect health harms caused by COVID and by
staff being absent is important in providing context for these epidemiological
models and helping to fine-tune policies to balance these different harms.
Ideally we would have more models that include results for Wales as current
models produced for SPI-M-O are England only. This would enable us to
triangulate results from different models.
Modelling Scenarios
The following scenarios were produced to assist with planning. They are not
intended to predict what will happen but provide scenarios of what could
happen. They are intended to be short-term scenarios with the aim of updating
them regularly as the picture changes in light of new data, information,
assumptions or variants. These scenarios are still uncertain but we are
currently (6 January 2022) seeing a rapid increase in hospital admissions that
is following other parts of the UK. However a proportion of hospital cases are
nosocomial and some are likely to be incidental COVID-19 positives in
individuals admitted for other reasons.
Note that the model scenarios shown here are for Omicron wave only; the
cases start from zero and go back to around zero. In reality this is unlikely
and it is likely we will see some level of continued prevalence of COVID-
19 – either Omicron, Delta, or another variant.
All scenarios estimate that the peak number of COVID-19 cases will far exceed
previous peaks regardless of which, if any, population protections were
implemented in the 4 weeks following Christmas. There are a maximum 12,000
to 19,000 estimated daily symptomatic cases. This will continue to put pressure
on the system in terms of high prevalence and sickness absence.
However, the scenarios suggest how hospital admissions can be
controlled/reduced to an extent by bringing in coronavirus control plan
measures. The impact of the measures on admissions will also depend on the
case hospitalisation ratio (CHR).
With the low severity of Omicron, it may be possible to keep hospitalisations
and bed occupancy at lower or similar levels to previous peaks observed in
Wales. However, this may be counteracted by an increase in incidental cases
and nosocomial cases.
Model scenarios suggest that if alert level measures were applied for two
weeks only from 26 December 2021, there may be some benefit, but if
Page 5 of 21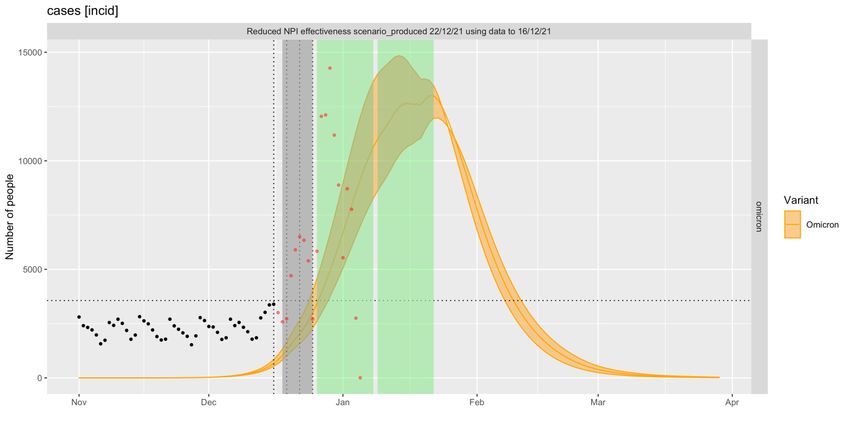
TAG ADVICE ONLY NOT WELSH GOVERNMENT POLICY
introducing the protections for four weeks, alert level 2 could have a significant
impact.
The following charts show the scenarios from 22 December 2021 models for
COVID-19 cases, hospital admissions, and hospital bed occupancy. Hospital
occupancy may be the most appropriate metric in terms of total pressure on the
NHS; this may vary if we see shorter length of stay with Omicron than with
other variants. The models include Omicron infections only, while the actuals
include all COVID-19 variants. Data is emerging which suggests Omicron is
less likely to lead to critical care demand and less likely to cause death than
Delta, with a potential similar reduction in severity as for hospital admissions.
So far, although there has been an increase in hospital cases in London, any
increase in critical care demand has been very modest.
Figure 1: Estimated daily COVID-19 cases in Wales due to the Omicron variant under
various coronavirus control plan measures – low severity
Sources: Swansea University modelling; PHW
L2_L0 means Alert Level 2 in wales for 2 weeks (from 26 December 2021) followed by Alert Level 0
for the subsequent 2 weeks. L2_L2 means Alert Level 2 in Wales for four weeks
Models only include Omicron cases, actuals are all COVID-19 cases.
Page 6 of 21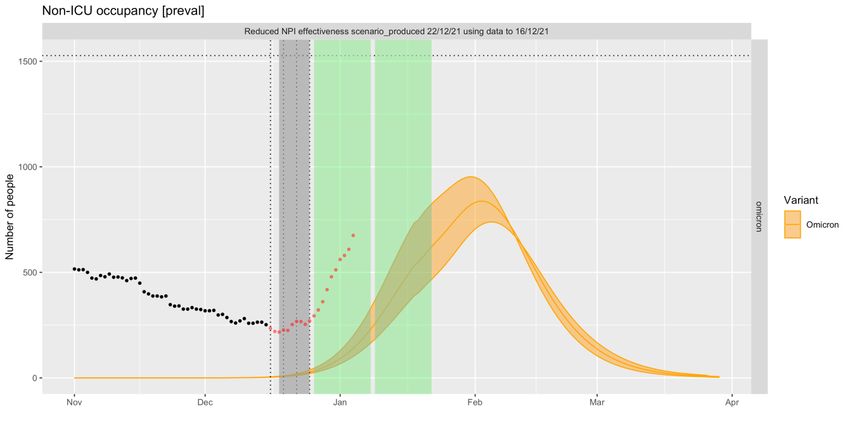
TAG ADVICE ONLY                                      NOT WELSH GOVERNMENT POLICY

Figure 2: Estimated daily confirmed COVID-19 admissions in Wales due to the Omicron
variant under various coronavirus control plan measures – low severity

                                                      Sources: Swansea University modelling; PHW
  L2_L0 means Alert Level 2 in wales for 2 weeks (from 26 December 2021) followed by Alert Level 0
                    for the subsequent 2 weeks. L2_L2 means Alert Level 2 in Wales for four weeks
                    Models only include Omicron admissions, actuals are all COVID-19 admissions.

Figure 3: Estimated daily total COVID-19 hospital bed occupancy in Wales due to the
Omicron variant under various coronavirus control plan measures – low severity

                                               Sources: Swansea University modelling; StatsWales

                                                                                      Page 7 of 21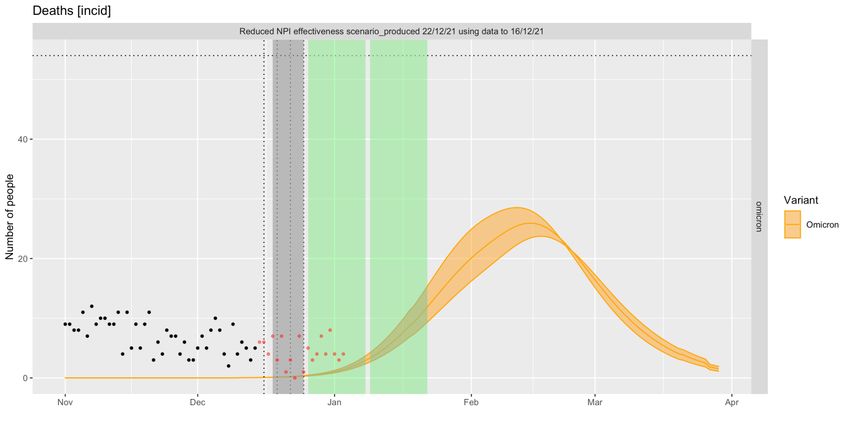
TAG ADVICE ONLY NOT WELSH GOVERNMENT POLICY
L2_L0 means Alert Level 2 in wales for 2 weeks (from 26 December 2021) followed by Alert Level 0
for the subsequent 2 weeks. L2_L2 means Alert Level 2 in Wales for four weeks
Models only includes hospital beds occupied by patients with the Omicron variant, actuals are all
hospital beds occupied by patients with any COVID-19 variant.
Figure 4b: Estimated daily total COVID-19 hospital bed occupancy in Wales due to the
Omicron variant under various coronavirus control plan measures – high severity
Sources: Swansea University modelling; StatsWales
L2_L0 means Alert Level 2 in wales for 2 weeks (from 26 December 2021) followed by Alert Level 0
for the subsequent 2 weeks. L2_L2 means Alert Level 2 in Wales for four weeks
Models only includes hospital beds occupied by patients with the Omicron variant, actuals are all
hospital beds occupied by patients with any COVID-19 variant.
An additional model scenario was provided on 5 January 2022, with the same
assumptions as the low_L2_L211 severity scenarios above, and fitted to the
initial rise in the Rt of Omicron.
Under this scenario, cases are closely tracking the 80% vaccine effectiveness
(VE) assumption (‘high vaccine effectiveness’), with current daily cases
estimated at just over 10,000 and a peak of around 12,000 in mid-January.
Daily admissions are estimated to peak between 120 and 180 in mid-January,
and start to decline sharply from early February. Under the mid and high
vaccine effectiveness assumptions, peak daily admissions stays below the
11
This refers to a scenario where Alert Level 2 is introduced for four weeks in Wales on 26 December 2021
before returning to Alert Level zero again.
Page 8 of 21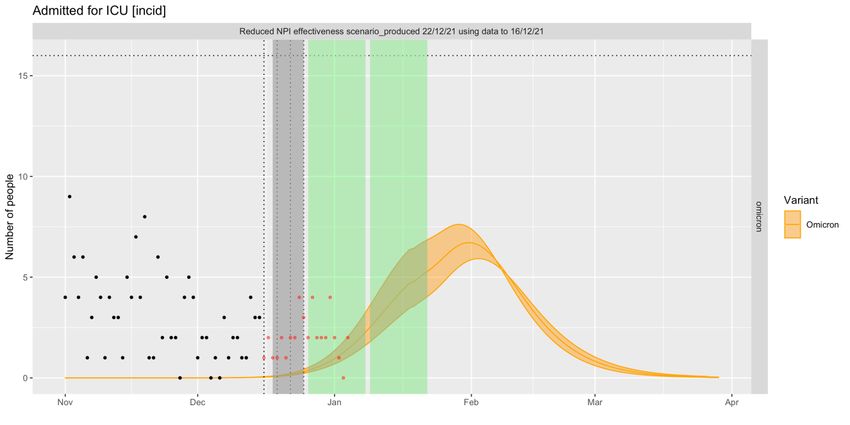
TAG ADVICE ONLY NOT WELSH GOVERNMENT POLICY
peak seen before Omicron, but is exceeded under the low vaccine
effectiveness assumption.
Actual occupancy data is currently approximately around a week ahead of this
scenario, but under all VE assumptions, the peak is estimated to remain
below what was seen previously.
The following charts show the updated 5 January 2022 scenario for COVID-
19 cases, hospital admissions, and hospital bed occupancy, at various
vaccine effectiveness estimates.
In reality, we may not see such a rapid increase and fall in cases if people
continue to change their behaviour and reduce their contacts; we may see a
longer tail of cases than these scenarios predict and we are likely to see a
longer period of continued COVID-19 cases, either Omicron or another
variant.
Figure 4: Estimated daily COVID-19 cases in Wales due to the Omicron variant under
Alert Level 2 – low severity
Sources: Swansea University modelling; PHW
Models only include Omicron cases, actuals are all COVID-19 cases.
Page 9 of 21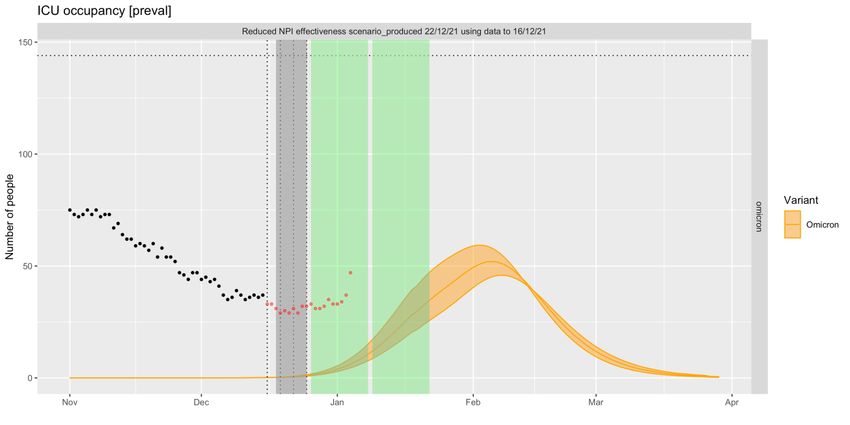
TAG ADVICE ONLY                                     NOT WELSH GOVERNMENT POLICY

Figure 5: Estimated daily COVID-19 admissions in Wales due to the Omicron variant
under Alert Level 2 – low severity.

Sources: Swansea University Modelling; PHW
Models only include Omicron admissions, actuals are all COVID-19 admissions.

Figure 6: Estimated daily total COVID-19 hospital bed occupancy in Wales due to the
Omicron variant under Alert Level 2 – low severity.

                                                                               Page 10 of 21
TAG ADVICE ONLY NOT WELSH GOVERNMENT POLICY
Sources: Swansea University modelling; StatsWales
Models only includes hospital beds occupied by patients with the Omicron variant, actuals are all
hospital beds occupied by patients with any COVID-19 variant.
Daily peaks (Between 1 December 2021 and 30 March 2022)
The number of COVID-19 hospital admissions estimated per day is a key
metric for planning to ensure the NHS in Wales can meet demand. In Wales, a
maximum of 187 confirmed COVID-19 patients were admitted in one day (on
29 December 2020).
There are significant differences in the maximum numbers of confirmed
COVID-19 admissions per day under the low and high disease severity
assumptions. Under the high severity assumption, the peaks all exceed 200
admissions per day. Under the low severity 22 December 2021 scenarios
included in this paper, all scenarios where a protection (Alert Level) is
introduced lead to peaks of below 200 in Wales (for lower vaccine efficacy
assumptions), or below 160 for mid vaccine efficacy assumptions (70% vaccine
efficacy assumptions).
The charts below all show the estimated peaks of each of the 22 December
scenarios with 70% vaccine effectiveness (mid VE) against infections. For
further charts and for the tables of (rounded) totals and peaks for all scenarios
at each vaccine effectiveness between 1 December 2021 and 30 March 2022,
see the Annex.
Figure 7: The estimated peak number of confirmed COVID-19 hospital admissions per day
between 1 December 2021 and 30 March 2022, Wales
Source: Swansea University modelling
Page 11 of 21TAG ADVICE ONLY NOT WELSH GOVERNMENT POLICY
Assuming a central vaccine effectiveness of 70%, there is an estimated range
of between 5,000 and 5,100 COVID-19 admissions, with a daily peak of
between 130 and 160 admissions, over the period between 1 December 2021
and 30 March 2022, depending on what protections are implemented.
In reality there may be more hospital cases than this because of nosocomial
(healthcare-acquired) cases as there has been a several fold increase in the
susceptible population with Omicron variant, and there may be more
incidental findings on admission. The peak occupancy depends on length of
stay which may be affected by patient flow through the hospital, which may be
delayed due to high levels of staff sickness absence.
These scenarios estimate that entering alert level 2 for two weeks or four
weeks will produce a similar total number of COVID-19 admissions between 1
December and 30 March 2022, and in addition is estimated to produce a
similar total number of COVID-19 admissions as remaining in alert level 0 (no
mitigations) over the same period. However, the model estimates that
introducing protections does help to reduce the daily peak number of hospital
admissions which would help to reduce pressure on the NHS.
Protective measures are most effective (in terms of reducing peak
hospitalisations per day) when implemented for a minimum of 4 weeks.
However, introducing protections for at least 2 weeks does have an impact on
reducing the daily peak number of hospital admissions, making the total
admissions more manageable.
In the scenario updated on 5 January 2022, with the low severity assumptions
fitted to the initial rise in the Omicron Rt, the estimated total number of
COVID-19 admissions over the same period ranges between 4,600 and
5,900. The daily peak ranges between 120 and 180, as detailed in the charts
below.
Figure 9: The estimated total and peak number of confirmed COVID-19 hospital admissions
per day between 1 December 2021 and 30 March 2022, 5 January 2022 scenarios, Wales
Source: Swansea University modelling.
Annex
Page 12 of 21TAG ADVICE ONLY NOT WELSH GOVERNMENT POLICY
Further model assumptions
To calibrate the Swansea University epidemiological models to the Omicron
variant, the following updates were made on 22 December 2021:
An R0 of 6.5 was assumed. This was based on the doubling time of three days
observed by mid-December. An additional seeding in late November was
added to generate the date where the majority of cases were Omicron.
To take account of the possibility of increased reinfection rates due to immune
evasion which may occur due to the Omicron variant, an immune evasion
parameter of 50% is set. This is accomplished by setting a starting condition
where 50% of those who have had previous exposure to COVID-19 and/or a
vaccination retain their immunity.
The case to hospitalisation ratios (CHR) was set at 1%, below the recent Delta
wave CHR. The ICU parameter was un-calibrated and set at an additional
protection of 20%. The death parameter was also un-calibrated and assumed
an additional 10% reduction in COVID-19 ICU hospitalisations which later died.
The low severity assumption has 25% more asymptomatic infections compared
with Delta.
Scenarios are available for vaccine effectiveness against infection between
60% and 80%, which have a 85-95% vaccine effectiveness assumption against
severe events. This is line with most recent vaccine effectiveness estimates
from UKHSA for Omicron.
Schools were assumed to remain open and contacts were assumed to be
slightly higher than previous waves.
Case to Hospitalisation ratio, Wales
Looking at the most recent data for the CHR from mid-November 2021 to the
start of January 2022, the CHR shows a fall over time. With the Omicron
variant, we may see fewer community cases lead to hospital admissions, but at
the same time there may be an opposing force of an increase in nosocomial
cases and incidental covid positives on admission, both of which still involve a
lot of additional care in terms of clinical management, PPE and infection
prevention and control.
Page 13 of 21TAG ADVICE ONLY NOT WELSH GOVERNMENT POLICY
Source: PHW ICNet
Daily peaks and cumulative totals of COVID-19 cases, Wales
The following tables show the total and peak estimated COVID-19 cases,
hospitalisations and hospital bed occupancy that may occur between 1
December 2021 and 30 March 2022 due to the Omicron variant. Separate
tables are used to separate the scenarios run in December to the one run in
January.
Totals (Between 1 December 2021 and 30 March 2022) – 22 December 2021
models
Low severity Infections Cases Hospital
admissions
Low_L2_L0_0.6 1,849,700 517,680 5,770
Low_L2_L0_0.7 1,730,800 472,870 5,070
Low_L2_L0_0.8 1,625,640 432,680 4,490
Low_L2_L2_0.6 1,835,420 511,950 5,640
Low_L2_L2_0.7 1,719,830 468,500 4,970
Low_L2_L2_0.8 1,617,510 429,460 4,420
Low_Unmitigated_0.6 1,856,680 521,280 5,870
Low_Unmitigated_0.7 1,734,310 475,100 5,120
Low_Unmitigated_0.8 1,626,490 433,920 4,520
Page 14 of 21TAG ADVICE ONLY NOT WELSH GOVERNMENT POLICY
Totals (Between 1 December 2021 and 30 March 2022) – 5 January 2022
models
Infections Cases Hospital
admissions
0.6 VE 1,852,620 520,860 5,880
0.7 VE 1,736,740 477,070 5,180
0.8 VE 1,634,950 438,020 4,620
Daily peaks (Between 1 December 2021 and 30 March 2022) – 22 December
2021 models
Low severity Infections Cases Hospital Total bed
admissions occupancy
Low_L2_L0_0.6 74,020 16,780 180 1,120
Low_L2_L0_0.7 66,190 14,890 150 960
Low_L2_L0_0.8 57,370 13,120 130 820
Low_L2_L2_0.6 60,950 14,770 150 970
Low_L2_L2_0.7 54,550 12,610 130 850
Low_L2_L2_0.8 50,290 11,530 120 750
Low_Unmitigated_0.6 72,930 18,980 200 1,250
Low_Unmitigated_0.7 68,130 16,380 160 1,030
Low_Unmitigated_0.8 61,130 14,190 140 860
Figure 9: The estimated peak number of total COVID-19 hospital beds occupied per
day between 1 December 2021 and 30 March 2022, Wales
Page 15 of 21TAG ADVICE ONLY NOT WELSH GOVERNMENT POLICY
Source: Swansea University modelling (model run: 22 December 2021)
Daily peaks (Between 1 December 2021 and 30 March 2022) – 5 January model
Infections Cases Hospital Total bed
admissions occupancy
0.6 VE 64,870 17,700 180 1,130
0.7 VE 54,880 14,730 140 890
0.8 VE 49,640 12,290 120 740
ICU admissions and deaths
Source: Swansea University modelling (model run: 22 December 2021); StatsWales
L2_L0 means Alert Level 2 in wales for 2 weeks (from 26 December 2021) followed by Alert Level 0
for the subsequent 2 weeks. L2_L2 means Alert Level 2 in Wales for four weeks
Models only include Omicron ICU admissions, actuals are all COVID-19 ICU admissions.
Page 16 of 21TAG ADVICE ONLY NOT WELSH GOVERNMENT POLICY
Source: Swansea University modelling (model run: 5 January 2022); StatsWales
Models only include Omicron ICU admissions, actuals are all COVID-19 ICU admissions.
Source: Swansea University modelling (model run: 22 December 2021); PHW
L2_L0 means Alert Level 2 in wales for 2 weeks (from 26 December 2021) followed by Alert Level 0
for the subsequent 2 weeks. L2_L2 means Alert Level 2 in Wales for four weeks
Models only include Omicron deaths, actuals are all COVID-19 deaths.
Page 17 of 21TAG ADVICE ONLY NOT WELSH GOVERNMENT POLICY
Source: Swansea University modelling (model run: 5 January 2022); PHW
Models only include Omicron deaths, actuals are all COVID-19 deaths.
Page 18 of 21TAG ADVICE ONLY NOT WELSH GOVERNMENT POLICY
The updated 5 January 2022 Scenarios produced by Swansea University
compared with actuals
Page 19 of 21TAG ADVICE ONLY NOT WELSH GOVERNMENT POLICY
Page 20 of 21TAG ADVICE ONLY NOT WELSH GOVERNMENT POLICY
Page 21 of 21You can also read