Technology-Supported Learning Environment and its Impact on Attitudes Towards STEM
←
→
Page content transcription
If your browser does not render page correctly, please read the page content below
2018 ASEE Southeastern Section Conference

  Technology-Supported Learning Environment and its Impact on Attitudes
                            Towards STEM

                                  Chadia A. Aji and M. Javed Khan
                                  Tuskegee University, Tuskegee, AL

Abstract

Integration of technology in a learning environment has a positive impact on student
engagement, motivation and attitude towards Science, Technology, Engineering, and Math
(STEM). Middle school students from underrepresented groups in STEM participated in a one-
week long summer camp using an innovative technology supported intervention. They learned
selected math and physics concepts using hands-on activities with flight simulation software.
Additional components of the camp included learning about the physics of flight and the use of
spreadsheets to analyze data collected from the flight simulator. The participants were also
provided with talks on emerging STEM careers and they interacted with undergraduate student
mentors. A within-subject repeated measures (pre-post) quasi-experimental design was used.
Participants attitudes were measured with a 65-item survey that provided data on five dimensions
of attitudes towards STEM. Similarities and differences between male and female participants on
the survey items and the five dimensions were observed.

Keywords

Attitudes, STEM, middle school, active learning

Introduction

        The performance in math and science of K-12 students from the US is low in comparison
to the industrialized nations as seen from the results of international assessments. For example,
according to the 2015 PISA Report1, US 15-year-olds scored significantly lower than seventeen
industrialized countries in science, and more alarmingly, their performance in mathematics was
significantly lower than 37 countries. A more granular look at the data glaringly brings out the
achievement gap within the US K-12 student population. Data from the same PISA Report
showed that Blacks and Hispanics scored significantly lower than the White students. This
ethnically/racially stratified performance is seen in both PISA2 and US National assessments3.
        Several reasons have been cited in research literature for the low academic performance
of middle school students such as economic disparity4 and engagement with the learning
materials. It has been reported5 that 82% of high school students are sometime or most of the
time bored in the classroom. Incorporating technology in the classroom is commonly considered
to be an effective method to engage students. However, while the use of technology may
influence the affective dimension of engagement, it may not impact the cognitive engagement of
students, hence not yielding the expected result. Therefore, in addition to structural challenges
that contribute to the students’ less than acceptable performance, there are academic and
pedagogical challenges that need to be addressed. This work that is funded by the Innovative
Technology Experiences for Students Teachers program of the National Science Foundation

                         © American Society for Engineering Education, 2018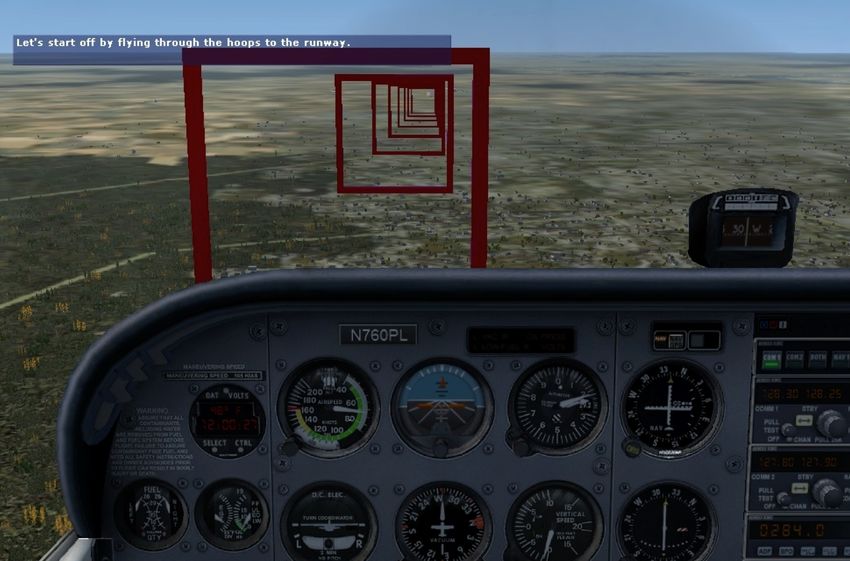
2018 ASEE Southeastern Section Conference
(Grant # 1614249), focused on how a deliberately designed learning environment that is
supported by an innovative use of technology impacts students’ attitudes toward STEM. The data
was gathered through pre-post surveys and analyzed to determine the changes in attitudes of the
participants. The impact of the use of the flight simulator on affective and cognitive engagement
was assessed. This paper however presents results of the impact on the emotional (self-efficacy)
and attitudinal domains of engagement.
Method
Participants
The project used flight simulation software to provide hands-on active learning
opportunities to 7-8 grades students (N = 26) from two rural counties of Alabama. Data is
presented for 25 students, N=25 (Male = 11, Female = 14) as one student did not take the post-
test. All participating students were from underrepresented groups and self-identified as African-
American.
Materials
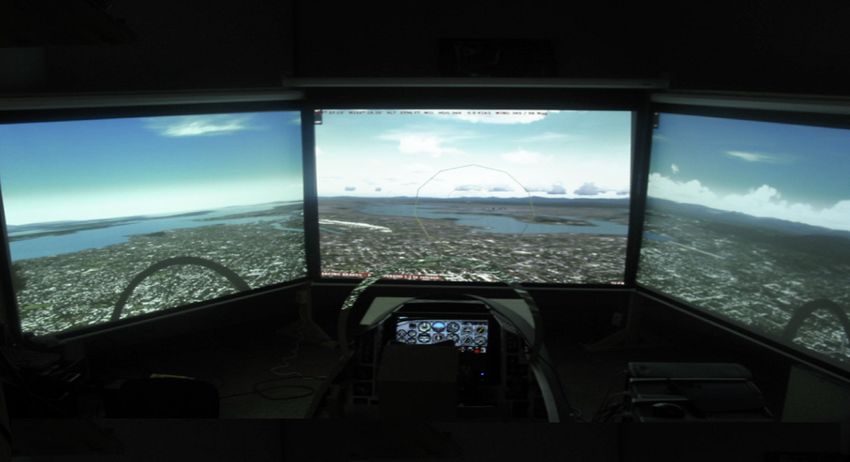
The intervention consisted of a one-week long summer camp.
The camp consisted of several activities mainly learning and
reinforcing some concepts of math and physics, and experiencing the
connections of these concepts with real life through flying specially
designed mission on the flight simulator using Microsoft FSX (Fig. 1).
The participants also learned about physics of flight and how to use
spreadsheet to import, graph and analyze the recorded data from the
flight mission.
The following four lessons were developed for the flight simulator. Additional lessons
are being developed. Details of each Figure 1: Flight simulator
lesson modules are included in the project website
(www.flyhightu.weebly.com).
(a) Ratios and Proportion
(b) Kinetic Energy and Potential Energy
(c) Slope and Rate of Change
(d) Newton’s Laws
However, only the Ratio and Proportion, and Kinetic
Energy and Potential Energy lesson modules were covered in the
one-week summer program. Participating student learned the
concepts through paper-pencil exercises. Subsequently, they
compared data collected from the flight simulator mission to
understand the linkages between concepts and real life (Fig. 2).
Procedure
A repeated-measures within-subject (pre-post)
experimental design was used. A 65-item math and science
attitudes survey instrument was administered to the participants at
the start and then at the end of the one-week camp. participants’ Figure 2. Example of hands-on
activity attitudes using a 5-point Likert scale from strongly disagree (1) to strongly agree (5).
Figure 2: Hands-on Activity
© American Society for Engineering Education, 2018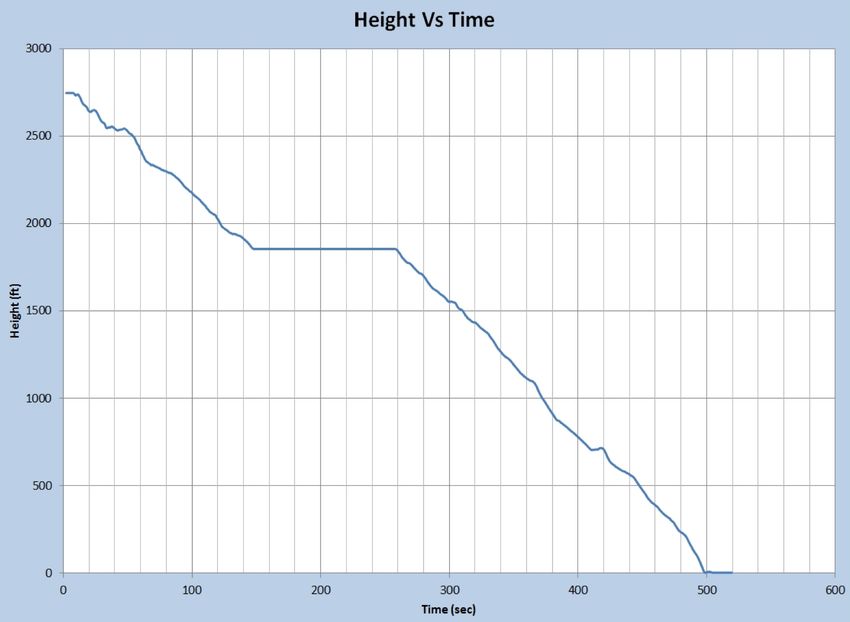
2018 ASEE Southeastern Section Conference

      Based on the factor loadings, five (5) dimensions were identified from the attitudinal
survey instrument: (1) Mathematics Importance and Usefulness (D1); (2) Mathematics
Enjoyment and Aptitude (D2); (3) Science Enjoyment and Aptitude (D3); (4) Science Importance
and Usefulness (D4), and (5) Math and Science Instruction (D5).

Results
       A pre-post correlated samples two-tail t-test of responses of all the participants (males
and females) to the following questions resulted in statistically significant differences in the
means at a p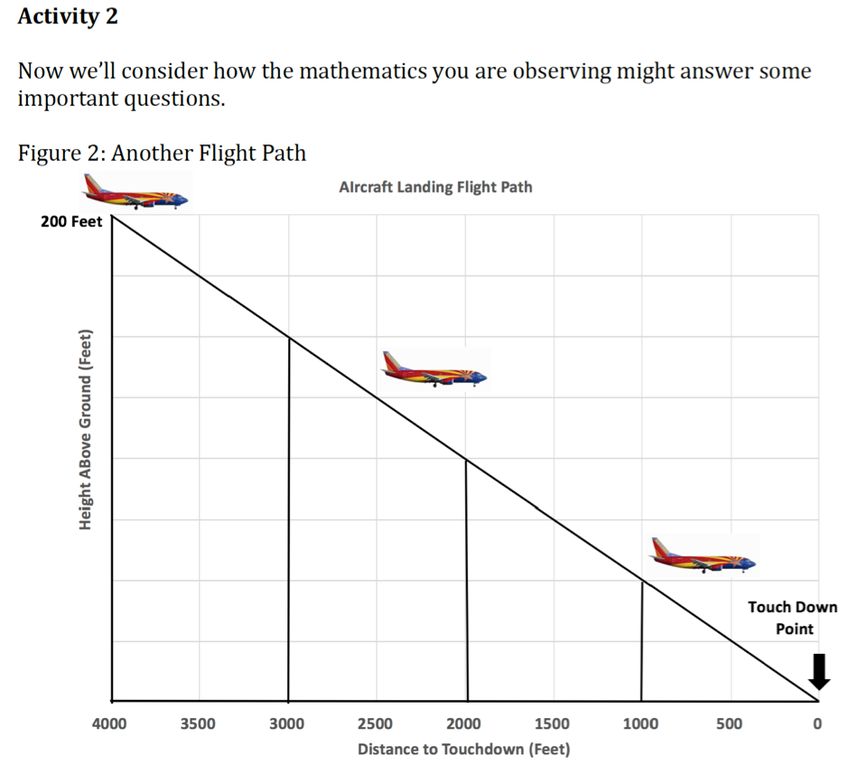
2018 ASEE Southeastern Section Conference

        Post-test data by gender for which there was a statistically significant difference (p
2018 ASEE Southeastern Section Conference
D1: Mathematics Importance and Usefulness (9 elements)
(no statistically significant difference on any question) - -
D2: Mathematics Enjoyment and Aptitude (15 elements)
• I have a good feeling towards math 4.00 4.50
D3: Science Enjoyment and Aptitude (15 elements)
(no statistically significant difference on any question) - -
D4: Science Importance and Usefulness (9 elements)
• Science is useful for the problems of everyday life 4.00 4.57
D5: Math and Science Instruction (17 elements)
• Using the flt. sim. in the class is a fun way to learn math and science concepts 3.71 4.64
• I think using the flt. sim. can help students learn science concepts 3.71 4.43
• I think using the flt. sim. can help students learn science concepts 3.57 4.71
Table 5: Pre-Post Analysis of Responses for Female Participants
The overall percentage change in attitudes for females and males in each dimension was
also compared as shown in Table 6.
Dimensions %Change F/M
D1: Mathematics Importance and Usefulness +15/-3
D2: Mathematics Enjoyment and Aptitude +20/-12
D3: Science Enjoyment and Aptitude +1/-3
D4: Science Importance and Usefulness +2/-3
D5: Math and Science Instruction +4/-5
Table 6: Pre-Post Average %Change in Each Dimension
The post-camp survey provided qualitative insight into the participants’ response to the
camp. Some representative responses are given below.
• I love this camp and I hope they have it next year because I enjoyed this program
• Overall, I think the camp changed my perspective on math
• I liked this camp and would like to come back
• I really loved the camp and the experience
Discussion
The pre-post analysis (Table 1) of the combined data of the male and female participants
indicated a statistically significant improvement in attitudes of the participants on only three of
the five dimensions, although this improvement was only in one element in each of the
dimensions. This prompted a deeper look at the data by analyzing it by gender. The gender-based
analysis provided interesting insights into the impact of the intervention on females and males.
However, before the impact of the intervention was analyzed by gender, the pre-
intervention attitudes were analyzed by gender to establish a base line. There were statistically
significant differences in pretest responses based on gender on four of the five dimensions (Table
2), albeit again this change was in only one element of each dimension. Of the five dimensions,
males had higher percentage of mean responses on elements of three dimensions D1, D4, and D5.
Female participants had higher percentage of mean responses only on the elements of D2. There
was no significant difference between males and females on the pretest in dimension D3.
Statistically significant differences based on gender on more questions of the various
dimensions on the post-test were observed (Table 3). The post-test data showed that the
© American Society for Engineering Education, 20182018 ASEE Southeastern Section Conference
intervention had a statistically significant positive impact on the self-efficacy of female
participants in comparison to the male participants. For example, the female students mean
response was more towards the ‘strongly disagree’ in response to the question “It scares me to
take math” as compared to the male students.
Although in the pretest, the response to the question of the importance of the need for
math in most jobs was statistically significantly higher for males (Table 2, D1), the analysis of
the post- test to the same question showed no statistically significant difference between males
and females. However, the importance of this element increased for male participants based on
the post-test results.
The pre-post analysis of responses for male participants (Table 4) showed that in
dimensions D2, D3, D4, and D5, the attitudes changed in the negative direction. For example, in
dimension D2, the post-test response to the question ‘when I hear the word math, I have a feeling
of dislike’ was more towards agreeing with the statement as compared to the pretest. However,
the response to the question ‘there is little need for math in most jobs’ in D1 moved in the
positive direction. These results indicate that the intervention did not have an overall positive
impact on male students.
The pre-post analysis of responses for female participants (Table 5) indicated positive
impact of the intervention in dimensions D2, D4, and D5. There was no significant change in D1
and D3. Therefore, based on these results from Tables 4 and 5, one can conclude that the
intervention had an overall positive impact on only female students.
Based on the comparison between females and males on their pre-post responses to each
dimension (Table 6), the changes were on the average in the positive direction for the females
while they were in the negative direction for the males. For example, the percentage change in
D1 was positive (by 15% change) for females as compared to the negative (by 3% change) for
males. This unexpected outcome of the intervention which was the movement of the attitudes of
the male participants in the negative direction, could be because of a smaller number of male
participants. The disinterest of some of the male participants (which was observed during the
camp) may have also contributed to this negative result.
As a summary, the intervention in general had a positive impact on attitudes for mainly
female students. In addition, the analysis did not show statistically significant changes in the
responses to most of the survey items and this overall result may also be due to the small number
of participants.
Future Work
The project will conduct additional summer camps with the design as reported in this
paper. The additional data that will be collected, will increase the statistical power of the sample
and the results will be more robust.
References
1. http://www.pewresearch.org/fact-tank/2017/02/15/u-s-students-internationally-math-science
2. https://nces.ed.gov/surveys/pisa/pisa2015/pisa2015highlights_3f.asp
3. https://www.nea.org/assets/docs/18021-Closing_Achve_Gap_backgrndr_7-FINAL.pdf
4. https://www.nea.org/assets/docs/18021-Closing_Achve_Gap_backgrndr_7-FINAL.pdf
5. High School Survey of Student Engagement (2014)
© American Society for Engineering Education, 20182018 ASEE Southeastern Section Conference
Chadia Affane Aji
Chadia Affane Aji is a Professor in the Department of Mathematics at Tuskegee University. Dr.
Aji received her Ph.D. and M.S. in Mathematics from Auburn University and a Bachelor in
Chemical Engineering from Texas A&M University. Her research interests lie in the areas of
numerical analysis, computational applied mathematics, complex analysis, and on improving
students’ learning in STEM disciplines. Dr. Aji is involved in retention activities at Tuskegee
University. In particular, she works closely with sources on campus to design strategies to assist
incoming freshmen cope with first year mathematics classes. She developed teaching modules to
improve students’ learning in mathematics using technology.
Mohammad Javed Khan
M. Javed Khan is Professor and Head of the Aerospace Science Engineering Department at
Tuskegee University. He received his Ph.D. in Aerospace Engineering from Texas A&M, MS in
Aeronautical Engineering from the US Air Force Institute of Technology and his undergraduate
degree in Aerospace Engineering from Karachi University. His disciplinary research interests
include vortex dominated flows, and aircraft design. He is actively involved in research on
engineering education and K-12 STEM education. He is a Fellow of the Royal Aeronautical
Society, an Associate Fellow of the AIAA and a member of the ASEE.
© American Society for Engineering Education, 2018You can also read