Testimony of Stephen J. Ezell Vice President, Global Innovation Policy Information Technology and Innovation Foundation Before the United States ...
←
→
Page content transcription
If your browser does not render page correctly, please read the page content below
Testimony of
                 Stephen J. Ezell
     Vice President, Global Innovation Policy
Information Technology and Innovation Foundation

                    Before the
              United States Senate
              Committee on Finance

                   Hearing on
        “Prescription Drug Price Inflation:
An Urgent Need to Lower Drug Prices in Medicare”

                March 16, 2022
                Washington, DC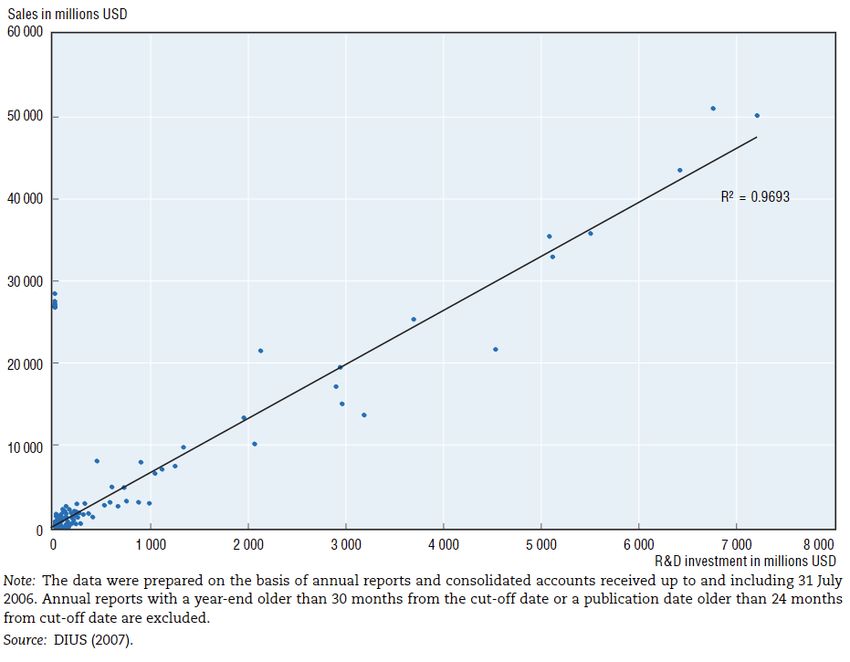
CONTENTS
Introduction................................................................................................................................................... 3
Drug Expenditures Have Been Stable Over Time ........................................................................................... 4
Profitability .................................................................................................................................................... 9
Value Created By Innovative Drugs ............................................................................................................. 10
Economic Impact of America’s Biopharmaceutical Industry ......................................................................... 12
R&D and Innovation Intensity of America’s Biopharmaceutical Industry .................................................... 12
    Innovation ............................................................................................................................................... 12
    R&D ....................................................................................................................................................... 13
Dynamics of Biopharmaceutical Innovation ................................................................................................. 15
    Drug Innovation Becoming More Difficult, Risky, and Expensive ........................................................... 15
    Companies Depend Upon Profits to Sustain Biopharmaceutical Investments .......................................... 15
    Drug Price Controls Inhibit R&D and Drug Discovery........................................................................... 17
    Drug Price Controls Impede Access to Medicines .................................................................................... 17
    Drug Price Controls Undermine Nations’ Biopharmaceutical Industry Competitiveness ......................... 19
Better Ways to Control Drug Prices ............................................................................................................. 21
    Bolster R&D and Innovation Efficiency .................................................................................................. 21
    Medicare Part D Reforms ........................................................................................................................ 22
Conclusion ................................................................................................................................................... 24
Endnotes ...................................................................................................................................................... 25

                                                                                 2
INTRODUCTION
Chairman Wyden, Ranking Member Crapo, and members of the Senate Finance Committee; thank you for
inviting me to share the views of the Information Technology and Innovation Foundation (ITIF) on the issue
of the U.S. life-sciences innovation ecosystem and the relationship between drug prices and patient costs in
the U.S. Medicare and broader healthcare system.
ITIF is an independent, nonpartisan research and educational institute focusing on the intersection of
technological innovation and public policy. As the world’s leading science and technology policy think tank,
ITIF’s mission is to formulate and promote policy solutions that accelerate innovation and boost productivity
to spur growth, opportunity, and progress.
While there is a need to reform the Medicare Part D program—notably by capping out-of-pocket patient
costs and reforming rebate policies—the reconstructive surgery of drug price controls envisioned in the Build
Back Better Act (BBBA), the H.R. 3 legislation before it, or the prior administration’s International Price
Index (IPI) is not the ideal way to manage America’s drug prices.
This testimony begins by contending that U.S. prescription drug expenditures have been broadly stable and
consistent over time—and expected to continue to be so in the future—while broadly in line with those of
international peers. It will show that prescription drug prices are, in fact, not a contributor to increased U.S.
inflation rates and that, overall, consumer prescription drug expenditures have risen at a much lower rate than
the increase in total healthcare expenditures since 2005. 1 It will contend that to the extent policymakers wish
to reform drug pricing challenges, they need to consider the costs that are introduced by all actors across the
pharmaceutical supply chain and compare profits in all relevant sectors, where the drug industry has lower
profits than most other healthcare subsectors. It will then examine the impact America’s biopharmaceutical
sector has on the U.S. economy and examine the significant value of the medicines and therapies the sector
produces on Americans’ quality, longevity, productivity, and the economic impacts thereof. It will contend
that stringent drug price controls are not only unnecessary and unwarranted but actually quite damaging in a
number of ways, including by inhibiting drug research and development (R&D), actually impeding patients’
access to innovative medicines, and potentially undermining nations’ biopharmaceutical competitiveness, as
drug price controls have in other nations. It concludes with policy recommendations to better manage drug
prices, including policy actions that could increase the R&D efficiency of America’s biopharmaceutical
innovation system and reforms to assist seniors at the pharmacy counter.
America is fortunate to be home to the world’s leading biopharmaceutical industry: one that leads the world
in R&D spending and the introduction of innovative, often breakthrough drugs that improve, extend, and
save lives. That America has become the leader as a result in part of intentional and conscientious public
policy choices over the past four decades to make it so: robust public and private R&D investments,
investment incentives like the R&D tax credit, and strong technology transfer and commercialization systems.
American policymakers should be proud of this industry and have as their foremost consideration policies that
could further enhance its innovation and productivity potential, such as increased National Institutes of
Health (NIH) R&D funding, expansion of public-private industrial R&D programs such as the National
Institute for Innovation in Manufacturing Biopharmaceuticals (NIIMBL) that seek to enhance the cost-
3effectiveness of drug discovery and manufacturing practices, and building up America’s biomedical STEM
(science, technology, engineering, and mathematics) talent pipeline.
On February 2, 2022, President Biden announced an aggressive, revitalized cancer moonshot that seeks to
reduce the death rate from cancer by at least 50 percent over the next 25 years while improving the experience
of people and their families living with and surviving cancer, thus trying to “end cancer as we know it today.” 2
While these are certainly laudable and needed aspirational goals, the last thing policymakers should be doing
is introducing stringent drug price controls that would hinder investments needed to meet the challenge. 3
Moreover, this is at a time when competitors, especially China, are seeking to overtake America’s lead in the
biopharmaceutical industry. 4
Policymakers should proceed very cautiously before drastically reforming a successful system that has enabled
America to lead the world in biomedical innovation, to get innovative drugs to patients first, to support a
vibrant and competitive domestic biopharmaceutical industry, and to do so while maintaining stable
prescription drug expenditures (as a share of total healthcare expenditures) over time through a system that
marries incentives for innovation and conditions for competition with pathways to introduce cheaper generic
and biosimilar drugs.
DRUG EXPENDITURES HAVE BEEN STABLE OVER TIME
Critics contend that drugs have experienced “skyrocketing costs,” are rapidly rising, and are a major
contributor to U.S. inflation. 5 However, the data suggests that, broadly, U.S. drug expenditures have been
roughly stable over time. 6 For instance, according to the Peterson Center on Healthcare and Kaiser Family
Foundation, the percentage of total U.S. health care spending going toward retail prescription drugs was
consistent from 2000 to 2017, at mostly under 10 percent, and even dipped slightly to 8 percent in 2020. 7
(See Figure 1.)
Figure 1: Percentage of total health spending going to retail prescription drugs, 2000–2020 8
12%
10%
8%
6%
4%
2%
0%
4Moreover, the prescription drug share of national health expenditures is expected to remain stable and
consistent going forward—just as it has over the past two decades. In fact, in a 2020 report, research firm
Altarum found that the share should remain roughly stable in the 9 percent range through most of this
decade, with non-retail expenditures also roughly stable in the 4.5 to 4.9 percent range over that period. (See
Figure 2.) Prescription medicines account for approximately 14 percent (as of 2018, 13.7 percent) of total
U.S. health care spending, with that overall share also looking to remain consistent throughout this decade. 9
Figure 2: Projected Prescription drug share of national health expenditures, 2018–2028 10
14%
12%
4.5% 4.6% 4.7% 4.8% 4.8% 4.8% 4.8% 4.8% 4.9% 4.9% 4.9%
10%
8%
6%
9.2% 9.1% 8.9% 8.9% 8.9% 8.9% 9.0% 9.0% 9.0% 9.0% 9.0%
4%
2%
0%
2018 2019 2020 2021 2022 2023 2024 2025 2026 2027 2028
Retail Rx Share Non-Retail Rx Share
It should also be noted that America’s expenditures on pharmaceuticals are well in-line with those of
international peers. The Organization for Economic Cooperation and Development (OECD) provides
internationally comparable data on OECD members’ expenditures on pharmaceutical drugs as a percentage of
their total health spending. For 2020, the United States stood right in line with peer nations, with its 12.6
percent of expenditures (as calculated by the OECD’s methodology) just slightly more than Austria, France,
Ireland, and Switzerland’s 11.9 percent and below Australia and Germany’s 13.8 and 14.3 respectively. 11
Sweden’s substantially lower share at 9.7 percent and Japan’s reportedly higher share at 17.8 percent may well
reflect population health peculiarities: Sweden having one of the world’s more physically fit populations,
Japan a more-elderly one that requires more prescriptions. But the broader point stands: on this indicator, as
with many others, U.S. pharmaceutical spending as a share of national health spending is quite in-line with
peer nations and far from out of balance. Moreover, for a roughly equivalent level of national investment,
America’s life-sciences system gives it so much more, including the ability to field the world’s most
competitive biopharma industry and lead the world producing innovative medicines and getting them to
citizens first.
5Figure 3: Pharmaceutical spending as % total health spending, 2020 (or latest available year) 12
25%
20%
15%
10%
5%
0%
Thus, both historical and international expenditure trends demonstrate that U.S. prescription drug spending
cannot be termed “skyrocketing” or abnormally high. Drug expenditures have largely been stable, suggesting
that the historical rate of increase in drug prices has not been excessive compared to other healthcare costs.
Moreover, prescription drugs are in no way a significant contributor to the increased inflation the United
States is presently experiencing. In fact, over the past 12 months, prescription drug prices increased just 2.4
percent, well below the average consumer price index (CPI) increase of 8 percent and less than other parts of
the U.S. healthcare system, such as health insurance, which experienced a 4.1 percent increase. (See Figure 4.)
Figure 4: Consumer price index by sector,12-month change ending in February 2022 13
Prescription drugs
Medical care
Hospital services
Nursing homes
Health insurance
Apparel
Food
All Goods
Electricity
Energy
Gasoline
Used cars and trucks
0% 5% 10% 15% 20% 25% 30% 35% 40% 45%
6Nor is this recent trend unique. In fact, as calculated by the U.S. Bureau of Labor Statistics, from 2005 to
2020, Americans’ reported expenditures on health insurance increased by over 160 percent, and total
healthcare expenditures increased 94 percent, while consumer expenditures on drugs actually fell by almost 9
percent. (See Figure 5.) Of course, this does not necessarily mean overall drug expenditures fell because health
insurance and hospitals also purchase drugs, but it does address consumers’ out-of-pocket costs.
Figure 5: Percent change in consumers’ reported healthcare expenditures, 2005–2020 14
180%
160%
140%
120%
100%
80%
60%
40%
20%
0%
-20%
Health Health Care Medical Medical Drugs
Insurance Total Supplies Services
While drug expenditures have grown at moderate rates in recent years, an increasing share of those
expenditures goes not to the manufacturer but to other actors in the supply chain. When payment is made for
a prescription drug at the point of sale, only a portion of that payment accrues to the drug manufacturer. The
rest accrues to non-manufacturer stakeholders in the supply chain—pharmacy benefit managers (PBMs),
health plans, hospitals, the government, and pharmacies in the form of “rebates, discounts, fees, and other
payments. 15
Over time, drug manufacturers have lost a growing share of drug expenditures to other members of the drug
supply chain, such as PBMs, health plans, hospitals, the government, and pharmacies. Since 2013, the share
of drug expenditures going to manufacturers has decreased by 13 percent. Thus, while total expenditures on
brand drugs grew by $268 billion between 2013 and 2020, only 31 percent of the increase accrued to the
manufacturers, while 69 percent accrued to other stakeholders. By 2020—for the first time ever—over half of
drug expenditures accrued to non-manufacturers. (See Figure 6.)
7Figure 6: Total gross expenditures for brand medicines received by manufacturers and other stakeholders
(2013–2020) 16
80%
70% 66.8%
64.9%
62.5%
60% 58.3%
56.0%
51.5% 50.9% 50.5%
50%
48.5% 49.1% 49.5%
44.0%
40% 41.7%
37.5%
33.2% 35.1% Manufacturer-Retained
30%
Other Entity-Retained
20%
10%
0%
2013 2014 2015 2016 2017 2018 2019 2020
Indeed, particular attention must be paid to the role played by rebates and discounts. Discussion of drug
prices tends to focus on the annually announced increase in the list prices for prescription drugs. However,
sales of prescription drugs are subject to substantial manufacturer rebates and discounts, leading to a
considerable reduction in manufacturer earnings. Researchers at the University of Pittsburgh School of
Pharmacy and Medicine estimate that while the average annual increase in the list price for prescription drugs
between 2007 and 2018 was 9.1 percent, the net increase in drug prices after rebates was only 4.5 percent. 17
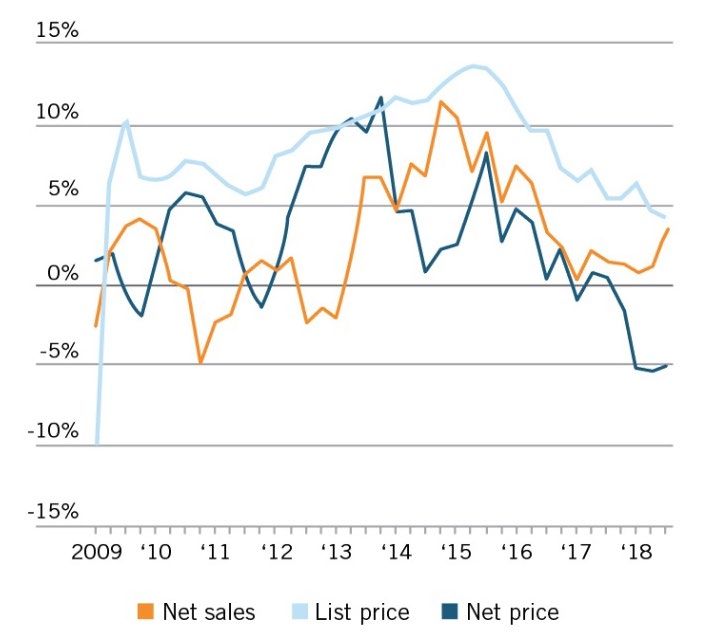
In recent years, as list prices have been growing at a Figure 7: Change from a year earlier in U.S.
slower pace, the volume of discounts and rebates has prescription brand prices, 2009–2019
increased. For example, in 2020, list prices grew at
an average rate of 4.4 percent, but net prices
decreased by 2.9 percent. 18 As the Wall Street
Journal, citing data from the SSR Health Report,
notes, “[A]verage U.S. list prices for prescription
medicines rose in the past decade, but net prices—
after rebates and discounts—rose less sharply and
have recently declined.” 19 (See Figure 7.) In fact,
one study found that more than one-third of drug
list prices were rebated back to pharmacy benefit
managers and other entities in the supply chain. As
that report describes, “Pharmaceutical spending
estimates that omit rebates and discounts do not
fully reflect the underlying competitive dynamics of
the pharmaceutical sector and provide a misleading
impression of drug spending.” 20
8Fees charged by intermediaries also subtract from drug manufacturer revenues. PBMs nearly quadrupled the
fees they charge biopharmaceutical companies—such as administrative and service fees—between 2014 and
2016. Total fees charged to biopharmaceutical companies by these middlemen increased from $1.5 billion in
2014 to $2.6 billion in 2015, and then doubled to nearly $5.6 billion in 2016. Along with rebates, these
fees— which are typically based on the list price of a medicine—contribute to a system of misaligned
incentives where middlemen make more money when the list prices of medicines increase. 21
Despite an increase in the share of negotiated rebates shared with health plan and employer clients, total PBM
revenue increased between 2014 and 2016. That’s in part due to the increasing administrative fees they
charged biopharmaceutical companies. But PBMs aren’t just charging biopharmaceutical companies more
than ever before—they also brought in a record total of $22.4 billion in revenue in 2016 by charging more to
others in the supply chain, such as health plans and pharmacies. 22
PROFITABILITY
America’s life-sciences innovation sectors are not enjoying consistently outsized returns, particularly when
compared to other actors in America’s healthcare system. For example, Deloitte’s “2020 Global Life-sciences
Outlook” report finds that drug intermediaries and retailers—notably pharmacies, wholesalers, and PBMs—
generally earned higher returns on investment over the years 2011 to 2017 than the biopharmaceutical and
medical device manufacturers who are actually innovating new-to-the-world, life-saving or life-improving
drugs and medical devices. 23 By 2017, pharmacies and wholesalers continued to enjoy substantially higher
returns on capital (RoC), while PBMs and health plans realized slightly larger returns than pharmaceuticals.
(See Figure 8.) In fact, the report found that of the U.S. healthcare sectors it studied, life-sciences
manufacturers (pharmaceuticals and medical technology) actually experienced the largest drop in returns on
capital (ROC), from 17 percent in 2011 to 11 percent in 2017. 24 In other words, the often-made claim that
drug prices are too high because of limited competition and excess profits does not hold up to the evidence.
Figure 8: Return on capital performance in health care sectors, 2017 25
20%
18%
16%
14%
12%
10%
8%
6%
4%
2%
0%
9Researchers at the University of Southern California have sought to estimate excess returns (the extent to
which a firm’s profits are higher than expected given the risk associated with their investments) for
manufacturers and middlemen in the pharmaceutical supply chain. They found that the rate of return on
investments of large firms in the pharmaceutical industry between 2013 and 2018 was just 1.7 percent once
adjusted for the risk premium paid for capital and the more logical treatment of R&D expenditures as long-
term investments rather than current costs. 26 For comparison, the overall S&P 500 had an excess rate of
return of more than double—3.6 percent—over this period.
In an article in the International Journal of Health Economics and Management, Sood et al., found that other
players in the pharmaceutical supply chain realized higher excess returns. Specifically, for the period 2003 to
2018, they found that wholesalers earned excess returns of 8.1 percent and that insurers, PBMs, and retailers
collectively earned excess returns of 5.9 percent. The authors did find that the cohort of biotechnology firms
in their study realized the highest excess returns of any group, at 9.6 percent, though they note this was in
part driven by several blockbuster drugs introduced from 2013-2015, notably new Hepatitis C drugs, and
that by 2018 the sector’s excess rate of return had fallen to under 9 percent. More importantly, however, the
authors note that, “In contrast with middlemen, monopoly power in the pharmaceutical and biotech
sectors—derived through the U.S. patent system—provides [an] incentive for innovation that might not
happen otherwise.” 27 In other words, as the subsequent section elaborates, society enjoys high-value impacts
in terms of quality, productivity, and longevity of life from the latter sector’s returns. Sood et al. conclude by
fairly noting that “policies that promote competition in all areas of the pharmaceutical supply chain are
important avenues” for managing drug spending.
That said, even modestly higher returns for America’s biotechnology or pharmaceutical sectors should not be
cause for significant concern. As a former Congressional Office of Technology Assessment (OTA) study
pointed out, “Pharmaceutical R&D is a risky investment; therefore, high financial returns are necessary to
induce companies to invest in researching new chemical entities.” 28 Or, as Harvard University industrial
organization economist Scherer writes, “Had the returns to pharmaceutical R&D investment not been
attractive, it seems implausible that drugmakers would have expanded their R&D so much more rapidly than
their industrial peers.” 29
This is why price controls would be so damaging to the industry. As the OTA study found, “excess returns
over R&D costs would be eliminated if the annual revenue per compound was reduced by 4.3 percent over
the product’s life.” This is a similar finding to the OTA’s finding that U.S. drug firms had an average profit
rate of just 2 to 3 percentage points higher per year than the internal rate of return in control-group
industries. 30 In other words, efforts to drive down profits may yield only small price declines, as compared to
generating significant R&D reductions, as a subsequent section further elaborates. 31
VALUE CREATED BY INNOVATIVE DRUGS
The reality is that America derives tremendous value from the 14 cents on every healthcare dollar it spends on
prescription drugs. First, pharmaceutical innovation boosts longevity, productivity, and standards of living.
Second, pharmaceutical treatments and therapies that can intervene earlier to prevent, effectively treat, or even
cure diseases can save America’s healthcare system from incurring considerable costs by helping keep patients
out of hospitals and physicians’ offices. For this reason, far from being viewed solely or even principally as a
10cost, medicines (and their prices) should be viewed as a key component of the solution to burgeoning overall
healthcare system costs. For example, if the cost of medicines were to increase by 10 percent, but this could
yield 15 or 20 percent savings to the broader healthcare system, then surely this would be a tradeoff worth
making.
To the first point above, Columbia University professor Frank Lichtenberg finds that pharmaceutical
innovation accounted for 73 percent (or 1.27 years of the 1.73-year increase in life expectancy) of the increase
between 2000 and 2009 in life expectancy at birth across 30 countries, including the United States. 32 Another
study by Lichtenberg found that drugs launched since 1982 have added 150 million life-years to the lifespans
of citizens of the 22 countries analyzed, with the average pharmaceutical expenditure per life-year saved being
$2,837. 33 In other words, it would cost just $2,837 to extend life one year. A related study found that if no
new drugs had been launched after 1981, the number of years of life lost would have been more than twice as
high as it actually was. 34
Consider cancer. Since peaking in the 1990s, U.S. cancer fatality rates have fallen by 32 percent. 35
Approximately 73 percent of survival gains in cancer are attributable to new treatments, including
medicines. 36 For instance, the development of breakthrough drugs such as Imatinib for chronic myeloid
leukemia (CML) has increased the five-year survival rate for CML patients to 89 percent, with many CML
patients now living close-to-normal lifespans. 37 Such innovations explain why American citizens enjoy the
highest cancer-survival rates in the world, with over 90 percent of U.S. women suffering from breast cancer
still living five years later, something which matters greatly when 1 in 2 American women, and 1 in 3 men,
are likely to receive a cancer diagnosis in their lifetime. 38
To the second point, drugs further produce health system value well above their cost. For instance,
Lichtenberg finds that from 1997 to 2010, “the value of reductions in work loss days and hospital admissions
attributable to pharmaceutical innovation was three times larger than the cost of new drugs consumed.” 39
Elsewhere, Lichtenberg found that the mean number of lost workdays, lost school days, and hospital
admissions declined more rapidly among medical conditions with larger increases in the mean number of new
(post-1990) prescription drugs consumed. 40 He further found that “the use of newer prescription drugs also
reduced the ratio of the number of workers receiving Social Security Disability Insurance benefits to the
working-age population, and has had a positive effect on nursing home residents’ ability to perform activities
of daily living.” 41 Updating this work in October 2021, Lichtenberg estimated the value in 2015 of the
reductions in disability, Social Security recipiency, and use of medical care attributable to previous
biopharmaceutical innovation. That value, estimated at $115 billion annually, stood fairly close to 2015
expenditures, $127 billion, on drug classes that were first approved by the U.S. Food and Drug
Administration (FDA) during the period 1989 to 2006. 42
Thus, far from being the leading cause of rising U.S. healthcare system costs, greater levels of life-sciences
innovation will be key to limiting the growth of those costs. Indeed, significant economic benefits could be
achieved if innovative medicines could make progress toward addressing some of the most intractable
diseases. 43 For instance, even just a 1 percent reduction in mortality from cancer would deliver roughly $500
billion in net present benefits, while a cure could deliver $50 trillion in present and future benefits. 44
Likewise, the financial impact of Alzheimer’s disease is expected to soar to $1 trillion per year by 2050, with
much of the cost borne by the federal government, according to the Alzheimer’s Association report
11“Changing the Trajectory of Alzheimer’s Disease.” 45 However, the United States could save $220 billion
within the first five years and a projected $367 billion in the year 2050 alone if a cure or effective treatment
for Alzheimer’s disease were found. Overall, the potential economic opportunity associated with curing brain
diseases and related disorders could be more than $1.5 trillion per year—equivalent to 8.8 percent of U.S.
gross domestic product (GDP). 46 Of course, these kinds of returns aren’t limited to the life-sciences industry;
they’re indicative of the economic value returned by America’s innovation industries in general, which is why
Yale economist William Nordhaus found that, “Inventors capture just 4 percent of the total social gains from
their innovations,” while the other 96 percent spills over to other companies and society as a whole. 47
ECONOMIC IMPACT OF AMERICA’S BIOPHARMACEUTICAL INDUSTRY
America is fortunate to host the world’s leading biopharmaceutical industry. In 2017, America’s
biopharmaceutical industry produced $560 billion in direct economic output, with the ripple effect of this
production throughout the economy generating an additional $589 billion in output from suppliers and
other economic sectors, bringing the sector’s total economic output to over $1.1 trillion. Also, in 2021, the
U.S. pharmaceutical industry accounted for $78 billion of exports. 48
In 2017, the U.S. biopharmaceutical industry employed 811,000 workers directly, with this employment
further supporting approximately 3.2 million additional U.S. jobs through the supplier base and from the
additional economic impacts stemming from industry and worker spending. 49 In total, the sector supports
over 4 million well-paying U.S. jobs. On average, wages for biopharmaceutical workers topped just over
$140,000 in 2019, compared with $58,200 for all U.S. workers. 50 The industry also supports a number of
high-wage manufacturing and construction jobs; in fact, analysis by the Pharmaceutical Industry Labor-
Management Association and the Institute for Construction Economic Research (ICERES) shows the
biopharma and biotech industry contributed to more than $774 million in union wages for construction
workers between 2015 and 2020. 51
R&D AND INNOVATION INTENSITY OF AMERICA’S BIOPHARMACEUTICAL
INDUSTRY
America’s biopharmaceutical industry leads the world in innovation, thanks largely to its world-leading
investments in R&D and risk capital (supported by robust intellectual property rights, investment incentives,
and effective technology transfer and commercialization mechanisms) as the following sections articulate.
Innovation
While the economic impact of America’s biopharmaceutical industry is vitally important, its most-important
contribution comes in that America’s biopharmaceutical industry leads the world in creating new drugs and
therapies that are improving, saving, and extending human lives. This was nowhere more on display than
during the COVID-19 pandemic, when the industry was able to bring novel vaccines and therapeutics to
U.S. and global citizens within just over a year of the virus’s discovery. The tremendous bench strength of
American talent, scientific research and knowledge base, and biomedical infrastructure—the product of
decades of robust private and public investment alike—explains how Gilead Sciences could provide an
effective COVID-19 therapeutic, remdesivir, a mere 123 days after the virus was first detected in a patient
sample and how the Pfizer-BioNTech vaccine could arrive 347 days after the virus’s first detection. 52
12Moderna delivered the first doses of its COVID-19 vaccine to the National Institutes of Health for testing on
February 24, 2020, a mere six weeks after Chinese scientists put the genetic sequence of the novel coronavirus
online on January 11, 2020. 53 To put the incredibly rapid COVID-19 vaccine development timeline in
context, a GlaxoSmithKline representative had explained in 2017 how, “It can take up to $1 billion and 20-
50 years to create and fully distribute a vaccine at scale.” 54
But that’s just one example. In the 2000s, U.S.-headquartered biopharmaceutical enterprises generated more
new-to-the-world drugs than companies from the next five nations combined. 55 Indeed, in every five-year
period since 1997, the United States has produced newer chemical or biological entities than any other
country or region. And from 1997 to 2016, U.S.-headquartered enterprises accounted for 42 percent of new
chemical or biological entities introduced throughout the world, far outpacing relative contributions from
European Union (EU) member countries, Japan, China, or other nations. 56 Put simply, over the past two
decades, U.S.-headquartered biopharmaceutical enterprises accounted for almost half of the world’s new
drugs. Among others, these have included effective breakthrough oncological treatments or therapies for
breast, lung, cervical, colorectal, and skin cancer; childhood leukemia; cystic fibrosis; lupus; and even a cure
for hepatitis C. Captopril (1981), Prozac (1987), trastuzumab (1998), sirolimus (1999), adalimumab (2002),
pembrolizumab (2014), Kymriah (2017), and Luxturna (2017) are just some of the headline biopharma
breakthroughs developed by American life-sciences companies over the past 50 years. 57
Moreover, amidst the COVID-19 pandemic, several impressive biotech and biopharma breakthroughs went
unnoticed. In 2021, the FDA advanced several disease-modifying drugs used to treat the underlying biology
of Alzheimer’s rather than the symptoms, including by awarding a breakthrough therapy designation to
donanemab developed by Eli Lilly. 58 Gingko Bioworks’ groundbreaking research on synthetic biology and the
Brigham and Women’s Hospital’s CRISPR research are on the frontlines alongside mRNA for potential
designer treatments. 59 Harvard University’s research into identifying brain biomarkers is also a game-changer
for potentially predicting and treating neurodegenerative diseases. 60
R&D
The United States leads the world in biomedical innovation in no small part because it invests more in
biomedical R&D than any other nation. According to Research America, total U.S. medical and health
research and development investment reached $245 billion in 2020, an 11 percent increase since 2019, which
included $162 billion (roughly two-thirds) invested by industry and $62 billion by federal departments and
agencies. 61 Indeed, the United States has clearly been the world’s largest global funder of biomedical R&D
investment over the past two decades, a share that some analyses suggested reached as high as 70 to 80 percent
over that time period. 62
Moreover, the U.S. biopharmaceutical industry is both America’s and the world’s most R&D-intensive
industry of any kind. As the U.S. Congressional Budget Office (CBO) explains, “Over the decade from 2005
to 2014, the industry’s R&D intensity averaged 18 to 20 percent per year. That ratio has been trending
upward since 2012, and it exceeded 25 percent in 2018 and 2019.” 63 This level of R&D investment is
substantially more than any other U.S. industry. As the CBO observes, “By comparison, average R&D
intensity across all [U.S.] industries typically ranges between 2 and 3 percent” and even “R&D intensity in
the software and semiconductor industries, which are generally comparable to the drug industry in their
reliance on R&D, has remained below 18 percent.” 64 (See Figure 9.) America’s biopharmaceutical sector
13accounts for 18 percent of total U.S. business R&D investment. 65 Importantly, the CBO notes that while
“Consumer spending on brand-name prescription drugs has risen, [the industry’s] R&D has risen more
quickly.” 66
Figure 9: Average R&D intensity for publicly traded U.S. companies, by industry 67
30%
25%
20%
Pharmaceuticals
Semiconductors
15%
Software
Technological Hardware
10% S&P Total Market Index
5%
0%
2000 2002 2004 2006 2008 2010 2012 2014 2016 2018
Lastly, it’s important to note that 23 percent of the American biopharmaceutical industry’s workforce can be
found at the lab bench in R&D jobs seeking to create new cures, giving the industry a share of employment
dedicated to R&D three times higher than the national average. 68 Moreover, the sector alone employs over
one-quarter of America’s total R&D workforce. Many of these R&D workers will invest their careers
searching for innovative new drugs that never see the light of day. The point is that America’s
biopharmaceutical industry is fundamentally research-driven and innovation-focused, dedicated to the
discovery and development of innovative drugs for the betterment of human society.
As ITIF has written extensively elsewhere, it should be briefly noted here that America’s life-sciences
innovation ecosystem is also ably supported by an effective set of policies that facilitate the transfer and
commercialization of technology (in the life-sciences, often molecular compounds) originally developed in
private research institutions, universities, or national labs to the private sector for development into innovative
drugs to be tested through clinical trials and brought to market. 69 Indeed, academic technology transfer
enabled by the Bayh-Dole Act has facilitated the development of approximately 300 new drugs and vaccines
that are now protecting public health worldwide. 70
Another key strength of America’s life-sciences innovation system has been creating a financial-markets
environment capable of both valuing and marshaling the tremendous amount of capital necessary to finance
investment in risky biopharmaceutical innovation. 71 Indeed, nearly three-quarters of worldwide venture
capital investments in biopharmaceutical companies are made in the United States. 72 Over the past two years,
14the U.S. biopharmaceutical sector has attracted over $50 billion of risk capital investment. 73 While certainly
most of these investments will fail, venture capital investors undertake these risky investments in the hope that
successes will yield commensurate returns, a bet that would be undermined if stringent drug price controls
were applied to the relatively few successful drugs that result.
DYNAMICS OF BIOPHARMACEUTICAL INNOVATION
As drug innovation becomes more difficult and expensive, companies increasingly depend upon the profits
from one generation of biomedical innovation to fund investment in the next, a dynamic that would be
undermined if policymakers implement stringent drug price controls, as the following section explains.
Drug Innovation Becoming More Difficult, Risky, and Expensive
As companies try to solve heretofore intractable and unsolved challenges at the frontiers of biomedical science,
the challenge gets ever-more difficult. Indeed, the biopharmaceutical industry must be so R&D-intensive
precisely because bringing innovative new drugs to market represents a risky, time-consuming, and expensive
process. On average, as many as 5,000 to 10,000 compounds may be screened to get to approximately 250
promising molecular compounds that can enter preclinical testing, with 5 entering actual clinical testing. 74
And that’s just getting to the clinical trial stage, as less than 12 percent of candidate medicines that even make
it into Phase I clinical trials are ultimately approved by the FDA. 75
Overall, it takes 11.5 to 15 years of R&D and clinical trials to develop an innovative new drug, with the
average cost of doing so almost doubling during the prior decade, increasing from $1.19 billion in 2010 to
$2.17 billion by 2018, according to the Deloitte Center for Health Solutions. (Other estimates place the
figure as high as $2.87 billion). As a Deloitte report notes, “The average cost to develop an asset, including
the cost of failure, has increased in six out of eight years.” 76 The 2019 version of the report concludes that the
average cost of bringing a new biopharmaceutical drug to market has increased by 67 percent since 2010
alone. 77 At the same time, Deloitte finds that forecast peak sales per asset have already more than halved since
2010. Perhaps most significantly, the biopharma industry has experienced a downward trend in returns to
pharmaceutical R&D: Deloitte found that the rate of return to R&D in 12 large-cap pharmaceutical
companies declined from 10.1 percent in 2010, to 4.2 percent in 2015, and then to 1.8 percent in 2019. 78
This is evidence that genuinely new biopharmaceutical innovation is becoming more difficult as companies
try to tackle more difficult maladies previously unsuccessfully solved by biomedical science: challenges such as
pancreatic cancer, Alzheimer’s, rare diseases, etc.
Companies Depend Upon Profits to Sustain Biopharmaceutical Investments
That’s why there exists a direct link between the expensive and risky process of drug development and the
need to earn commensurate returns on successful drugs to sustain the process. This explains why the CBO
estimates that, because of the high failure rates, biopharmaceutical companies need to earn a 61.8 percent rate
of return on their successful new drug R&D projects in order to match a 4.8 percent after-tax rate of return
on their investments (i.e., a risk-free rate they could readily attain in public markets). 79
Indeed, the claim that any individual drug generates very high profits cannot be viewed in isolation. All the
drugs that did not make it through clinical trials to the marketplace by definition generated no profits, only
losses. But even many drugs that make it to the market do not cover their costs. In a 1990 article, Grabowski
15and Vernon found that 70 percent of new drugs made less than their R&D costs. Entities in the third-most-
profitable decile barely broke even; those in the second decile had discounted profits nearly twice discounted
R&D costs. 80 Fifty-five percent of industry revenues came from the top ten drugs, whose average discounted
profits exceeded discounted R&D costs by a factor of five. In an updated article released in 2010, Vernon,
Golec, and DiMasi found that 80 percent of new drugs made less than their capitalized R&D costs. Entities
in the second-most-profitable decile barely broke even; those in the first decile had discounted profits more
than twice their discounted R&D costs. 81 Other studies have found that of the most successful 10 percent of
approved drugs, only 1 percent of those that entered clinical trials—maybe three new drugs each year—
generate half of the profits of the entire drug industry. 82
Figure 10: R&D expenditures and sales in the pharmaceutical industry, 2006 83
This dynamic explains why virtually all academic assessments find strong links between industry profits and
R&D investments. For instance, the OECD has found that “there exists a high degree of correlation between
pharmaceutical sales revenues and R&D expenditures.” 84 Indeed, there exists an almost 1:1 correlation (0.97)
between R&D expenditures and sales in the OECD study. (See Figure 10.) Related academic research shows
a statistically significant relationship between a biopharma enterprise’s profits from the previous year and its
R&D expenditures in the current year. 85 Likewise, Gambardella found that sales revenue from previous
periods have a significant, positive impact on current-period biopharma R&D. 86 Henderson and Cockburn
find that the pharmaceutical firms with the greatest sales are also the ones with the largest R&D investments.
16Lastly, research by Dubois et al. makes this dynamic crystal clear, finding that every $2.5 billion of additional
biopharmaceutical revenue leads to one new drug approval. 87
Drug Price Controls Inhibit R&D and Drug Discovery
This explains why academic studies consistently reveal that a reduction in current drug revenues leads to a
decrease in future research and the number of new drug discoveries. 88 For instance, one study found that a
real 10 percent decrease in the growth of drug prices would be associated with an approximately 6 percent
decrease in pharmaceutical R&D spending as a share of net revenues. 89 Similarly, Lichtenberg found a 10
percent decrease in cancer drug prices would likely cause a 5 to 6 percent decline in both cancer regimens and
research articles. 90 Likewise, Golec and Vernon show that if the United States had used an EU-like drug
pricing system from 1986-2004, this would have resulted in a decline in firms’ R&D expenditures of up to 33
percent and the development of 117 fewer new medicines. 91 Maloney and Civan found that a 50 percent drop
in U.S. drug prices would result in the number of drugs in the development pipeline decreasing by up to 24
percent. 92 Similarly, Abbot and Vernon estimate that a price cut of 40 to 45 percent in real terms would
reduce the number of new development projects by 50 to 60 percent. 93 Most recently, 2021 research by
Tomas Philipson and Troy Durie at the University of Chicago estimate that a 1 percent reduction in
pharmaceutical industry revenue leads on average to a 1.54 percent decrease in R&D investment. 94
Applying their research to HR 5376 (the Build Back Better Act), Philipson and Durie find the legislation
would reduce revenues by 12.0 percent through 2039, with the reduced revenues meaning R&D spending
will fall by about 18.5 percent, or $663 billion. They find that this cut in R&D activity leads to135 fewer
new drugs, while this drop in new drugs is predicted to generate a loss of 331.5 million life years in the
United States. 95
Conversely, research by Schwartz et al. found that if government price controls in non-U.S. OECD countries
were lifted, the number of new treatments available would increase by 9 to12 percent by 2030, equivalent to 8
to 13 new drugs in that year. This could potentially increase the life expectancy of someone 15 years old today
by 0.6 to 1.6 years on average. 96 Instead of copying other OECD countries in a “reference-price-race-to-the-
bottom,” U.S. policy should instead actually be to encourage peer countries to appropriately value innovative
medicines.
Analyses such as these explain why a February 2018 report by the president’s Council of Economic Advisors
found that while lowering reimbursement prices in the United States would reduce the prices Americans pay
now for biopharmaceutical products, it would “make better health costlier in the future by curtailing
innovation,” thus failing to meet the goal of reducing the price of health care by reducing the incentives for
innovative products in the future. 97
Drug Price Controls Impede Access to Medicines
Stringent drug price controls don’t only impede R&D and innovation, they preclude access to innovative
medicines. For instance, the Department of Health and Human Services’ October 2018 report, “Comparison
of U.S. and International Prices for Top Medicare Part B Drugs by Total Expenditures,” analyzed the price
and availability of 27 drugs across 16 comparator countries. 98 It found that only 11 of the 27 drugs examined
were widely available in all the comparator countries, indicating that patients in these countries were
17experiencing delays in access to innovative treatments. For instance, while 95 percent of new cancer drugs are
available to patients in the United States, this compared to just an average of 55 percent of new drugs are
available among the 16 reference countries. Further, for the cancer drugs available in the reference countries,
there appears to be a 17-month average lag between the time they are available in the United States and their
availability elsewhere. This concords with research by Cockburn, Lanjouw, and Schankerman finding that
countries that introduce drug price controls experience “significantly longer lags” in new drug introduction of
25 to 80 percent. 99
A broad range of research suggests that Americans enjoy access to innovative medicines earlier than citizens in
other nations do. 100 For instance, considering the availability of new medicines first launched globally from
2011 through year-end 2019, 87 percent were available first in the United States, a wide gap over Germany
and the United Kingdom, at 63 and 59 percent respectively, with percentages declining to as low as 46
percent in Canada and 39 percent in Australia. Considering the percentage of drugs available within one year
of global first launch, again U.S. citizens enjoyed the greatest access, with 80 percent of drugs available to
Americans first, followed by Germany and the United Kingdom at 47 and 41 percent, respectively, and again
Canada and Australia trailing at 26 percent and 19 percent, respectively. (See Figure 11.) For these medicines,
the average delay in availability in months from global first drug launch averaged 0 to 3 months in the United
States, 10 in Germany, 11 in the United Kingdom, 15 in Canada, 16 in Japan, 18 in France, and 20 in
Australia.
Figure 11: National availability of new medicines first launched globally from 2011 to year-end 2019 101
100%
90%
80%
70%
60%
50%
40%
30%
20%
10%
0%
United Germany United Japan France Canada Australia
States Kingdom
Percentage avaiable Percentage available witinin one year of global first launch
It should be noted that the earlier availability of drugs to American citizens applies to virtually every drug
type. For instance, considering the availability of 356 new medicines introduced since 2011, 87 percent are
now available to U.S. patients, compared to 63 percent in Germany, and that trend applies across the board,
from drugs treating cancer on mental illness to those treating rare diseases.
18Figure 12: Comparison of new drug availability since first launch, by therapeutic type, Germany and the United
States 102
100%
90%
80%
70%
60%
50%
40%
30%
20%
10%
0%
United States Germany
Thus, the vast preponderance of evidence suggests that Americans enjoy access to innovative medicines earlier
than citizens in other nations, and that produces tremendous individual and public health benefits. That’s
why drug price control systems that incorporate international reference pricing features would import drug
availability delays every bit as much as they would import lower prices.
According to the European Union's own data from 2012, nearly 600,000 European deaths could be avoided
each year if the continent’s healthcare systems simply offered “timely and effective medical treatments,”
including access to innovative drugs. 103 While that statistic certainly refers to a wide range of missing
therapeutic interventions and public health gaps, it also suggests the costs of not getting innovative drugs to
patients in time to make a difference. The United States shouldn’t allow itself to find itself in the same
position.
Drug Price Controls Undermine Nations’ Biopharmaceutical Industry Competitiveness
The stringent drug price controls other regions and nations, such as the European Union and Japan, have
implemented have seriously harmed the competitiveness of those nations’ biopharmaceutical industries.
For instance, in the early 1990s, European and U.S. companies each held about a one-third share of the
global drug market. But leadership began to shift in the 1990s. By 2004, Europe’s share would fall to 18
percent, while the U.S. share jumped to 62 percent. 104 And from 1990 to 2017, pharmaceuticals R&D
investment in Europe grew 4.5 times, while in the United States, it increased by more than 800 percent. 105 As
Nathalie Moll of the European Federation of Pharmaceutical Industries and Associations (EFPIA) writes,
“The sobering reality is that Europe has lost its place as the world’s leading driver of medical innovation.
Today [January 2020], 47 percent of global new treatments are of U.S. origin compared to just 25 percent
emanating from Europe (2014-2018). This represents a complete reversal of the situation just 25 years
19ago.” 106 As one report explains, “the heart of pharma’s problem in Europe is the market’s inability to “liberate
the value” from its products.” 107
European countries’ extensive use of drug price controls began in earnest in the 1980s and accelerated in the
1990s. By imposing such draconian drug price controls, European regulators have severely disrupted the
economics of innovation in the European life-sciences industry. As the EFPIA explained in a 2000 report,
“Many European countries have driven prices so low that many new drugs can no longer recoup their
development costs before patents expire.” 108 As the report continues, “These policies, most of which seek only
short-run gains, seriously disrupt the functioning of the market and sap the industry’s ability to compete in
the long-run.” As industry analyst Neil Turner wrote in 1999, those policies “set in motion a cycle of under-
investment and loss of competitiveness that’s very difficult to break out of.” 109 While Europe’s drug price
controls certainly lead to lower drug prices and charges that Europe “free rides” off U.S. biopharmaceutical
innovation, one report notes, “Europe’s free ride is not free” and shows that Europe’s drug price controls
actually lead to considerable “social and economic costs in Europe, in the form of delayed access to drugs,
poorer health outcomes, decreased investment in research capabilities, and a drain placed on high-value
pharmaceutical jobs.” 110
2021 research by Schulthess and Bowen confirm that these trends continue today, finding that a 10 percent
drop in the price of medicines in price-controlled European Union markets was associated with a 14 percent
decrease in total venture capital funding (10 percent early stage and 7 percent late); a 7 percent decrease in
biotech patents; a 9 percent decrease in biotech start-up funding relative to the United States; and an 8
percent increase in the delay of access to medicines. 111 As the report observes, “the continued downward
pressures on prices in Europe have led to declines in biopharmaceutical industry investments in the European
Union relative to the United States.” 112 For example, from 2013 to 2019, biotech investments in the United
States increased sixfold even as they remained static in the European Union, while by 2020, the U.S. share of
total annual biotech start-ups was roughly three times greater than the European share. 113
Japan began introducing biennial price controls in the early 1980s, beginning with a steep, across-the-board
reduction of 18.6 percent, with biennial cuts thereafter. As Cardiff University Professor Maki Umemura
explains, “The biennial price reductions had a particularly severe impact on Japanese pharmaceutical firms’
incentives to invest in R&D.” 114 As she continues, “These reductions incentivized Japanese firms to launch a
stream of new drugs with short product life and little innovative value that could recoup the costs of R&D,
rather than invest in more substantial innovation. This hindered the industry’s prospects of launching
breakthrough drugs that would have been more competitive overseas.” 115 That’s because Japan’s severe profit
controls not only limited the potential profits from biopharmaceutical innovation (thus decreasing the
incentive to invest), but they further limited drug company revenues (thus decreasing the ability to invest).
Umemura’s research suggests that drug prices in Japan decreased by as much as two-thirds in the decade from
1981 to 1991. 116
Heather O’Neill and Lena Crain examined the relationship between Japan’s drug prices decreases and drug
innovation in their 2005 report, “The Effects of Price Regulation on Pharmaceutical R&D and Innovation,”
concluding:
20Japan’s government sets prices of new drugs based on older comparator drugs. Recently, price
premiums have been permitted on truly innovative drugs, but even with the premiums in place
the introductory price is not higher than that of older drugs. Following a drug launch, the
government decreases the price as the product matures; the highest price ever received is the first
one. Prices fall by as much as two-thirds from the original price within ten years. The low
introductory prices, coupled with no inflationary price increases, discourage new product
development.117
O’Neill and Crain developed an econometric model to assess the impact of Japanese drug price regulations on
pharmaceutical innovation. As the authors conclude, “the regulations in Japan create an environment that is
not conducive to innovation.” 118 Their econometric model found that, controlling for R&D employment and
time, Japan approved 7.5 fewer new chemical entities (NCEs) than the United States on average in a given
year in the years from 1980 to 2002. 119 Moreover, not surprisingly, Japan’s biopharmaceutical industry has
faltered significantly, with Japan’s share of global value-added in the pharmaceutical industry declining by 70
percent, from 18.5 percent to just 5.5 percent, from 1995 to 2018. 120
In summary, stringent drug price controls have wreaked considerable damage on the European and Japanese
biopharmaceutical industries and would likely do the same to the United States.
BETTER WAYS TO CONTROL DRUG PRICES
Instead of seeking to implement broad-based and steep drug price controls, policymakers should focus on
bolstering the R&D and innovation efficiency of America’s biopharmaceutical system and lowering the costs
seniors pay at the pharmacy counter.
Bolster R&D and Innovation Efficiency
Instead of trying to slash prices on the dubious theory drug companies can make do with lower profits,
lawmakers should turn their attention to the other side of the industry’s ledger—the costs of R&D and
production, especially of large molecule biotech drugs—by spurring the kinds of innovations that can
significantly improve R&D productivity and production process efficiency. 121 Indeed, capitalizing on new
technologies to lower the cost of drug innovation and production is the only viable way to achieve what
everyone wants—a long-term trend toward producing more cures (and more ancillary economic benefits) at
less cost.
Promisingly, a new slate of technologies including artificial intelligence (AI), “big data,” CRISPR gene
editing, nanotechnology, and biologics manufacturing is transforming how new drugs are discovered,
developed, clinically tested, and produced. 122 In particular, data-driven innovation promises to transform
many aspects of medicine. In the pharmaceutical industry, better access to data can improve drug discovery,
clinical review, testing, and post-market monitoring. However, these benefits require access to massive
amounts of data from many people. Congress could ease drug discovery by appropriately loosening data
restrictions in the health care market, especially because current federal policy makes the sharing of data
difficult, even de-identified data individual patients are eager to share in order to help find a cure.
In order to facilitate this improved drug discovery, policymakers should enforce the publication of data from
clinical trial results by directing agencies such as the FDA and NIH to be more aggressive about penalizing
21You can also read