The Character Factor: Measures and Impact of Drive and Prudence - Richard V. Reeves, Joanna Venator, and Kimberly Howard
←
→
Page content transcription
If your browser does not render page correctly, please read the page content below
The Character Factor:
Measures and Impact
of Drive and Prudence
Richard V. Reeves, Joanna Venator, and Kimberly Howard
October 22, 2014
Abstract
      There is growing interest among psychologists and economists in the importance
      of ‘non-cognitive’ skills for doing well in life. In this paper we assess the quality of
      measures available in US survey data for two specific non-cognitive skills, drive
      and prudence, which we term “performance character strengths” – non-cognitive
      skills that relate to outcomes important for economic mobility, such as educational
      attainment. We evaluate and rank the measures of drive and prudence found
      in these surveys, categorizing them as broad or narrow, and indirect or direct.
      Next, we use one of these measures (the BPI-hyperactivity scale in the NLSY) to
      look at socioeconomic gaps in performance character strengths, and the relative
      importance of performance character strengths for educational attainment. We find
      that family income and maternal education are positively associated with higher
      levels of performance character strengths, and that the influence of the measure
      on educational attainment is comparable to the influence of academic scores.

CENTER ON CHILDREN AND FAMILIES | THE CHARACTER & OPPORTUNITY PROJECT                            2
Table of Contents
1. Introduction X
2. Why Care About Character? X
X
3. How Much Do Drive and Prudence Matter?
X
3.1 Drive: Existing Evidence
X
3.2 Prudence: Existing Evidence
4. Class Gaps in Performance Character Strengths X
5. Evaluating Measures & Data X
5.1 Measurement Approaches X
i. Surveys X
ii. Behavior X
iii. Tests X
X
5.2 Options for Measuring Character Strengths in US Datasets
6. Estimating the Impact of Character Strengths for Life Outcomes X
6.1 An Early Measure of Performance Character X
6.2 The Link Between Character Strengths and Outcomes X
Conclusions X
CENTER ON CHILDREN AND FAMILIES | THE CHARACTER & OPPORTUNITY PROJECT 31. Introduction
A growing body of empirical research demonstrates that people who possess certain character
strengths do better in life in terms of work, earnings, education and so on, even when taking into
account their academic abilities. Smarts matter, but so does character.
This is hardly a revelation: most of us would think it a matter of common sense that being able
to work hard, defer gratification, or get along with others will help somebody to do well in the
labor market, school, family and community. Why the interest now? Three reasons: First, there
is more concrete evidence for our intuition that character matters, thanks to the work of Jim
Heckman, Angela Duckworth, Carmit Segal and others, summarized in Paul Tough’s recent
book, How Children Succeed: Grit, Curiosity and the Hidden Power of Character. Second, this
evidence suggests that character skills may count for a lot – as much, perhaps, as cognitive
skills – in terms of important life outcomes. Third, given their proven importance, it seems to
many observers (including ourselves) that too little attention is paid by policy-makers to the
cultivation and distribution of these character skills. For a longer treatment of this last point, see
our accompanying piece “The New Politics of Character” (originally published in National Affairs,
Reeves, 2014b).
We need to be clear what we are talking about. For many years, the preferred scholarly ter-
minology among economists has been ‘non-cognitive’ skills – in other words, every skill not
captured by cognitive tests. ‘Non-cognitive’ is now a term that almost nobody likes but almost
everyone uses. The problem is that it is too broad, lumping together a very wide range of skills,
traits and attributes – from stable aspects of personality through to everyday social skills.
In this paper, we:
i) Motivate an interest in character strengths from an equality of opportunity perspective
ii) Sketch existing evidence for the impact of drive and prudence for life outcomes
iii) Describe the distribution of character strengths by socioeconomic background
iv) Evaluate existing datasets and measures of character strengths
v) Estimate the influence of one measure of character strengths in the early and middle
childhood years for educational and other outcomes
2. Why Care About Character?
An important distinction can be drawn between performance and moral character. Performance
character refers to “those qualities needed to realize one’s potential for excellence – to develop
one’s talents, work hard, and achieve goals,” while moral character consists of “those qualities
needed to be ethical – to develop just and caring relationships, contribute to community, and
assume the responsibilities of democratic citizenship”(Character Education Partnership, 2008).1
1 This paper’s expanded view of character as including moral and performance character builds on work
first presented in Thomas Lickona and Matthew Davidson’s Smart & Good High Schools, jointly published
by the Center for the 4th and 5th Rs and the Character Education Partnership in 2005 with major funding
from the John Templeton Foundation.
CENTER ON CHILDREN AND FAMILIES | THE CHARACTER & OPPORTUNITY PROJECT 4Of course the distinction is far from clear-cut, and many scholars argue that the distinction is arbitrary and/or unhelpful (see Mead, Etzioni, Sawhill and Berkowitz in the accompanying essay collection for differing views). For the sake of the current paper, however, we focus explicitly on performance character. Even so, there are a wide range of definitions and frames and considerable variation in terminology between disciplines. The key is to be as clear as possible. Psychologists would describe the student who always shows up to class on time and studies hard as conscientious; other similar or related labels might be having grit, persistence, or resilience. Conscientiousness, one of the Big Five dimensions of personality, captures a person’s tendency to be controlled, goal-directed, and able to delay gratification. And so even this single item is quite broad the top researchers on conscientiousness describe the term as “somewhat broad and ambiguous in meaning…better suited to represent the family of traits” (Roberts et al., 2009). At the forefront of research on performance character is Angela Duckworth, a psychologist at the University of Pennsylvania, who focuses on two specific traits: grit, the tendency to stick with long-term goals, and self-control. She and a team of researchers have designed a grit scale based on a self-report survey, which highly correlates with other measures of character such as conscientiousness. In one study (Duckworth, Peterson, Matthews, and Kelly, 2007), West Point entrants scoring highly on the grit scale were 60 percent more likely to complete the tough summer training then those who were not. Duckworth and colleagues have also more recently begun examining self-control and regulation among school-aged children in studies that look at domain-specific self-control behaviors (Tsukayama, Duckworth, and Kim, in press). For the remainder of the paper, we will focus on variations of these two character strengths which appear to be especially important for individual academic and economic success: the ability to work hard even when faced with challenges and the ability to choose tomorrow over today. 2 These capture a person’s orientation towards task and towards time, respectively. Labels for the two vary across academic disciplines and between different researchers. We describe them as ‘drive’ and ‘prudence.’ People with drive are able to stick with a task, even when it gets boring or difficult; they work hard and don’t leave a job unfinished. Drive includes not just the ability to work hard (industriousness) but also the ability to overcome setbacks and to keep going (resilience). Prudent people are able to defer gratification and plan for the future; they can make sacrifices today in order to ensure a better tomorrow. The better developed a person’s character strength 2 A note on terminology: We use the term ‘character strengths’ for the remainder of the paper rather than traits, attributes, or skills. This question of terminology is not an entirely trivial question. A character ‘trait’ implies a fairly permanent feature of an individual’s makeup, analogous to a personality trait such as optimism or introversion, while a ‘skill’ can be learned, perhaps quite quickly. The question is whether we are referring to a skill a person acquires, or to an essential aspect of that person? Under the character umbrella, different attributes will lie at different points on this spectrum. It is hard to learn kindness, somewhat easier to learn self-control. The elements of character that matter most for mobility lie somewhere between semi-fixed ‘traits’ and straightforwardly-acquired ‘skills.’ We therefore adopt the term character strength. Strength implies greater depth than ‘skill,’ but greater malleability than ‘trait.’ CENTER ON CHILDREN AND FAMILIES | THE CHARACTER & OPPORTUNITY PROJECT 5
of prudence, the less they suffer from what economists call ‘present bias,’ the tendency to
under-weight future utility. They can both plan for the future and exert self-control in the moment
to reach their long-term goals.

Table 1: Drive and Prudence

3. How Much Do Drive and Prudence Matter?
3.1 Drive: Existing Evidence

That drive matters for academic and economic success is a plausible intuition. A student who
abandons a paper when it gets challenging is unlikely to get a good grade. An employee who
never shows up to work on time is unlikely to get promoted. But what’s the empirical evidence?
Duckworth’s grit scale, which worked so well at West Point, also strongly predicts a whole range
of academic outcomes, even including National Spelling Bee rankings (Duckworth et al., 2007).

Character strengths may be important for understanding – and closing – one gap that matters
a great deal for opportunity: the one between starting college and finishing college. Only six
of every 10 students (59 percent) who entered a 4-year degree-granting institution in 2005
graduated with a bachelor’s degree within 6 years. At 2-year institutions, only 3 of every 10
students who entered completed a credential within 3 years. In contrast to college enrollment,
which grew by 32 percent from 2001 to 2011 (from 15.9 million to 21.0 million), rates of
completion have been growing slowly (e.g., 55 percent of students who entered a 4-year
degree-granting institution in 1996 graduated with a bachelor’s degree within 6 years). The
college challenge is a completion challenge, not an enrollment challenge.

Drive appears to be related to college completion. High school GPA, which captures both
drive and cognitive skill, predicts six-year graduation rates above and beyond an individual’s
SAT or ACT scores, which only capture the cognitive side. Whereas a one standard deviation
improvement in test scores is associated with a 2 percentage point greater likelihood of
graduating college in six years, a one standard deviation improvement in high school GPA
is associated with more than a 6 percentage point greater likelihood of graduating (Bowen,
Chingos, and McPherson, 2009).

The character strength of drive also appears to influence earlier educational attainment.

CENTER ON CHILDREN AND FAMILIES | THE CHARACTER & OPPORTUNITY PROJECT                             6
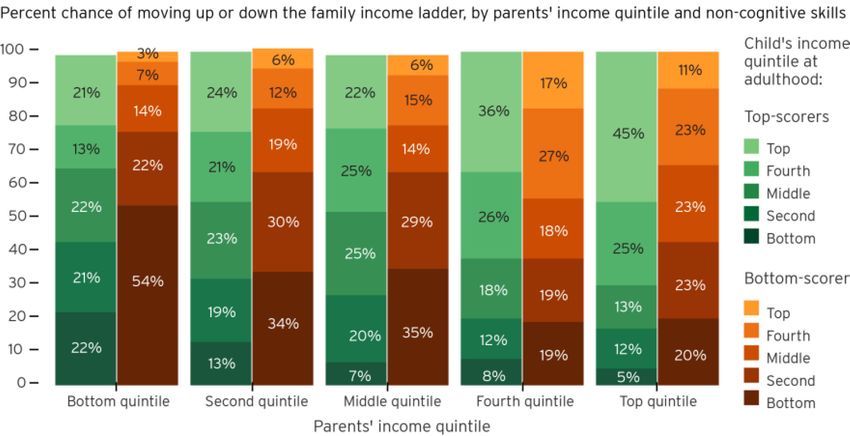
Heckman and Rubinstein (2001) found that GED recipients do much worse than traditional high
school graduates in terms of further educational attainment, earnings, and employment, even
though they score just as well on achievement tests. Heckman argues convincingly that the
GED route captures students who are smart enough to graduate high school but do not possess
the character strengths to stick it out to graduation, which hurts them in other areas of life as
well (Heckman, Humphries, and Kautz, 2014).3

Research using other measures that seem to capture drive has also identified effects on
college attendance and completion. Collin Hitt and Julie Trivitt, researchers from the University
of Arkansas, found that the more questions left unanswered on a survey – instances in which
participants responded “I don’t know” or left it blank – the less likely that the respondent
would enroll in college (Hitt and Trivitt, 2013). The idea that non-response to survey questions
captures some element of character is a new and intriguing one, which could open up some
new empirical options. The justification offered by Hitt and Trivitt is quite compelling: Surveys
are long and boring. Despite volunteering to participate, respondents may lose interest or focus.
Nonetheless, most individuals in these samples are answering all or almost all of the eligible
questions. For example, in the National Longitudinal Survey of Youth 1997 (NLSY97), an
average respondent answers 96 percent of the questions (Hedengren and Stratmann, 2012). A
large percentage of questions left blank or answered with “Don’t Know” could signal someone
who comparatively lacks drive.

Some of the best evidence for the importance of drive has been generated using the Coding
Speed test, which forms part of the Armed Services Vocational Aptitude Battery (ASVAB). It is
very easy, but very dull; and it turns out to capture something important about an individual,
which is the ability to stick with an intrinsically unrewarding task (Segal, 2012). Scoring one
standard deviation higher on the coding speed test is associated with an increase of 9.5
percent in earnings over twenty years later, controlling for cognitive ability as measured by their
performance on other sections of the ASVAB (Segal, 2012). In earlier work, we found that high-
scorers on the coding speed test have higher levels of upward intergenerational income mobility
(Reeves and Howard, 2013). Roughly a third of adolescents from the bottom income quintile
but scoring in the top third on coding speed make it to the top-two fifths of the income quintile
as adults. In contrast, only one in ten of those from the bottom income quintile who score in the
bottom third on coding speed make into one of the top two income quintiles.

3 Another study looked at four measures thought to capture effort (middle school grades, hours spent
on homework, disciplinary incidents, and grade retention) and found that a composite measure of non-
cognitive skills predicted a student’s probability of enrolling in college by as much as socio-economic
status and cognitive ability (Jacob 2002).

CENTER ON CHILDREN AND FAMILIES | THE CHARACTER & OPPORTUNITY PROJECT                                     7
Figure 1: Drive and Mobility

Source: Figure 4b from Reeves, Richard V., and Kimberly Howard. 2013. “The Glass Floor: Education, Downward
Mobility, and Opportunity Hoarding.” Washington, DC: Brookings Institution.

3.2 Prudence: Existing Evidence

It is also intuitively clear why the character strength of prudence would matter for life outcomes.
Someone only interested in today is less likely to choose homework over a party or hard work
over surfing the internet. Someone who puts little value on the future is less likely to save. By
traditional measures of success, then, who might under-perform compared to their more prudent
peers.

There is a long research literature on the importance of self-control, or the ability to defer
gratification – a close corollary of our conceptualization of the character strength of prudence.
The most famous study in this area is the marshmallow test designed by Walter Mischel in the
late 1960s. He tested the ability of four-year olds to resist a marshmallow, with the promise of
getting an extra one if they waited. The longer toddlers were able to wait, the higher their SAT
scores and earnings later in life.

The simplest interpretation is that children who can delay gratification do better in school and
in life. Follow-up studies have added interesting twists to the main findings, however. First,
if children are trained in ‘resistance techniques,’ such as putting an imaginary picture frame
around the marshmallow or visualizing it as a cloud, they are able to wait much longer (Mischel
and Baker 1975; Moore, Mischel, and Zeiss, 1976; Mischel, Shoda, and Rodriguez, 1989).
Second, the reliability of the reward for exhibiting self-control matters. Researchers from the
University of Rochester re-ran the marshmallow test in 2012, but added an additional frame.
Before the main trial, they gave the four year-olds some old crayons, but said if they could wait

CENTER ON CHILDREN AND FAMILIES | THE CHARACTER & OPPORTUNITY PROJECT                                         8
a few minutes, some new ones would be provided. Half of them got new crayons; the other half
got an apology and a request to make do with the original ones. Kids who got the new crayons
waited, on average, four times as long (12 minutes) for a second marshmallow, as those who
did not (Kidd, Palmeri, and Aslin, 2012).

Research on the importance of impulse control to success is not limited to the marshmallow
test, of course. In one study, participants in the National Longitudinal Survey of Youth 1979
(NLSY79) who were identified as impatient or restless during their interview were found to be 55
percent more likely to drop out of high school than those who were not judged by the interviewer
as impatient or restless. They also earned 13 percent less by middle age, on average (Cadena
and Keys, 2014).

Both self-reported and parent-reported levels of self-control during childhood predict higher
achievement in school. Duckworth and Seligman (2005) found that self-discipline of 8th grade
students, measured by a combination of self-reports, parent reports, teacher reports, and
questionnaires on temporal money tradeoffs, predicted student grades and achievement test
scores more strongly than IQ. In 2010, Duckworth published a paper attempting to control the
findings for other time-varying variables that could confound this observed relationship between
self-control and achievement, such as self-esteem. The results bolstered the original findings:
while changes in self-control at one point in time predicted changes in GPA at a later date, the
opposite was not true (Duckworth, Tsukayama, and May, 2010).

The character strength of prudence is also very predictive of other life outcomes besides
education and earnings that we consider important. For example, prudent individuals are more
likely to exhibit healthy behavior, which has obvious long-term consequences. ‘Future-oriented’
adults, measured in the PSID scale, have a 17 percent greater likelihood of exercising than
those who are not future-oriented, for example (Chiteji, 2010).

In a study of 1,000 children in New Zealand, children with greater self-control, as measured by
a combination of reports by the researcher, teachers, parents, and self-report from age 3 to 11,
were healthier, richer, less likely to be single parents, and less likely to be convicted of a crime
as adults, controlling for childhood social class and IQ. And these differences were big: children
in the highest fifth of the sample on measured self-control had crime conviction rates of 13
percent versus children in the lowest fifth who had crime conviction rates of 43 percent (Moffitt
et al., 2011).

Drive and prudence contribute to higher earnings, more education, better health outcomes
and less criminal behavior. We can also easily imagine that they are important for marriage,
parenting, and community involvement. Individuals benefit from the ability to persevere,
overcome setbacks, and plan ahead in all of these domains.

4. Class Gaps in Performance Character Strengths
If character strengths significantly impact life outcomes, disparities in their development may
matter for social mobility and equality. As well as gaps in income, wealth, educational quality,
housing, and family stability, are there also gaps in the development of these important

CENTER ON CHILDREN AND FAMILIES | THE CHARACTER & OPPORTUNITY PROJECT                                  9
character strengths? Relatively little research has been done on the distribution of character
strengths or non-cognitive skills across the income distribution or by class. But what evidence
that exists suggests quite marked gaps.

As with cognitive skills, gaps in non-cognitive strengths open up at an early age and persist
throughout an individual’s life. For example, gaps between poor and non-poor infants in
behaviors such as paying attention to tasks, adapting to changes in materials, and displaying
social engagement are visible as early as nine months of age and widen by the age of two
(Halle et al., 2009):

Figure 2: Very Early Non-Cognitive Gaps

When entering kindergarten, children from low-income families do worse on school-readiness
measures of learning-related behaviors (e.g., paying attention) and externalizing behaviors
(e.g., disrupting others) than moderate or high income children (Isaacs, 2012):

CENTER ON CHILDREN AND FAMILIES | THE CHARACTER & OPPORTUNITY PROJECT                             10
Figure 3: Ready for School?

Source: ECLS-B, Julia Isaacs.

Measures of non-cognitive strengths in the school years show a strong relationship to family
income:

Figure 4: Fifth Grade Gaps in Non-Cognitive Scores by Family Income

Source: ECLS-K, data supplied by Jason Fletcher.

CENTER ON CHILDREN AND FAMILIES | THE CHARACTER & OPPORTUNITY PROJECT                          11
Finally, our own research (Reeves and Howard, 2013) finds gaps by family income in a
commonly used measure of drive or persistence, the coding speed section of the NLSY (see
below for more details):

Figure 5: Coding Speed Scores by Family Income Quintile

Source: NLSY, Brookings calculations.

5. Evaluating Measures & Data
There are no widely accepted tests for character strengths equivalent to the IQ test for cognitive
skills. There is no such thing as a Character Quotient score. So how do we capture the skills
that traditional knowledge tests don’t measure but that also matter for school and job success?
Such measures matter for researchers of course. But they may also be important to parents,
schools, and employers. KIPP, a highly-successful national network of charter schools, recently
introduced character report cards, based on the Peterson and Seligman classification of
strengths, to encourage conversations among parents, teachers and students about character
development.4

5.1 Measurement Approaches

There are three principal approaches to measuring character strengths: surveys, behavior, and
tests (see Table 2):

4   One of the authors, Kimberly Howard, is now an employee of KIPP DC.

CENTER ON CHILDREN AND FAMILIES | THE CHARACTER & OPPORTUNITY PROJECT                           12
Table 2: Measuring Character Strengths

i) Surveys

The most straightforward measurement approach is simply to ask people about their own
character strengths. We might be skeptical of how accurately people will rate themselves, but it
turns out that people are quite good at assessing their own character. As discussed previously,
Angela Duckworth and colleagues’ grit scale (2007) is based on a self-report survey and in their
study of West Point graduates, the grit scale had more predictive power than IQ score, GPA, or
the military’s own readiness scale. Nonetheless, there are obvious drawbacks to relying on an
individual’s self-perception: for one thing, a degree of honesty – a ‘moral’ character strength! –
will be required on the part of the respondent.

A related approach is to survey people in a position to provide an assessment of an individual’s
character strengths, such as a teacher or parent. An advantage is that an observer may be
more objective about an individual’s character strengths than the individual themselves; a
disadvantage is that biases of various kinds may come into play. Third party surveys must also
be seen in context: it is possible, for example, that character strengths demonstrated at school
may not be the same as those on display at home, or vice versa.

ii) Behavior

An alternative measurement approach is to look at what people do, rather than what they say.
Real-world behaviors, such as saving or risk-taking, can be seen as proxies for character.
As well as using more direct measures of character strengths, Jim Heckman and colleagues
(2014) analyze an array of adolescent behaviors, including illegal activity, regular drinking, daily
smoking, and sexual activity as markers of character strengths.

Of course, there are other factors influencing these behaviors besides character strengths, such
as peer norms, family expectations, and perceived prospects. The danger in using behavior as

CENTER ON CHILDREN AND FAMILIES | THE CHARACTER & OPPORTUNITY PROJECT                              13
a proxy for character strengths is that we may attribute too much to the individual rather than his
or her environment and context.

iii) Tests

Finally, character strengths might be captured by measures of how individuals perform on
certain tests, which are conducted in a controlled environment, rather than in the real world.
For example, a test might capture impulse control by asking individuals to respond to a target
stimulus while ignoring all other stimuli. The upside of this method is that it can help to control
for differential social and economic contexts, but this is also a potential downside, because it is
possible that the individual will behave differently in a real-world context, where it really matters.

Some other tests have proven to be potentially useful yardsticks of character strengths, even
though this was not their original purpose; a good example is the ‘coding speed’ test and non-
response rates in the ASVAB discussed above. Indeed, the researchers also have found that
non-response rates were associated with the more traditional measure of conscientiousness,
in the expected direction. Individuals with higher response rates on surveys, that is, those who
rarely refuse to respond to a question or answer “Don’t Know,” earn more (Hedengren and
Stratmann, 2012).

5.2 Options for Measuring Character Strengths in US Datasets

We have identified two character strengths that seem particularly important in terms of social
mobility (drive and prudence) and three basic approaches to measurement (surveys, behavior,
and tests). But getting a better sense of how these two strengths develop, how they are
distributed, and how much they matter, means finding adequate data sources. In our search for
data sources, we adopted the following requirements, in order of priority:

         1. United States sample. Especially when exploring how character develops, we know
             that context matters a lot. There are innumerable distinct cultural and social
             contexts within the United States, but there are also important similarities, including
             national values and federal policy.
         2. A large sample size. This is especially important for hard-to-measure concepts like
              character where there is bound to be error in measurement.
         3. Tracking the same individuals over time. To see how character develops and whether
              it matters, we need to see how character strengths in earlier life stages relate to
              outcomes in later life stages.
         4. Observing individuals as children or adolescents. To assess intergenerational mobility,
             we are particularly interested in how character strengths developed before reaching
             adulthood impact on adult outcomes.
         5. Containing a measure of drive and/or prudence. (Note: The measure does not
             necessarily need to be an intentional measure of drive or prudence.)
         6. Including measures of family background. Ideally, we want to be able to observe how
              one does in life compared to where one started in terms of income rank or social

CENTER ON CHILDREN AND FAMILIES | THE CHARACTER & OPPORTUNITY PROJECT                               14
class, and how far character strengths influence this intergenerational mobility. The measures contained in the datasets examined are varied and not all are equally valuable for measuring drive and prudence. The ideal data source will be one that both directly and specifically measures a particular character strength –a good example is the grit scale developed by Duckworth and discussed above. Similarly, a series of questions in one large survey, the Panel Survey of Income Dynamics (PSID), asked in the late 1960s and early 1970s were designed to measure how much individuals plan ahead, save for the future instead of spending money as they earn it, or think a lot about things that might happen in the future. This measure is direct; the questions ask about their orientation toward the future. It is also fairly narrow; it is specifically geared towards observing an individual’s future orientation. For a comprehensive list of potential data sources and related studies, see Table 4. For each data source, we provide a ranking (from 1 to 3 stars) according to directness (how directly it measures the character strength) and specificity (how broadly or narrowly it measures the character strength). See Table 3 for examples. Direct, narrow measures are ranked with three stars. Reports of disciplinary problems, in contrast, receive a one-star ranking, since they are both indirect (we have to infer from reported behavior that the student lacks self-control) and broad (disciplinary problems can reflect a whole host of other variables besides impulse control). While far from ideal, such reports may still be useful for measuring character strengths, controlling for other observable characteristics of the individual. Table 3: Rating Measures of Character CENTER ON CHILDREN AND FAMILIES | THE CHARACTER & OPPORTUNITY PROJECT 15
Table 4: Measures of Character Strengths in US Datasets

 CENTER ON CHILDREN AND FAMILIES | THE CHARACTER & OPPORTUNITY PROJECT   16
CENTER ON CHILDREN AND FAMILIES | THE CHARACTER & OPPORTUNITY PROJECT 17
CENTER ON CHILDREN AND FAMILIES | THE CHARACTER & OPPORTUNITY PROJECT 18
CENTER ON CHILDREN AND FAMILIES | THE CHARACTER & OPPORTUNITY PROJECT 19
As our evaluation shows, there are few major US datasets with high quality measures of drive
or prudence. The PSID, the Fragile Families survey, and the various iterations of the NLSY
have the best measures of these character strengths, but even their measures are inexact. In
contrast, all the major US datasets all contain accepted measures of cognitive skills: math and
reading subject tests, the Armed Forces Qualification Test, IQ tests, and so on. Searching for
measures of character strengths is much more of a challenge. Few of the commonly used US
longitudinal datasets contain items that measure character strengths both directly and narrowly,
although many have some measures that can cast some light on the question. In terms of
data, scholars working on the non-cognitive side of the equation are the poor cousins to those
researching cognitive skills. As interest in character strengths grows, we need to continue to
develop better methods for measuring drive and prudence. This is not an easy task, but it is
a necessary one. Understanding the importance of character strengths has implications for
what parents focus on in the home, what teachers strive to impart in the classroom, and what
individuals value and develop in themselves.

6. Estimating the Impact of Character Strengths for Life Outcomes
In addition to evaluating the quality of measures of performance character strengths, it is also
important to understand how we should incorporate them into the discussion about social
mobility, educational attainment, and labor market success. As a large body of research
spearheaded by James Heckman and colleagues shows, cognitive skills cannot explain
all of the gaps in educational attainment (Heckman, Pinto and Savelyev, 2012; Heckman
and Rubinstein, 2001). As such, we want to look at the contribution of drive and prudence
to educational attainment and compare its relative importance to comparable measures of
cognitive skills.

For our analysis, we use the data set derived from the Social Genome Model (SGM) to give
us a sense of the importance of character strengths. The model includes outcomes for these
children at age 29 and 40, simulated using the older cohort of the National Longitudinal Survey
of Youth. Children of the SGM data set were mostly born in the 1980s and 1990s. This allows us
to estimate the effects of measures observed in early childhood (our measure of drive/prudence,
described below and measures of math and reading scores in early and middle childhood) on
outcomes in adolescence and adulthood. For more on the composition of the SGM dataset, see
Winship and Owen (2013).

6.1 An Early Measure of Performance Character

Based on our evaluation of survey measures above, we have selected a measure that we
think captures both drive and prudence throughout childhood, the hyperactivity subscale of the
Behavior Problems Index (BPI) which is derived from a well-known and validated measure, the
Child Behavior Checklist, on which mothers rate their child’s typical behavior from the past three
months.5 The BPI was developed for the National Longitudinal Survey of Youth 1979: Children

5 It should be noted that this scale, despite being named a ‘hyperactivity’ scale, certainly does not
necessarily indicate that a child is medically hyperactive (that is, has a diagnosis of attention-deficit
hyperactivity disorder). In this sense, the terminology here is unhelpful.

CENTER ON CHILDREN AND FAMILIES | THE CHARACTER & OPPORTUNITY PROJECT                                       20
and Young Adults, and is one of the most frequently used of its child assessments. The mother’s
report is captured in early childhood, around age 5 or 6, and in middle childhood, around age 10
or 11. A disadvantage of the scale is the reliance on mothers’ reports; an advantage is that its
availability in the large NLSY dataset also allows our analysis to incorporate and allow for a wide
range of other variables.
The five items on this scale capture the strengths that we are especially interested in for a
child’s academic and economic success, namely, a child’s ability to persist in and concentrate
on a task (drive) and the ability to control impulses and think before acting (prudence).
Specifically, the mother rates the following statements about her child as “not true,” “sometimes
true,” or “often true”:
• Has difficulty concentrating/paying attention
• Is easily confused, seems in a fog
• Is impulsive or acts without thinking
• Has trouble getting mind off certain thoughts
• Is restless, overly active, cannot sit still
The average child in NLSY is rated as sometimes or often displaying two of these behaviors,
both at age 5/6 and age 10/11. About 16 percent of children in early childhood and 17 percent
in middle childhood, however, are rated as sometimes or often displaying four or five of these
behaviors. These children are the ones struggling to develop important strengths, especially the
ones we describe as drive and prudence.
In order to assess the importance of the strengths captured by the scale, we ranked children as
having ‘low skills’ (lower than 1 SD below average on the hyperactivity scale), ‘middling skills’
(between 1 SD below and 1 SD above average on the hyperactivity scale), or ‘high skills’ (higher
than 1 SD above average on the hyperactivity scale). See Table 5 for a breakdown of what
portion of the sample falls into each category.
Table 5: Low, Medium, and High Scores on BPI Measure
Next, we created a composite measure of performance character strengths, describing children
as ‘Always Low’ (with low skills in early and middle childhood), ‘Sometimes Low’ (low skills in
one period), ‘Always Middle’ (middle skills in both periods), ‘Sometimes High’ (high skills in one
period), and ‘Always High’ (high skills in both periods). There is a very small overlap – about two
percent of the sample – between the ‘Sometimes Low’ and ‘Sometimes High’ categories, made
up of children who had high skills in one period and low skills in the other. (For the purposes of
our analyses using the composite measure, we exclude these children). Table 6 shows how our
sample breaks down into the different categories of the composite measure.
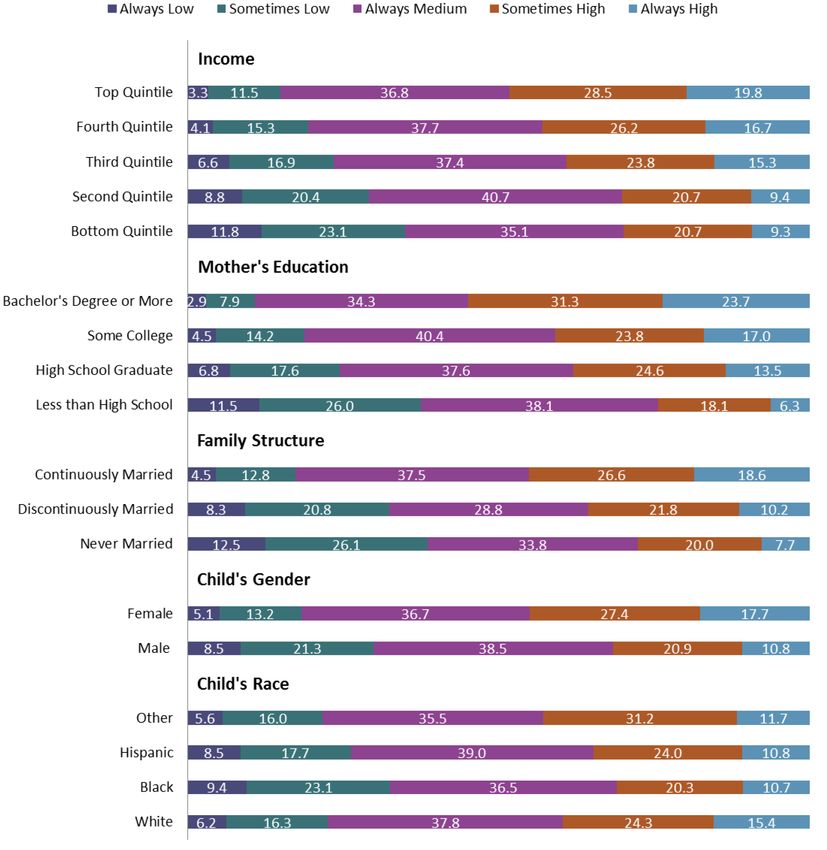
CENTER ON CHILDREN AND FAMILIES | THE CHARACTER & OPPORTUNITY PROJECT 21Table 6: Composite Measure: Low, Medium, and High (BPI Measure) If we look at the demographic breakdown of scores on our composite measure, we see gaps by socioeconomic status, mirroring gaps seen in other studies. Scores on composite measure of the Behavioral Problems Index we developed for our analysis of education outcomes (see above) is not evenly distributed across the population. Children born in the households in the lowest fifth of the income distribution are almost four times as likely to be in the ‘always low’ category as those from households in the top fifth. Similar patterns can be seen at the other end of the income distribution, and for maternal education levels, as Figure 6 shows. To see which background factors matter most for the development of character, we examined the influence of demographic variables on the chances of being in the ‘always low’ group for behavioral problems, controlling for other variables (see Figures 8 and 9). Descriptively, there are four things to note here. First, girls perform more strongly than boys on the index, regardless of other factors, in both early and middle childhood. Second, race does not seem to be a strong factor once controls are added – indeed, in the early years, there appears to be a positive influence from being in the ‘other’ race category. Third, teenage motherhood has a strong effect in the early years, but not in the middle years. Lastly, and perhaps most importantly, children from more disadvantaged backgrounds are more likely to score poorly on the BPI measure, even controlling for other family characteristics. Children born in the bottom quintile, for example, are 6.2 percentage points more likely to score poorly on the hyperactive scale in early childhood compared to children born in the middle quintile. Maternal education is also an important factor. The children of mothers without a high school degree are 6.5 percentage points more likely to score poorly than children of mothers with a high school degree in the early years, while the children of college graduates are 7.1 percentage points less likely to be in the ‘low’ category. The effects of disadvantaged circumstances appear to be larger in early childhood than in middle childhood. CENTER ON CHILDREN AND FAMILIES | THE CHARACTER & OPPORTUNITY PROJECT 22
Figure 6: Demographics of Non-Cognitive Skill Levels, Composite Measure

CENTER ON CHILDREN AND FAMILIES | THE CHARACTER & OPPORTUNITY PROJECT     23
Figure 7: What Factors Are Associated with Low Scores for Character Strengths (Early Years)?

CENTER ON CHILDREN AND FAMILIES | THE CHARACTER & OPPORTUNITY PROJECT                                 24
Figure 8: What Factors Are Associated with Low Scores for Character Strengths (Middle Years)?

CENTER ON CHILDREN AND FAMILIES | THE CHARACTER & OPPORTUNITY PROJECT                                  25
6.2 The Link Between Character Strengths and Outcomes

How much does this measure of performance character affect life outcomes? To address this
question, we first ran some simple regressions (without any controls) of four different success
measures on our measure of character strength. This shows the percentage of children at
different strength levels (low, medium and high, as defined above) who succeed in terms of
graduating high school with decent grades, turning twenty without an arrest record, turning
twenty without a pregnancy, and graduating college.

Figure 9 shows the percent of children scoring at the different levels on the BPI scale at age 5/6
who succeed on the key success benchmarks, drawn from the Social Genome Model for the
adolescent period:

Figure 9: Character Strengths in the Early Years and Key Outcomes

CENTER ON CHILDREN AND FAMILIES | THE CHARACTER & OPPORTUNITY PROJECT                             26
Figure 10 shows the same measures for children based on their BPI scores in middle childhood
(i.e., around the ages of 10 to 11):

Figure 10: Character Strengths in the Middle Years and Key Outcomes

CENTER ON CHILDREN AND FAMILIES | THE CHARACTER & OPPORTUNITY PROJECT                     27
Figure 11 shows success rates against these metrics for the composite BPI score for middle and
early childhood:

Figure 11: Character Strengths Composite Mesaure and Key Outcomes

On the basis of these results, the effects of character strengths as captured by the BPI scale
seem clear. But these are simple tabulations, not taking into account other factors likely to
be strongly related to both the development of these strengths and other outcomes. The real
question is how much these characters strengths matter independently?

To cast some light on this question, we regressed our educational outcomes on our composite
measure from the BPI and a set of controls (mother’s education, marital status, age at birth,
cognitive skills, and parenting quality; family income; race; math and reading skills in early and
middle childhood; teenage parenthood).

CENTER ON CHILDREN AND FAMILIES | THE CHARACTER & OPPORTUNITY PROJECT                                28
Those with low BPI scores in both periods are less likely to graduate high school with a good
GPA (35 percent less compared to those with middling skills in both periods), while those
with high skills in both periods are more likely to graduate (67 percent more likely). Later life
outcomes have an asymmetric relationship with our BPI measure. The likelihood of graduating
college is significantly related to having high non-cognitive skills: those with ‘always high’ skills
in early childhood are 33 percent more likely to graduate college than those with middling skills.
But there was no significant effect from a low BPI score, once other factors were taken into
account.

Even when adding controls for other factors, then, the development of character strengths in
early and middle childhood is statistically significantly related to later educational outcomes,
especially in adolescence.

There is still a question of the scale of impact, however, especially against the effects of
cognitive scores. We therefore compared the effects of reading or math skills in early and middle
childhood with the effects of the BPI scores.6 Those with the strongest math skills across those
two periods (i.e., those who had math skills more than 1 SD above average in both periods)
were significantly more likely to graduate high school with at least a 2.5 GPA (53 percent more
likely), although there was no negative effect for those with the weakest math skills (i.e., less
than 1 SD below average in both periods). Those with the strongest reading skills were more
than twice as likely to graduate high school with a 2.5 GPA (113 percent more likely), while
those with the weakest reading skills across the two periods were less likely to graduate with a
good GPA from high school (30 percent less likely).7

6 Math and reading skills were measured in early and middle childhood and standardized with a mean
of 0 and SD of 1, similar to the BPI scale. To create composite measures of reading skills and math skills,
we followed the same method as for non-cognitive skills: In each period, a child was characterized as low
(math/reading skills less than 1 SD below average), medium (math/reading skills between 1 SD below
average and 1 SD above average), or high (math/reading skills above 1 SD above average). Then, each
child was categorized as always low, sometimes low, always middle, sometimes high, and always high,
as was done for non-cognitive skills. 6.1 percent of children had always low math scores and 7.2 percent
had always high math scores. 6.8 percent of children had always low reading scores and 5.2 percent had
always high reading scores.
7 The proportion of the sample with always high reading skills and the proportion with always high math
skills are smaller than the proportion with always high non-cognitive skills. As such, we would expect
that the impact of being high in cognitive skills could potentially be exaggerated compared to the impact
of being high in non-cognitive skills. This may be the case for the particularly large effect of high reading
skills on high school graduation. If we instead look at those who score always high or sometimes high on
reading, which makes up the top 16.2 percent of the sample, we find that being always or sometimes a
high scorer increases the likelihood of graduating high school with a good GPA by only 42 percent.

CENTER ON CHILDREN AND FAMILIES | THE CHARACTER & OPPORTUNITY PROJECT                                      29
Figure 12: Drive and Prudence Matter as Much as Book Smarts for HS Graduation

On the basis of this analysis, it looks as though the influence of the character strength scores is
comparable to the influence of the academic scores: it is, at the very least, in the same ballpark.

Conclusions
We have evaluated which US survey data is most fruitful for measuring character strengths
(specifically drive and prudence) and looked at how much one such measure, the BPI
hyperactivity scale, relates to educational attainment. Our evaluation suggests that the NLSY
iterations, PSID, and the Fragile Families studies offer some of the best measures of drive and
prudence, but that other surveys have measures which meet at least one of our criteria for
quality (proximity and specificity). We also find that better scores on our composite measure
derived from the BPI hyperactivity scale are significantly associated with higher educational
attainment and that this relationship is comparable in size to the relationship between doing well
on math and reading measures and educational attainment.

So: Character matters. Children who learn and can exhibit character strengths attain more years
of education, earn more, and likely outperform other individuals in other areas of life. Of course,
many other factors matter a great deal, too – most obviously cognitive skills, but also a host of
cultural, social and education attributes.

And it is important to remember that the topic of character is larger than one paper can
encompass. In this paper, we focused on a very narrow slice in terms of the kaleidoscope of

CENTER ON CHILDREN AND FAMILIES | THE CHARACTER & OPPORTUNITY PROJECT                            30
attributes and attitudes influencing life outcomes. For one thing, action requires more than just
skills. The “capacities to act” do not necessarily translate to reasons to act – which are more
about self-perception and aspiration (Reeves, 2014a). Similarly, people who are optimistic and
believe their actions have influence are more likely to get ahead. Those who see themselves
in a positive light – in other words have high self-esteem – are likely to demonstrate greater
personal agency and have higher expectations.

Compared to the field of cognitive skill measurement, the character strengths movement is
still in the foothills, both in terms of evidence and policy. Whether character strengths can be
developed is one question: to which the answer appears to be yes (see Cunha and Heckman
2008; Carneiro and Heckman 2003). Whether character strengths can be developed through
explicit public policy is quite another, and here the answer appears to be: we don’t know. Policy-
makers often fall into the trap of what philosopher Jon Elster describes as ‘willing what cannot
be willed.’ But as we learn more about the importance of character strengths, and disparities in
their development, the need to move forward – if only through more research and evaluations
of existing character-development programs – becomes more urgent, not least in terms of
boosting social mobility. For greater mobility, we need not only to increase opportunities, but
also to ensure that people are able to seize them.

CENTER ON CHILDREN AND FAMILIES | THE CHARACTER & OPPORTUNITY PROJECT                               31
References
Baydar, Nazli, and Jeanne Brooks-Gunn. “Effects of Maternal Employment and Child-Care
Arrangements on Preschoolers’ Cognitive and Behavioral Outcomes: Evidence from the
Children of the National Longitudinal Survey of Youth.” Developmental Psychology 27, no. 6
(1991): 932-945.

Belsky, Jay, R.M. Pasco Fearon, and Brian Bell. “Parenting, Attention and Externalizing
Problems: Testing Mediation Longitudinally, Repeatedly, and Reciprocally.” Journal of Child
Psychology and Psychiatry 48, no. 12 (2007): 1233-1242.

Boutwell, Brian B., and Kevin M. Beaver. “The Intergenerational Transmission of Low Self-
control.” Journal of Research in Crime and Deliquency 47, no. 2 (2010): 174-209.

Bowen, William G., Matthew M. Chingos, and Michael S. McPherson. Crossing the finish line:
Completing college at America’s public universities. Princeton University Press, 2009.

Cadena, Brian C. and Keys, Benjamin J., “Human Capital and the Lifetime Costs of Impatience.”
(August 10, 2012).

Carneiro, Pedro Manuel, and James J. Heckman. “Human capital policy.” (2003).

Character Education Partnership. “Performance Values: Why They Matter and What Schools
Can Do to Foster Their Development.” Washington, DC, 2008.

Chiteji, Ngina. “Time-preference, Non-cognitive Skills and Well-being across the Life Course: Do
Non-cognitive Skills Encourage Healthy Behavior?.” The American Economic Review 100, no. 2
(2010): 200.

Converse, Patrick D., Katrina A. Piccone, and Michael C. Tocci. “Childhood Self-Control,
Adolescent Behavior, and Career Success.” Personality and Individual Differences 59 (2014):
65-70.

Courtemanche, Charles J., Garth Heutel, and Patrick McAlvanah. “Impatience, Incentives, and
Obesity.” NBER Working Paper No. 17483, 2011.

Cunha, Flavio, and James J. Heckman. “Formulating, identifying and estimating the technology
of cognitive and noncognitive skill formation.” Journal of Human Resources 43, no. 4 (2008):
738-782.

DellaVigna, Stefano, and M. Daniele Paserman. “Job Search and Impatience.” Journal of Labor
Economics 23, no. 3 (2005): 527-588.

Dohmen, Thomas, Armin Falk, David Huffman, and Uwe Sunde. “The intergenerational
transmission of risk and trust attitudes.” The Review of Economic Studies 79, no. 2 (2012): 645-
677.

CENTER ON CHILDREN AND FAMILIES | THE CHARACTER & OPPORTUNITY PROJECT                         32
Duckworth, Angela L., Christopher Peterson, Michael D. Matthews, and Dennis R. Kelly. “Grit:
Perseverance and Passion for Long-Term Goals.” Journal of Personality and Social Psychology
92, no. 6 (2007): 1087-1101.

Duckworth, Angela L., and Martin EP Seligman. “Self-discipline outdoes IQ in predicting
academic performance of adolescents.” Psychological Science 16, no. 12 (2005): 939-944.

Duckworth, Angela Lee, Eli Tsukayama, and Henry May. “Establishing causality using
longitudinal hierarchical linear modeling: An illustration predicting achievement from self-
control.” Social Psychological and Personality Science (2010).

Dunifon, Rachel, and Greg T. Duncan. “Long-Run Effects of Motivation on Labor-Market
Success.” Social Psychology Quarterly 61, no. 1 (1998): 33-48.

Finn, Jeremy D. School Engagement & Students At Risk. Washington, DC: U.S. Department of
Education, National Center for Education Statistics, 1993.

Gouskova, Elena, Ngina Chiteji, and Frank Stafford. “Pension Participation: Do Parents
Transmit Time Preference?” Journal of Family and Economic Issues 31, no. 2 (2010): 138-150.

Halle, Tamara, et al. Disparities in Early Learning and Development: Lessons from the Early
Childhood Longitudinal Study – Birth Cohort (ECLS-B). Washington, DC: Child Trends, 2009.

Harris, Kathleen Mullan, Greg J. Duncan, and Johanne Boisjoly. “Evaluating the Role of
“Nothing to Lose” Attitudes on Risky Behavior in Adolescence.” Social Forces 80, no. 3 (2002):
1005-1039.

Heckman, James L., John Eric Humphries, and Tim Kautz. The Myth of Achievement Tests.
Chicago: The University of Chicago Press, 2014.

Heckman, James J., and Stefano Mosso. The Economics of Human Development and Social
Mobility. No. w19925. National Bureau of Economic Research, 2014.

Heckman, James J., Rodrigo Pinto, and Peter A. Savelyev. Understanding the mechanisms
through which an influential early childhood program boosted adult outcomes. No. w18581.
National Bureau of Economic Research, 2012.

Heckman, James J., and Yona Rubinstein. “The importance of noncognitive skills: Lessons from
the GED testing program.” American Economic Review (2001): 145-149.

Hedengren, David and Thomas Stratmann. “The Dog that Didn’t Bark: What Item Nonresponse
Shows about Cognitive and Non-Cognitive Ability.” Working Paper, 2012.

Hill, Martha S., et al. Motivation and Economic Mobility. Ann Arbor: Institute for Social Research,
The University of Michigan, 1985.

CENTER ON CHILDREN AND FAMILIES | THE CHARACTER & OPPORTUNITY PROJECT                            33
Hitt, Collin, and Julie R. Trivitt. “Don’t Know? Or Don’t Care?” EDRE Working Paper No. 2013-
05, 2013.

Hsin, Amy, and Yu Xie. Hard Skills, Soft Skills: The Relative Roles of Cognitive and Non-
cognitive Skills in Intergenerational Social Mobility. Population Studies Center, 2012.

Isaacs, Julia B. “Starting School at a Disadvantage: The School Readiness of Poor Children.
The Social Genome Project.” Center on Children and Families at Brookings (2012).

Jacob, Brian A. “Where the Boys Aren’t: Non-Cognitive Skills, Returns to School and the Gender
Gap in Higher Education.” NBER Working Paper 8964, 2002.

Jencks, Christopher. Who Gets Ahead? The Determinants of Economic Success in America.
New York: Basic Books, 1979.

Kidd, Celeste, Holly Palmeri, and Richard N. Aslin. “Rational snacking: Young children’s
decision-making on the marshmallow task is moderated by beliefs about environmental
reliability.” Cognition 126, no. 1 (2013): 109-114.

Kowaleski-Jones, Lori. “Staying Out of Trouble: Community Resources and Problem Behavior
Among High-Risk Adolescents.” Journal of Marriage and Family 62, no. 2 (2000): 449-464.

Lleras, Christy. “Do Skills and Behaviors in High School Matter? The Contribution of
Noncognitive Factors in Explaining Differences in Educational Attainment and Earnings.” Social
Science Research 37 (2008): 888-902.

Mischel, Walter, and Nancy Baker. “Cognitive appraisals and transformations in delay behavior.”
Journal of Personality and Social Psychology 31, no. 2 (1975): 254.

Mischel, Walter, Yuichi Shoda, and Monica I. Rodriguez. “Delay of gratification in children.”
Science 244, no. 4907 (1989): 933-938.

Moffitt, Terrie E., Louise Arseneault, Daniel Belsky, Nigel Dickson, Robert J. Hancox, HonaLee
Harrington, Renate Houts et al. “A gradient of childhood self-control predicts health, wealth, and
public safety.” Proceedings of the National Academy of Sciences 108, no. 7 (2011): 2693-2698.

Moore, Bert, Walter Mischel, and Antonette Zeiss. “Comparative effects of the reward
stimulus and its cognitive representation in voluntary delay.” Journal of Personality and Social
Psychology 34, no. 3 (1976): 419.

Mueller, Gerrit, and Erik Plug. “Estimating the Effect of Personality on Male and Female
Earnings.” Industrial and Labor Relations Review 60, no. 1 (2006): 3-22.

Peterson, Christopher, and Martin E.P. Seligman. Character Strengths and Virtues: A Handbook
and Classification. New York: Oxford University Press, American Psychological Association,
2004.

CENTER ON CHILDREN AND FAMILIES | THE CHARACTER & OPPORTUNITY PROJECT                              34
Razza, Rachel A., Anne Martin, and Jeanne Brooks-Gunn. “The Implications of Early Attentional
Regulation for School Success among Low-Income Children.” Journal of Applied Developmental
Psychology 33, no. 6 (2012): 311-319.

Reeves, Richard V. “Vague Hopes, Active Aspirations and Equality.” Brookings Institution and
Human Capital and Economic Opportunity Network Working Paper. 2014a.

Reeves, Richard V. “The New Politics of Character.” National Affairs 20 (2014b).

Reeves, Richard V. and Kimberly Howard. “The Glass Floor: Education, Downward Mobility, and
Opportunity Hoarding.” Washington, DC: Brookings Institution, 2014.

Roberts, Brent W., Joshua J. Jackson, Jennifer V. Fayard, Grant Edmonds, and Jenna Meints.
“Conscientiousness.” In Handbook of Individual Differences in Social Behavior, by Mark R.
Leary and Rick H. Hoyle, 369-381. New York: Guildford Press, 2009.

Rosenbaum, James J. Beyond College for All: Career Paths for the Forgotten Half. New York:
Russell Sage Foundation, 2001.

Segal, Carmit. “Working When No One is Watching: Motivation, Test Scores, and Economic
Success.” Management Science 58, no. 8 (2012): 1438-1457.

Tough, Paul. How Children Succeed: Grit, Curiosity, and the Hidden Power of Character. New
York: First Mariner Books, 2012.

CENTER ON CHILDREN AND FAMILIES | THE CHARACTER & OPPORTUNITY PROJECT                          35
You can also read