The Combination of Collective and Individual Modes in the Hauts-de-France Region
←
→
Page content transcription
If your browser does not render page correctly, please read the page content below
Session: La Neutralité Climatique Des Transports Individuels : Quelles Organisations Territoriales ?

The Combination of Collective and Individual
   Modes in the Hauts-de-France Region:
          A Quantitative Observation of On-board Small Vehicles

Dylan MOINSE and Alain L’HOSTIS
LVMT, Gustave Eiffel University, IFSTTAR, Ecole des Ponts, F-77455 Marne-la-Vallée, France

                                                      IGU Paris 2022
                                                       21, July 2022
1. Background
                     Emerging Micromobility
                                                                                                                                 Fig. 1: Extract from a Ride-Along Interview by E-Scooter

1. Background             Active travel and micromobility [1]
- Emerging
Micromobility             • Transportation system diversity
- Towards Transit
Metropolises
- Contributions           "New Mobilities Paradigm" [2]
- Limits of the           • Multimodality and accessibility
Literature
                          • "First- and last-mile" solution [3]
2. Methods
                          Economic, social and environmental benefits [1]
3. Results
                          • Efficient, affordable, and healthy mobility
4. Conclusions            • Improve access to public transport

                                                                                                                                 Illustration: Moinse (Lille, 2022)

                    [1] Litman, T. (2021). New Mobilities : Smart Planning for Emerging Transportation Technologies. Island Press. ISBN: 978-1-64283-145-0
                    [2] Sheller, M., & Urry, J. (2006). The New Mobilities Paradigm. Environment and Planning A: Economy and Space, 38(2), 207-226. https://doi.org/10/brd7rf
                    [3] Holm Møller, T., Simlett, J., & Mugnier, E. (2020). “Micromobility : Moving cities into a sustainable future” (p. 36) [EY Report].

                      2
1. Background
                      Towards Transit Metropolises
1. Background             Intermodality can bridge the gap left by public                                                              Fig. 2: Spatial Context and Configuration of
                                                                                                                                       Bicycle-based Transit-Oriented Development [9]
- Emerging
Micromobility             transport [4; 5; 6]
- Towards Transit         • Practices expected to be enhanced in the future
Metropolises
- Contributions           • Increasing patronage by up to 9% by 2030 [7]
- Limits of the
Literature
                          Transit Metropolises [8; 9]
2. Methods                • Balance between hybrid urban forms and
                             mobility systems
3. Results
                          • Bicycle-based Transit-Oriented Development [10]
4. Conclusions      [4] Wiel, M. (1998). Comment gérer la transition urbaine. Recherche - Transports - Sécurité, 58, 3-20. https://doi.org/10/bgdbhw
                    [5] Oostendorp, R., & Gebhardt, L. (2018). Combining means of transport as a users’ strategy to optimize traveling in an urban context : Empirical results on intermodal
                    travel behavior from a survey in Berlin. Journal of Transport Geography, 71, 72-83. https://doi.org/10/gfhf3j
                    [6] Amar, G. (2016). Homo mobilis : Une civilisation du mouvement (2e édition). FYP EDITIONS. ISBN: 978-2-36405-133-1
                    [7] Ensor, M., Maxwell, O., & Bruce, O. (2021). “Mode shift to micromobility” (Nᵒ 674; p. 110). Waka Kotahi NZ Transport Agency research.
                    [8] Cervero, R. (1998). The Transit Metropolis : A Global Inquiry (Island Press). ISBN: 1-55963-591-6
                    [9] Cervero, R. (2019). Chapter 7 - The transit metropolis : A 21st century perspective. Transportation, Land Use, and Environmental Planning, 131-149.
                    https://doi.org/10/ghdkt4
                    [10] Lee, J., Choi, K., & Leem, Y. (2016). Bicycle-based transit-oriented development as an alternative to overcome the criticisms of the conventional transit-oriented
                    development. International Journal of Sustainable Transportation, 10(10), 975-984. https://doi.org/10.1080/15568318.2014.923547

                      3
1. Background
                      Contributions of the Academic Literature
                                                                                                                            Fig. 3: Gender Distribution by Feeder Mode in the 12 surveyed
                                                                                                                            railway stations [14]
                                                                                                                                                                                       N=2,537
1. Background             Similarities and differences between e-scooter
- Emerging                                                                                                                            Scooter                                   83% 17%
Micromobility             and bicycle users? [11]                                                                                         Bike                                79% 21%
- Towards Transit         • E-scooters      appeal     to   a   broader
Metropolises                                                                                                                             Walk                      54% 46%
- Contributions              demographic group than cycling: Young
                                                                                                                                           Bus                     54% 46%
- Limits of the              and males [12]
Literature

2. Methods
                                                                 ≠
                          • E-scooter modal split as young (45-60%)
                                                                                                                            Car (passenger)

                                                                                                                                 Car (driver)

                                                                                                                                   All modes
                                                                                                                                                               44% 56%
                                                                                                                                                            38% 62%
                                                                                                                                                                  51% 49%
3. Results                  and male (80-85%) as cycling [13; 14; 15]                                                                                    Male        Female
                    [11] McKenzie, G. (2019). Spatiotemporal comparative analysis of scooter-share and bike-share usage patterns in Washington, D.C. Journal of Transport Geography, 78,
4. Conclusions      19-28. https://doi.org/10/ggxxcf
                    [12] Curl, A., & Fitt, H. (2020). Same same, but different? Cycling and e-scootering in a rapidly changing urban transport landscape. New Zealand Geographer, 76.
                    https://doi.org/10/gjj3sf
                    [13] Pages, T., Lammoglia, A., & Josselin, D. (2021). Les nouveaux modes de déplacement individuel doux basés sur l’électrique. Attractivité et insertion modale. Territoire
                    en mouvement Revue de géographie et aménagement. Territory in movement Journal of geography and planning.
                    [14] Moinse, D., Goudeau, M., L’Hostis, A., & Leysens, T. (2022). An Analysis of Intermodal Use of Electric and Human-powered Scooters with Train in the Provence-Alpes-
                    Côte d’Azur Region, in France : Towards Extended Train Station Areas? https://halshs.archives-ouvertes.fr/halshs-03523112
                    [15] Nel·lo Deakin, S., Bach Coma, X., & Pérez Sans, N. (2022). Noves mobilitats quotidianes a la metròpoli de Barcelona. La irrupció del patinet elèctric : Tendències
                    recents i oportunitats. In CAP A LA METRÒPOLI 2030. REPTES EMERGENTS, CONEIXEMENTS INNOVADORS (Anuari Metropolità de Barcelona 2021, p. 133-154)., ISBN:
                    972-84-92940-50-9

                      4
1. Background
                      Limits of the Academic Literature
1. Background             Lack of knowledge regarding light electric mode
- Emerging
Micromobility             users [16]

                          •                                                                                                                                                    •
- Towards Transit
Metropolises                          To what extent does the modal share of intermodal users
- Contributions                       relying on emerging micromobility can be characterized?
- Limits of the
Literature
                                                                                                                                            •     Survey Analysis

                                                                                                                                   }
2. Methods
                          Specific methods for data collection and analysis                                                                 •     Interviews
3. Results                of users combining micromobility and transit [17]                                                                 •     Meta-Analysis
                          • No standardised method of capturing data                                                                        •     Big Data
4. Conclusions
                             from privately owned micromobility devices [18]                                                                •     Automatic Counting
                                                                                                                                            •     Direct Observation

                    [16] Richer, C. (2021, mars 16). [Dossier Mobilités] #11 - Micromobilités et intermodalités : L’enjeu des engins de déplacement personnels. construction21.org.
                    [17] Oeschger, G., Carroll, P., & Caulfield, B. (2020). Micromobility and public transport integration : The current state of knowledge. Transportation Research Part D:
                    Transport and Environment, 89, 102628. https://doi.org/10/gkzn9h
                    [18] Ensor, M., Maxwell, O., & Bruce, O. (2021). “Mode shift to micromobility” (Nᵒ 674; p. 110). Waka Kotahi NZ Transport Agency research.

                      5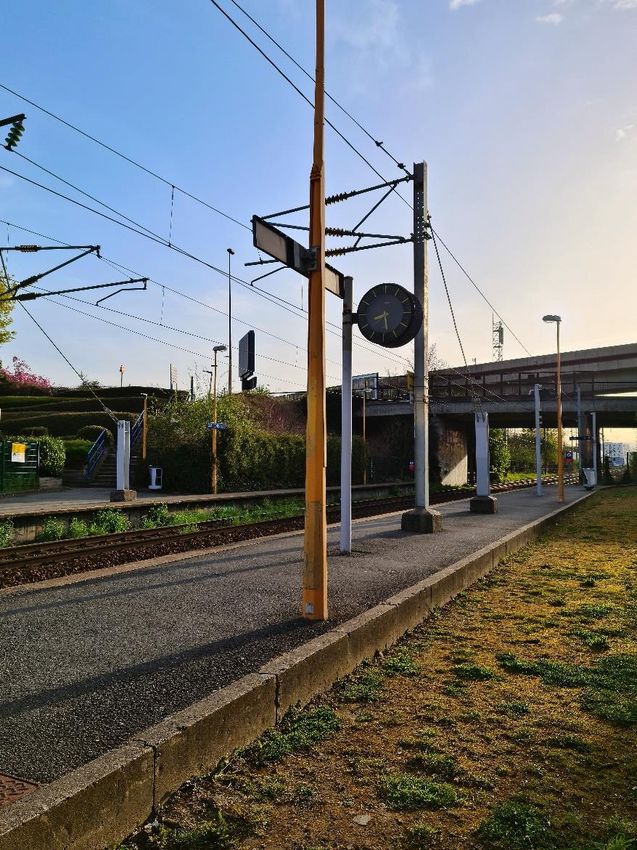
2. Methods
                     Definition of the Quantitative Observation
1. Background                     Ethnographic Observation                                                                      On-site Counting
2. Methods                Building sample questions [19]                                                      Counting the occurrences [20]
- Definition
- Main Objectives         Collecting data by action [19]                                                      Detachment and objectification [21]
- Perimeter
- Protocol
- Calendar
- Data Analysis
                                                                              Quantitative Observation
3. Results
                                                       Data collection tool for systematicity [21]:
4. Conclusions
                                                   1. Massification                                                  4. Desynchronisation
                                                   2. Descriptive Statistics                                         5. Time Reversibility
                                                   3. Visual Recording Technology                                    6. Proof Logic
                    [19] Peneff, J. (1995). Mesure et contrôle des observations dans le travail de terrain. L’exemple des professions de service. Sociétés Contemporaines, 21(1), 119-138.
                    https://doi.org/10/cjk8q5
                    [20] Michiels-Philippe, M.-P. (1984). L’Observation (Delachaux Et Niestlé édition). Delachaux et Niestlé. ISBN: 2603005324
                    [21] Filion, N. (2011). Compter le réel. Terrains travaux, 19(2), 37-55. https://doi.org/10/gn382z

                      6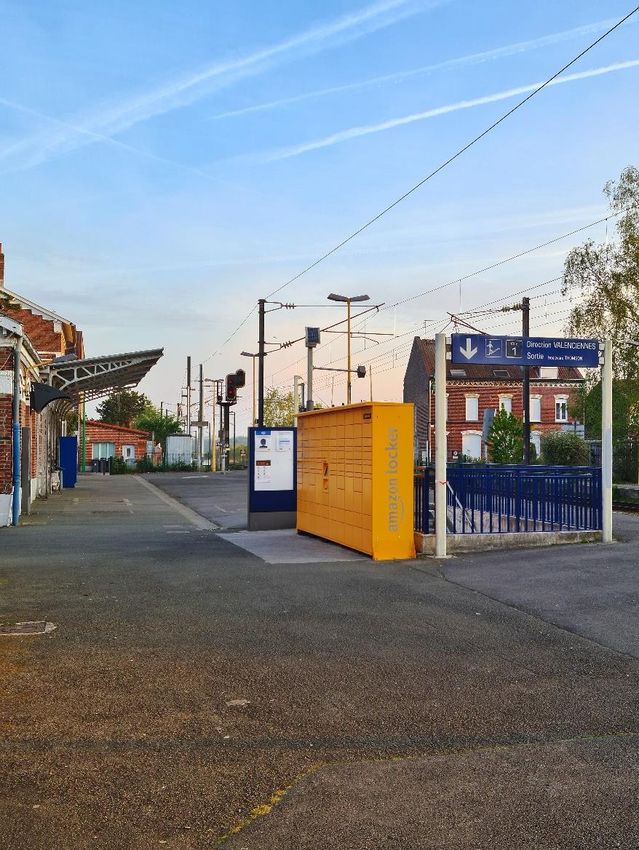
2. Methods
                      Main Objectives
1. Background          Identifying the weight and specifying micromobility users combined with public
2. Methods             transport, at a regional scale:
- Definition
- Main Objectives
- Perimeter            1.       Measuring the modal share of micro-modes [22]
- Protocol
- Calendar
- Data Analysis
                       2.       Determining the age and gender gap among users [23]

3. Results             3.       Comparing various areas according to their urban features [22]
4. Conclusions

                    [22] Paugam, S., & Collectif. (2012). L’enquête sociologique. Presses Universitaires de France - PUF., ISBN: 978-2-13-060873-8
                    [23] Corbillé, M.-A., & Huet, M. (2020). "Espace public : Méthodes pour observer et écouter les usagers" (C16TV0249).

                      7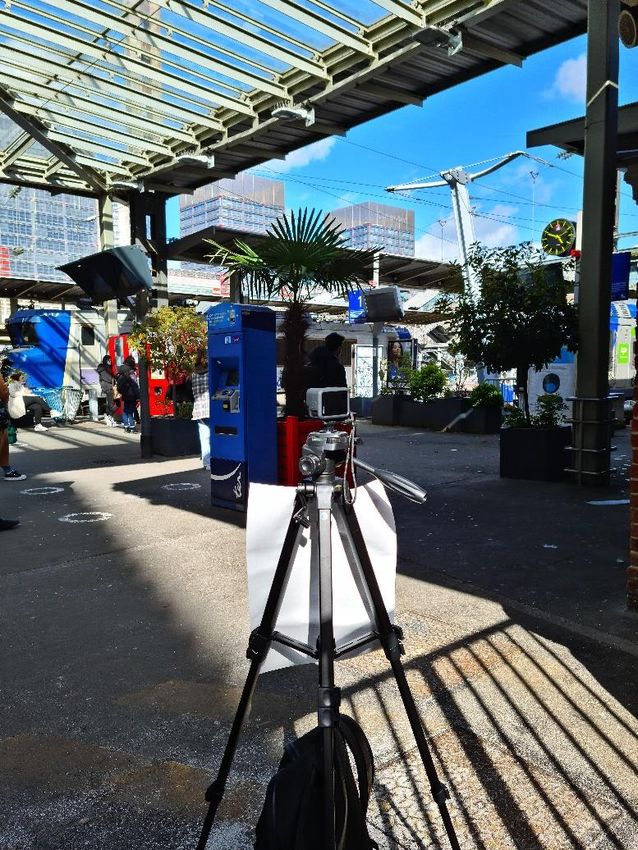
2. Methods
                    Observation Sites
                    Fig. 4: Map of the Five Intermunicipalities
1. Background       Surveyed in the Hauts-de-France Region

2. Methods
- Definition
- Main Objectives
- Perimeter
- Protocol
- Calendar
- Data Analysis

3. Results

4. Conclusions

                    Realisation: Moinse and L’Hostis, 2022

                    8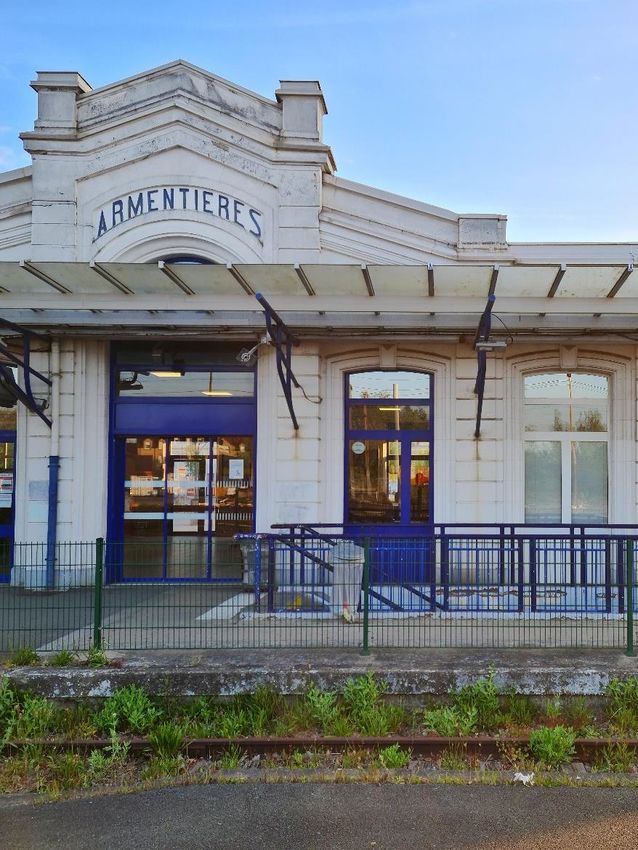
2. Methods
                    Protocol                                                        Fig. 5: Video Recording Material for Quantitative
                                                                                    Observation at Lille Flandres Train Station
                    Railway Stations   Lille Flandres (1), Lille CHR (2), Lesquin
1. Background                          (3), Béthune (4), Armentières (5), Le
2. Methods                             Poirier-Université (6), Dunkerque (7),
- Definition                           Vis-à-Marles (8), and Creil (9)
- Main Objectives
- Perimeter         Period             April, May, and June 2022
- Protocol
- Calendar          Time Range         For each station: Tuesday and
- Data Analysis                        Thursday at peak hours (from 7 A.M.
3. Results
                                       to 9:30 A.M. and from 4:30 P.M. to 7
                                       P.M.)
4. Conclusions
                    Material           Mobile camera with tripod, poster,
                                       research    logbook,   high-visibility
                                       jacket,     name     badge,      and
                                       administrative documents
                    Subjects           On-board modes with regional (TER)
                                       and high-speed trains (TGV)                  Illustration: Moinse (Lille, 2022)

                    9
2. Methods
                    Protocol
1. Background
                         On-Board Mode                           Gender           Age Groups
2. Methods
- Definition
- Main Objectives   PI   Walking                    F     Female          1     Youth (56)
3. Results
                    TM Kick Scooter                                       Inc   Unknown
4. Conclusions      TE   Electric-powered Scooter
                    AU   Other personal mobility
                         device

                    Linked encoding: Mode_Gender_Age

                    10
2. Methods
Calendar
1. Background
2021 2022
Sept. Oct. Jan. Feb. Mar. Apr. May. Jun.
2. Methods
- Definition
- Main Objectives
- Perimeter
- Protocol Preparation Observations Data Analysis
- Calendar
- Data Analysis
3. Results
4. Conclusions
• General Data Protection Regulation (GDPR) compliance
• SNCF Gares & Connexions investigation permission
• Test observations (N=4,924)
• Recorded observations (N=15,435)
112. Methods
Data Analysis
Fig. 5: Manual Detection of Queried Variables
1. Background Information for each
2. Methods observed line:
- Definition
- Main Objectives
Departure / Terminal Train
- Perimeter Stations
- Protocol
- Calendar
Access / Egress
- Data Analysis Train Type
3. Results Line Identification
4. Conclusions Day / Hour
P_F_2
TM_F_3 Weather / Temperature
TE_H_3 TM_H_3
Disruptions
Video Recoding ID
Statistical File ID
Illustration: Moinse (Dunkerque, 2022)
123. Results and Discussion
Passengers and Micromobility Sample
Observed Passengers with Sampled
1. Background N° Station Period
Passengers Micromobility Lines
2. Methods
1 Lille Flandres 5 / 7 April 5,836 287 (4.92%) 40
3. Results
• Sample 2 Lille CHR 12 / 14 April 1,025 122 (11.90%) 42
• Micromobility
Modal Share
3 Lesquin 19 / 21 April 309 53 (17.15%) 27
• Age 4 Béthune 26 / 28 April 1,281 96 (7.49%) 13
• Gender
• Overview 5 Armentières 3 / 5 May 2,324 145 (6.24%) 31
• Gender Biases
6 Le Poirier Université 10 / 12 May 280 45 (16.07%) 43
4. Conclusions
7 Dunkerque 17 / 19 May 2,221 187 (8.42%) 28
8 Vis à Marles 31 / 2 June 3 0 (0%) 6
9 Creil 7 / 9 June 2,159 100 (4.63%) 28
TOTAL 15,435 1,035 (6,71%) 258
133. Results and Discussion
An Underestimated Micromobility Modal Share?
}
N = 15,435
1. Background All 93% 2,13% 2,98%
2. Methods Lesquin 83% 7,12% 1,29% 6,15% 1,94%
Le Poirier Université 84% 5,00% 2,14% 6,79% 2,14%
3. Results
• Sample Lille CHR 88% 4,10% 2,05% 5,56%
• Micromobility
Dunkerque 92% 2,21% 4,10%
Modal Share
• Age Béthune 93% 2,50% 2,73% 1,48%
• Gender
• Overview Armentières 94% 1,98% 2,50%
• Gender Biases Lille Flandres 95% 1,58% 2,18%
4. Conclusions Creil 95% 1,48% 2,50%
0% 50% 100% 0% 5% 10% 15%
Walking Micromobility Conventional Bike Folding Bike
E-Scooter Kick Scooter
Fig. 6: Estimated Modal Share for Each Surveyed Rail Station
Realisation: Moinse and L’Hostis, 2022
143. Results and Discussion
Age Distribution
n = 1,035
1. Background
All 30,07% 63,31% 6,23% N = 15,435
2. Methods
Walking 30,55% 62,77% 6,26% n = 14,400
3. Results
• Sample Conventional Bike 21,58% 69,60% 8,81% n = 329
• Micromobility
Modal Share Folding Bike 5,69% 84,55% 9,76% n = 123
• Age
• Gender E-Scooter 29,57% 67,61% n = 460
• Overview
• Gender Biases
Kick Scooter 19,23% 75,00% 5,77% n = 104
4. Conclusions
Other 42,11% 57,89% n = 19
0% 10% 20% 30% 40% 50% 60% 70% 80% 90% 100%
Youth Young Adult Adult Senior
Fig. 7: Distribution of Passengers by Mode and by Age Categories
Realisation: Moinse and L’Hostis, 2022
153. Results and Discussion
Gender Distribution
N = 15,435 n = 1,035
1. Background
2. Methods All Passengers 51% 49%
N = 15,435 Conventional Bike 76% 24%
n = 329
3. Results
• Sample Walking 50% 50% Folding Bike 65% 35%
• Micromobility n = 14,400
n = 123
Modal Share
• Age Micromobility 72% 28% E-Scooter 75% 25%
• Gender n = 1,035 n = 460
• Overview
• Gender Biases 0% 25% 50% 75% 100%
Kick Scooter 51% 49%
Male Female n = 104
4. Conclusions
Fig. 8: Distribution of Passengers by Mode and by Gender Other 74% 26%
n = 19
Realisation: Moinse and L’Hostis, 2022
0% 25% 50% 75% 100%
16N = 1,035
* ‘Other’
3. Results and Discussion
Overview
1. Background Fig. 9: Overview of
Passenger Distribution
by Railway Station,
2. Methods Micro-mode, Gender,
and Perceived Age
Categories
3. Results
• Sample
• Micromobility
Modal Share
• Age
• Gender
• Overview
• Gender Biases
4. Conclusions
Realisation: Moinse and
L’Hostis, 2022
173. Results and Discussion
Overcoming Gender Biases Bikeability
1. Background Hypothesis: Women's modal shares ‘[…] An assessment of an entire bikeway
2. Methods by bicycle are partly explained by the network for perceived comfort and
territory's cyclability, and parity could convenience and access to important
3. Results
• Sample be achieved from a given threshold. destinations’ [26]
• Micromobility
Modal Share
• Age
Two additional French Databases:
• Gender Insee Population Census - Commuting Modal share and Socio-demographic
• Overview
• Gender Biases
Mobility Flows (2018) [24] variables for 7,932,895 individuals
4. Conclusions Fédération des Usagers de la Bicyclette’s Bikeability Ratings by 277,000 users
Cycling City Barometer (2021) [25]
[24] Fédération des Usagers de la Bicyclette. (n. d.). Parlons-Vélo : Baromètre des Villes Cyclables. Parlons-Vélo : Baromètre des Villes Cyclables. Consulted on 27th June
2022, https://barometre.parlons-velo.fr
[25] Institut National de la Statistique et des Études Économiques (Insee) (n. d.). Mobilités professionnelles en 2018 : déplacements domicile - lieu de travail. Recensement
de la population - Base flux de mobilité. Consulted on 27th June 2022, https://www.insee.fr/fr/statistiques/5393835
[26] Lowry, M. B., Callister, D., Gresham, M., & Moore, B. (2012). Assessment of Communitywide Bikeability with Bicycle Level of Service. Transportation Research Record:
Journal of the Transportation Research Board, 2314(1), 41. https://doi.org/10/gqgtzj
183. Results and Discussion
Overcoming Gender Biases
Fig. 10: Logarithmic Association
1. Background between Gender Cycling and City
Bikeability Rating (/6) around 32 Cities
and 6 Train Stations
2. Methods
N=38 / Total Sample = 7,948,330 / Sub-sample
= 220,098
3. Results y = 0,4112ln(x) - 0,1014
R² = 0,5522 (R² = 0,577, n=32)
• Sample
• Micromobility
Modal Share
• Age
• Gender
• Overview
• Gender Biases
4. Conclusions
* Source: 275,000 cyclists and non-cyclists expressed their feelings in 1,625 municipalities to constitute a French Cycle City Barometer in the 2021 edition, carried out by the Fédération des Usagers de la Bicyclette.
(https://barometre.parlons-velo.fr/)
** Source: Commuting flows database from the 2018 French population census (https://www.insee.fr/fr/statistiques/5393835#documentation)
Realisation: Moinse and L’Hostis, 2022
193. Results and Discussion
Overcoming Gender Biases
1. Background Walkability related to gender-balanced proportions [27]
2. Methods
Cycling gender gap:
3. Results
• Sample • More protected bike lanes = more women cyclists [28]
• Micromobility • Require whole street/suburb changes [29]
Modal Share
• Age
• May not support cycling among diverse populations [30]
• Gender
• Overview
• Gender Biases
4. Conclusions
[27] Jensen, W. A., Stump, T. K., Brown, B. B., Werner, C. M., & Smith, K. R. (2017). Walkability, complete streets, and gender : Who benefits most? Health & Place, 48,
80-89. https://doi.org/10/ghd94g
[28] Kuntzman, G. (2022, mai 25). More Protected Bike Lanes = More Women Cyclists, New Study Shows. Streetsblog New York City.
https://nyc.streetsblog.org/2022/05/25/protected-bike-lanes-are-an-equity-issue-new-study-shows/
[29] Shaw, C., Russell, M., Keall, M., MacBride-Stewart, S., Wild, K., Reeves, D., Bentley, R., & Woodward, A. (2020). Beyond the bicycle : Seeing the context of the gender
gap in cycling. Journal of Transport & Health, 18, 100871. https://doi.org/10/gqgst9
[30] Braun, L. M. (2021). Disparities in Bicycle Commuting : Could Bike Lane Investment Widen the Gap? Journal of Planning Education and Research, 0739456X21993905.
https://doi.org/10.1177/0739456X21993905
204. Conclusions
Main Findings and Perspectives
1. Background 1. A greater proportion of rail passengers by micromobility than estimated,
2. Methods particularly with regard to the rise of e-scooter.
2. Highly disparate patterns of intermodal micromobility use.
3. Results
3. Making cities more cycling-friendly moves towards more inclusive use of
4. Conclusions micromobility.
- Findings
- Contact
4. Completes the questionnaire (sample adjustment)
Methodological limitations:
• Subjectivity and human biaises
• Selection of train stations and lines
• Marginalisation of parking and shared services
• No knowledge of passenger trip origins and destinations
Combination of observation and interview methods [31]
[31] Corbillé, M.-A., & Huet, M. (2020). Espace public : Méthodes pour observer et écouter les usagers (C16TV0249).
214. Conclusions
Contact Dylan MOINSE Alain L’HOSTIS
Laboratoire Ville Mobilité Transport Research Director, HDR - Laboratoire Ville Mobilité Transport
Gustave Eiffel University Gustave Eiffel University
1. Background dylan.moinse@univ-eiffel.fr alain.lhostis@univ-eiffel.fr
2. Methods
3. Results
Grateful to:
4. Conclusions
- Findings SNCF Gares & Connexions
- Contact • Hauts-de-France - Normandie Regional Management
• Train Station Managers and Operators
Gustave Eiffel University
• Data Protection Officers (DPO)
Supporting volunteer investigators
• Iñigo AGUAS ARDAIZ
• Jordan BASSETTI
• Romain LABESSE
Illustration: Moinse, 2021
22Appendices
Quantitative Observation Approach
Focused Observation
≠ Floating Observation
• Observation framework
on a specific object
• Hypothesis
Qualitative counting can be adapted by modern techniques
Source: Corbillé, M.-A., & Huet, M. (2020). Espace public : Méthodes pour observer et écouter les usagers (C16TV0249).
23Appendices
Ridership on Surveyed Train Stations
Passengers Passengers City’s Population
Train Stations (Municipality) Department Agglomeration
(2019) (2020) (2019)
Lille Flandres (Lille) 21,809,569 13,906,563 Nord 234,475 Métropole Européenne de Lille
Creil (Creil) 5,096,215 3,384,293 Oise 36,169 CA Creil Sud Oise
Dunkerque (Dunkerque) 1,931,759 1,241,973 Nord 86,279 CU de Dunkerque
CA de Béthune-Bruay, Artois-
Béthune (Béthune) 1,838,636 1,134,785 Pas-de-Calais 25,039
Lys Romane
Armentières (Armentières) 793,833 613,551 Nord 24,909 Métropole Européenne de Lille
Lille CHR (Lille) 287,018 192,628 Nord 234,475 Métropole Européenne de Lille
Lesquin (Lesquin) 181,001 102,760 Nord 9,012 Métropole Européenne de Lille
Le Poirier Université (Trith-
176,451 74,327 Nord 6,292 CA Valenciennes Métropole
Saint-Léger)
CA de Béthune-Bruay, Artois-
Vis à Marles (Marles-les-Mines) 35,853 8,560 Pas-de-Calais 5,542
Lys Romane
Source: SNCF Open Data, 2022
24Appendices
Methods
1. Lille Flandres
Illustration: Moinse, 2022
Source: OpenStreetMap, 03/07/2022
25Appendices
Methods
2. Lille CHR
Illustration: Moinse, 2022
Source: OpenStreetMap, 03/07/2022
26Appendices
Methods
3. Lesquin
Illustration: Moinse, 2022
Source: OpenStreetMap, 03/07/2022
27Appendices
Methods
4. Béthune
Illustration: Moinse, 2022
Source: OpenStreetMap, 03/07/2022
28Appendices
Methods
5. Armentières
Illustration: Moinse, 2022
Source: OpenStreetMap, 03/07/2022
29Appendices
Methods
6. Le Poirier Université
Illustration: Moinse, 2022
Source: OpenStreetMap, 03/07/2022
30Appendices
Methods
7. Dunkerque
Illustration: Moinse, 2022
Source: OpenStreetMap, 03/07/2022
31Appendices
Methods
8. Vis à Marles (Marles-les-Mines)
Illustration: Moinse, 2022
Source: OpenStreetMap, 03/07/2022
32Appendices
Methods
9. Creil
Illustration: Moinse, 2022
Source: OpenStreetMap, 03/07/2022
33Appendices FUB’s 2021 Cycling Cities Barometer In 2021, the French Federation of Bicycle Users (FUB) surveyed a quarter of a million bike riders about the cycling climate in their town or city. Cyclists were asked to rate their municipality based on 5 different categories: 1. General Feeling 2. Safety 3. Comfort 4. Efforts of the Municipality 5. Parking and Bicycle Services Outcomes: 277,000 contributions and 1 million points ; in 1,625 ranked municipalities Conditions: A minimum of 50 responses / municipality, in the survey 34
N       /6 Notation               C             /6 Comfort

  Appendices                                                                                 A       /6 General Feeling        D             /6 Efforts of the City
                                                                                             B       /6 Safety                 E             /6 Parking & Services
  FUB’s 2021 Cycling Cities Barometer
        Municipality              N        A        B       C        D         E             Municipality                N         A        B       C        D       E

Grenoble (3,009)               4.21      4.18    4.04     4.37    4.44      4.04     Orléans (849)                     2.98     2.88     2.65     2.95     2.78    3.65
Strasbourg (2,060)             4.18      4.17    4.11     4.27    4.33      4.01     Toulouse (4,304)                  2.96     2.96     2.65     3.05     2.66    3.47
Rennes (2,060)                 3.74      3.83    3.40     3.67    3.88      3.91     Nancy (975)                       2.95     2.78     2.63     2.88     2.82    3.64
Annecy (1,471)                 3.69      3.54    3.24     3.76    4.03      3.90     Reims (907)                       2.96     2.95     2.53     2.92     3.02    3.35
Nantes (3,300)                 3.64      3.68    3.35     3.61    3.70      3.86     Metz (685)                        2.89     2.91     2.64     2.93     2.57    3.42
Lyon (4,439)                   3.51      3.51    3.20     3.54    3.64      3.67     Clermont Ferrand (970)            2.76     2.60     2.25     2.61     2.69    3.65
Tours (1,296)                  3.46      3.45    3.15     3.34    3.67      3.69     Limoges (316)                     2.68     2.70     2.33     2.29     2.66    3.41
Bordeaux (1,916)               3.40      3.42    3.20     3.29    3.49      3.60     Amiens (835)                      2.66     2.61     2.30     2.55     2.44    3.38
Angers (1,193)                 3.44      3.47    3.10     3.42    3.39      3.81     Saint Paul (200)                  2.61     2.86     2.40     2.41     2.62    2.74
Caen (1,264)                   3.38      3.36    3.08     3.39    3.34      3.75     Nice (591)                        2.60     2.58     2.37     2.36     2.54    3.15
Paris (9,116)                  3.33      3.27    3.06     3.31    3.61      3.40     Aix en Provence (681)             2.55     2.50     2.23     2.50     2.47    3.04
Dijon (1,060)                  3.18      3.18    2.84     3.01    2.94      3.92     Saint Étienne (765)               2.54     2.43     2.13     2.39     2.36    3.38
Montpellier (3,461)            3.16      3.19    2.86     2.80    3.58      3.95     Perpignan (276)                   2.49     2.49     2.21     .272     2.27    2.78
Brest (1,578)                  3.12      3.07    2.74     3.06    2.97      3.76     Toulon (340)                      2.36     2.41     2.23     2.40     2.24    2.53
Rouen (777)                    3.11      3.10    2.78     2.95    3.22      3.52     Marseille (2,745)                 2.01     1.85     1.72     1.82     1.95    2.71
Lille (1,819)                  3.08      3.12    2.85     3.04    2.86      3.56
                                                                                     TOTAL (53,700)                    3.07     3.05     2.77     2.93 3.05        3.51
Mulhouse (358)                 3.03      2.89    2.73     3.03    2.80      3.69
Source: Fédération des Usagers de la Bicyclette. (n. d.). Parlons-Vélo : Baromètre des Villes Cyclables. Parlons-Vélo : Baromètre des Villes Cyclables. Consulted on 27th
June 2022, https://barometre.parlons-velo.fr

   35
Appendices Population Density around Rail Stations Realisation: Moinse and L’Hostis, 2022 36
Appendices
 3D Population Density around Rail Stations

Realisation: Moinse and L’Hostis, 2022

  37
Appendices
 Characterisation of Catchment Areas around Rail Stations

                                                                      Density (km²)
                                                    Population                                                    Average Annual
 Perimeter                               Coverage
                                                    Reached           Mean                    Median              Salary (euros)

 Primary Area: ≤ 1 km                    1,66%      22,80%            2.979,73                1.925               19.827

 Secondary Area: ]1 ; 3]                 8,62%      34,61%            1.761,60                825                 19.581

 Sub-total: [0 ; 3]                      10,28%     57,40%            2.102,94                1.075               19.678

 Tertiary Area: >3 km                    89,72%     42,60%            639,22                  275                 21.196

 Région                                  100%       100%              1.064,57                375                 20.325
                                                             Sources: Database from Insee (2022) and rail network from the SNCF Open Data (2022)

Realisation: Moinse and L’Hostis, 2022

  38
Appendices Transport Outcomes Framework Source: New Zealand Ministry of Transport, 2018 https://www.transport.govt.nz/area-of-interest/strategy-and-direction/transport-outcomes-framework/ 39
Appendices
 Evolution of E-Scooter Sales in France

Source: Baromètre du marché de la micro-mobilité FP2M / Smart Mobility Lab, 2021
https://fpmm.fr/?cat=-1

  40
You can also read