The future of European companies in data economy - Mikko Ulander, Tanja Vierula, Meiju Ahomäki, Helena Kultanen, Arndt Polifke Innolink - Sitra
←
→
Page content transcription
If your browser does not render page correctly, please read the page content below

The future of European
       companies in data
       economy
        Mikko Ulander, Tanja Vierula, Meiju Ahomäki, Helena Kultanen, Arndt Polifke
        Innolink

30.4.2021                                                  1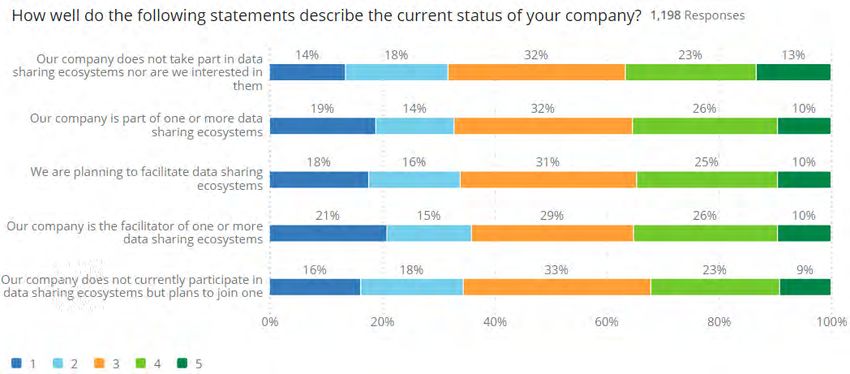
Contents

1. General information on the survey
2. Data economy and current affairs
3. Potential of data economy
4. Data economy challenges
5. Objectives for fair data economy
6. Fair Data label
7. Summary

                                       2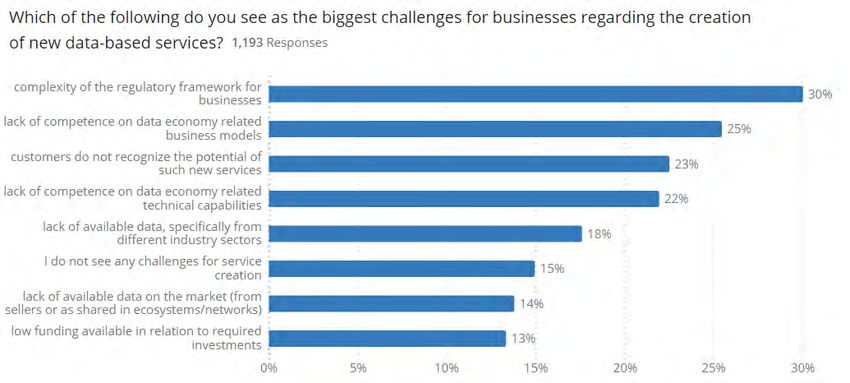
General information on the survey
Goals and implementation of the survey
• The aim of the survey is to produce content that describes the current state of companies vis-à-vis the goals
  and principles of the IHAN-project.
• The aim of the IHAN project is a people-oriented European data market, where companies that use data
  responsibly and open-mindedly thrive on smart services. The IHAN project provides information to
  support domestic and EU-level decision-making in the form of various reports and studies to raise
  awareness of the data economy among target audiences and to build common ground rules and tools for
  more responsible and sustainable digital services. The principle of the IHAN project is that the exchange of
  data is fair, as the individual controls self-accumulating information and the exchange of data takes place
  according to common, fair, principles.
• The study was conducted in a b2b panel in March and April of 2021. The results are compared, where
  applicable, with a similar study conducted in 2019.
• The target group consists of business decision makers in large and medium-sized companies in Finland,
  France, Germany and the Netherlands. The survey was targeted especially to the following decision-making
  roles: Chief data/digital officer, business and strategy management, business development management,
  marketing and customer management as well as information management.
• The study is based on 1,200 responses, that are divided evenly with 300 responses per country. In 2019
  there were 1,667 responses in total, with approximately 400 responses per country.
• The margin of error is 5.7%.
                                                       4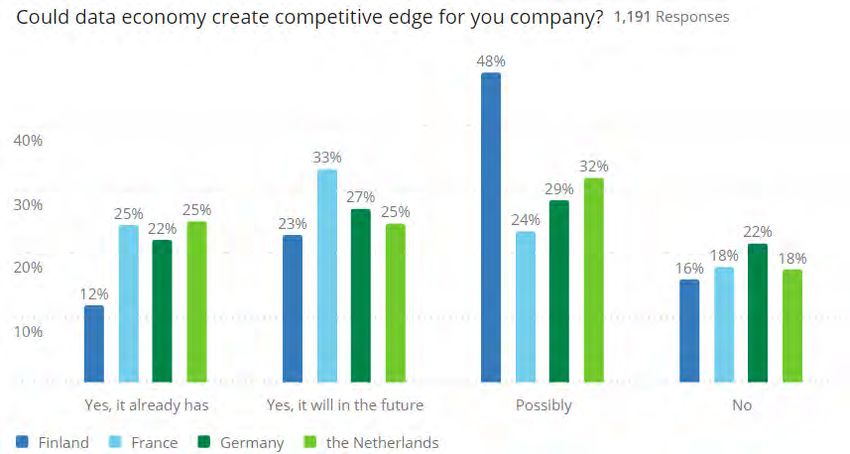
Background information                                                    Finnish sample contains the largest
 Company turnover                                                          share of small companies.

                                                                           In French sample share of 2-50
                                                                           million euros turnover companies
                                                                           has increased somewhat from 2019.

                                                                           In German sample differences
                                                                           between turnover categories have
                                                                           evened out, especially within the
                                                                           highest groups.

                                                                           In the sample from the Netherlands
                                                                           the responses are quite evenly
                                                                           distributed to all groups. The share
                                                                           of respondents in the lowest and
                                                                           highest groups have diminished.

Comparison by country       Finland          France        Germany     the Netherlands
                        2021      2019   2021     2019   2021   2019    2021     2019
under 2 million euros   34%       35%    24%       29%   26%     28%    28%       38%
2 – 10 million euros    25%       24%    30%       20%   25%     20%    27%       19%
10 – 50 million euros    17%       19%   25%       12%   24%     15%    22%       11%
over 50 million euros   24%       22%     21%      39%   26%     37%    22%       33%

                                                     5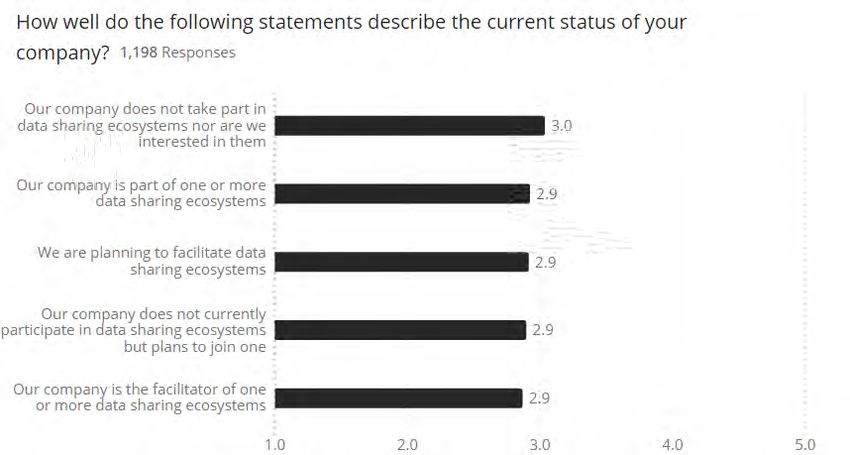
Background information
 Company’s main business area
                                                          Finland           France           Germany      the Netherlands
                                                     2021       2019   2021      2019   2021       2019    2021    2019
Professional, scientific, and technical activities     5%        12%    9%        13%    6%         16%     6%       9%
Other service activities                              14%        14%    19%       15%    19%         9%     12%     11%
Manufacturing                                         11%        13%    9%        9%    10%          7%     16%     12%
Financial and insurance activities                    6%          3%    8%         7%    9%          9%     8%       8%
Construction                                           3%        6%      7%        7%     3%         6%     8%       8%
Real estate activities                                4%          3%     3%       2%      1%         1%      1%      0%
Information and communication                        18%         9%      4%        7%    9%          9%     9%      10%
Human health and social work activities               6%          7%     7%       6%     12%         9%      7%      7%
Wholesale and retail trade; repair of motor
                                                     8%         5%         5%    7%      7%        4%       6%      4%
vehicles motorcycles
Administrative and support services                  6%         5%         5%    4%     5%         10%      9%      9%
Education                                            5%         8%         5%    6%     7%          4%      3%      2%
Transportation and storage                           3%         3%         6%    6%     3%          4%      5%      5%
Accommodation and food service activities            4%         4%         5%    3%     1%          4%      3%      3%
Arts, entertainment and recreation                   3%         4%         1%    2%     2%          4%      2%      3%
Agriculture, forestry, and fishing industries        2%         2%         2%    1%     3%          2%      1%      1%
Electrical, gas, steam and air conditioning
                                                      1%        1%         1%    1%      1%        2%       2%      2%
supply
Activities of extraterritorial organisations and
                                                      1%        1%         1%    2%     0%         1%       1%      1%
bodies
Water supply, sewerage, waste management
                                                      1%        1%         1%    1%     0%         0%      0%       1%
and remediation activities
Mining and quarrying                                 0%         0%         0%    2%     0%         0%       1%      1%
                                                                       6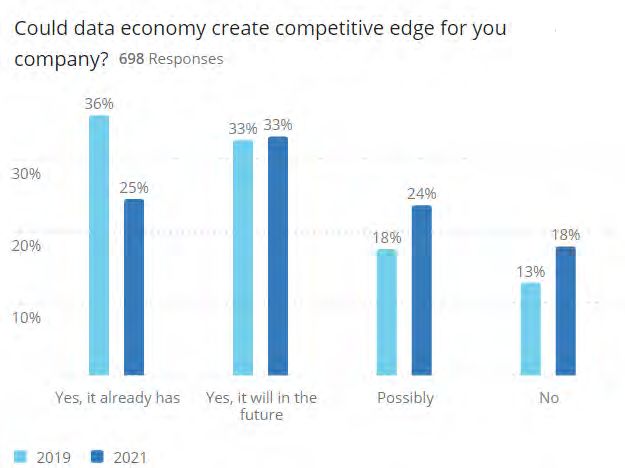
Background information
 Company’s main business area

2020:                                                       2019:
Which of the following                                      Which of the following
statements best                                   the                                                            the
                       Finland France Germany               statements best describes Finland France Germany
describes your                                Netherlands                                                    Netherlands
                                                            your company? We
company? We mainly                                          mainly operate on the...
operate on the...
                                                            global B2B market            16%   17%    17%        21%
B2B (business to business)   35%   30%   31%     36%
                                                            global B2C market            6%    11%    11%        9%
B2B and B2C (business to                                    global B2B market            7%    16%    11%       16%
business and business to     38%   37%   28%     30%
consumer)                                                   European B2C market          4%    10%    11%       10%

B2C (business to                                            national B2B market          21%   13%    15%       14%
                             20%   24%   34%     30%
consumer)                                                   national B2C market          11%   7%     6%         7%
B2G (business to                                            local B2B market             14%   4%     9%         6%
                             7%    9%    7%       4%
government
                                                            local B2C market             8%    2%     7%         4%
                                                            I don’t know / want to say   13%   19%    14%       13%
The answer choices have changed in comparison to
2019.

                                                        7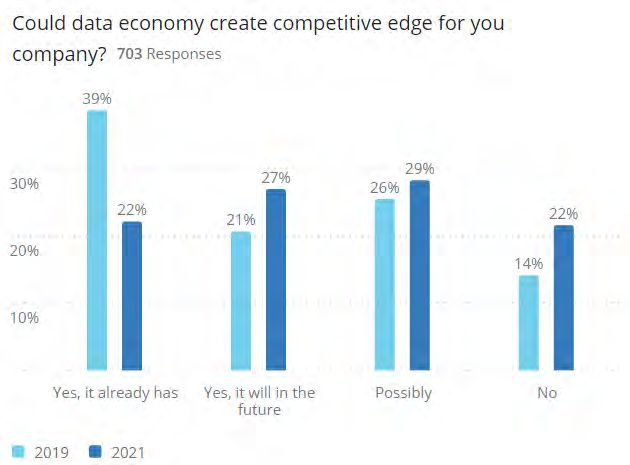
Data economy and current affairs
Changes in the business model
Overall results

                    9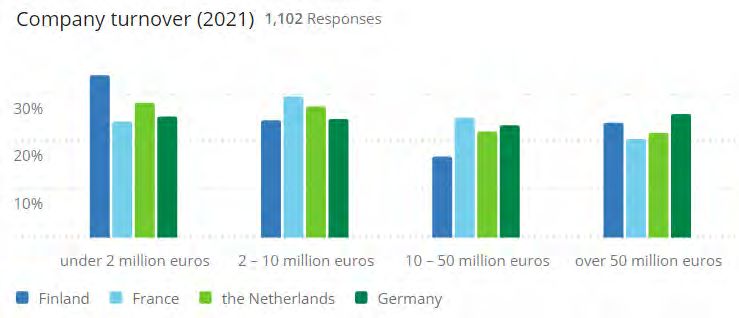
Changes in the business model
Comparison by country

                        Finland                            France                          Germany                          the Netherlands

                No,    Yes,                       No,    Yes,                       No,    Yes,                       No,    Yes,
                              Yes, significant                  Yes, significant                  Yes, significant                  Yes, significant
               none   some                       none   some                       none   some                       none   some

Revenue mode   66%    26%           8%           53%    29%          18%           57%    29%          14%           59%     32%          9%
Value
               56%    35%           9%           50%    30%          20%           50%    34%          16%           62%     30%          9%
proposition
Customers      66%    27%           6%           57%    28%          15%           53%    35%          12%           63%     29%          9%
Channels       66%    25%           9%           53%    32%          15%           52%    31%          17%           60%     30%         10%
Partners       48%    42%          10%           46%    37%          17%           46%    43%          11%           56%     33%         11%
Resources      34%    54%          12%           48%    33%          19%           49%    38%          12%           55%     36%          9%
Activities     50%    41%           9%           49%    30%          21%           57%    33%          11%           62%     31%          7%

                                                                                                  Differences between countries are
                                                                         10                   statistically significant for all statements.
Company’s current business operations
Overall results – Averages
From the following data economy -related statements, choose how well they describe your company´s current business? (N = 1 167)
Our aim is to understand the end customer’s everyday life so that we can offer them suitable product /
3,9
service concepts
We are responsible for producing services to end customers and their customer experience is an
3,8
important part of our value chain
In product development, we primarily invest in continuous and gradual improvements in our products 3,8
We continuously invest in the innovation of new products / services 3,8
Our offering is suitable for many different kinds of environments / platforms 3,6
We wish to offer our customers easy-to-use products / services (for example plug & play) 3,6
We wish to complement our data from several different data sources and interactive situations so that
3,6
we can create the best possible experience for our customers
We offer our end customers several new products via several different channels 3,5
We offer our customers a significant number of other products / services besides our own so that we
3,2
would not be seen as a mere supplier of products but also as an offering channel / platform
Low pricing is a key factor in the demand for our products 3,2
Part of our business model is to bring together the end customer and the suitable product / service
3,2
supplier(s) (third parties)
A third party (for example resellers / distributors) is responsible for providing our products / services
3,0
to end customers
1,0 2,0 3,0 4,0 5,0
Scale 1 = does not describe at all ... 5 = describes very well 11Company’s current business operations
Overall results – Distributions
From the following data economy -related statements, choose how well they describe your company´s current business? (N = 1 167)
Our aim is to understand the end customer’s everyday life so that we can offer them suitable product
5% 5% 18% 32% 39%
/ service concepts
We are responsible for producing services to end customers and their customer experience is an
7% 7% 19% 32% 35%
important part of our value chain
In product development, we primarily invest in continuous and gradual improvements in our
6% 7% 21% 35% 31%
products
We continuously invest in the innovation of new products / services 5% 8% 22% 35% 30%
We wish to offer our customers easy-to-use products / services (for example plug & play) 10% 9% 22% 32% 27%
Our offering is suitable for many different kinds of environments / platforms 8% 10% 24% 32% 27%
We offer our end customers several new products via several different channels 11% 12% 20% 33% 24%
We wish to complement our data from several different data sources and interactive situations so
8% 9% 23% 36% 23%
that we can create the best possible experience for our customers
We offer our customers a significant number of other products / services besides our own so that we
17% 12% 21% 28% 21%
would not be seen as a mere supplier of products but also as an offering channel / platform
Part of our business model is to bring together the end customer and the suitable product / service
16% 12% 25% 29% 18%
supplier(s) (third parties)
Low pricing is a key factor in the demand for our products 13% 15% 25% 29% 18%
A third party (for example resellers / distributors) is responsible for providing our products /
22% 14% 22% 25% 17%
services to end customers
0% 20% 40% 60% 80% 100%
Scale 1 = does not describe at all
... 5 = describes very well 1 2 3 4 5 12Company’s current business operations
Comparison by country
the
Finland France Germany
Netherlands
Average N Average N Average N Average N
Low pricing is a key factor in the demand for our products 3.2 287 3.4 279 3.0 277 3.3 281
We wish to offer our customers easy-to-use products / services 3.6 282 3.7 272 3.3 273 3.7 277
We wish to complement our data from several different data sources and
interactive situations so that we can create the best possible experience for 3.5 287 3.7 275 3.3 274 3.8 279
our customers
A third party is responsible for providing our products / services to end
2.7 284 3.2 275 3.0 272 3.1 278
customers
Part of our business model is to bring together the end customer and the
3.1 287 3.3 279 3.1 271 3.4 278
suitable product / service supplier(s) (third parties)
We continuously invest in the innovation of new products / services 3.8 289 3.9 283 3.5 278 3.9 284
In product development, we primarily invest in continuous and gradual
3.9 289 3.8 275 3.5 273 3.9 276
improvements in our products
We offer our customers a significant number of other products / services
besides our own so that we would not be seen as a mere supplier of 3.1 288 3.5 278 3.1 271 3.3 279
products but also as an offering channel / platform
We offer our end customers several new products via several different
3.4 287 3.6 279 3.2 273 3.6 279
channels
Our offering is suitable for many different kinds of environments /
3.6 281 3.8 277 3.3 274 3.6 282
platforms
Our aim is to understand the end customer’s everyday life so that we can
4.2 286 4.1 278 3.6 276 3.9 280
offer them suitable product / service concepts
We are responsible for producing services to end customers and their
4.0 291 3.9 276 3.6 276 3.8 280
customer experience is an important part of our value chai
Differences between countries are statistically
Scale 1 = does not describe at all ... 5 = describes very well 13 significant for all statements.Company’s current business operations
Development – Finland
2019 2021
Change
Average N Average N
Low pricing is a key factor in the demand for our products 3.1 399 3.2 287 0.1
We wish to offer our customers easy-to-use products / services 3.6 394 3.6 282 0.0
We wish to complement our data from several different data sources and interactive situations so
3.4 403 3.5 287 0.1
that we can create the best possible experience for our customers
A third party is responsible for providing our products / services to end customers 2.8 404 2.7 284 -0.1
Part of our business model is to bring together the end customer and the suitable product / service
3.1 404 3.1 287 0.0
supplier(s) (third parties)
We continuously invest in the innovation of new products / services 3.6 406 3.8 289 0.2
In product development, we primarily invest in continuous and gradual improvements in our
3.7 402 3.9 289 0.2
products
We offer our customers a significant number of other products / services besides our own so that
3.0 399 3.1 288 0.1
we would not be seen as a mere supplier of products but also as an offering channel / platform
We offer our end customers several new products via several different channels 3.2 405 3.4 287 0.2
Our offering is suitable for many different kinds of environments / platforms 3.3 399 3.6 281 0.3
Our aim is to understand the end customer’s everyday life so that we can offer them suitable
4.0 405 4.2 286 0.2
product / service concepts
We are responsible for producing services to end customers and their customer experience is an
3.9 401 4.0 291 0.1
important part of our value chai
Scale 1 = does not describe at all ... 5 = describes very well 14 * Changes marked with an asterisk are statistically
significant.Company’s current business operations
Development – France
2019 2021
Change
Average N Average N
Low pricing is a key factor in the demand for our products 3.6 372 3.4 279 -0.2
We wish to offer our customers easy-to-use products / services 3.7 368 3.7 272 0.0
We wish to complement our data from several different data sources and interactive situations so 3.8 376 3.7 275 -0.1
that we can create the best possible experience for our customers
A third party is responsible for providing our products / services to end customers 3.3 369 3.2 275 -0.1
Part of our business model is to bring together the end customer and the suitable product / service
3.4 374 3.3 279 -0.1
supplier(s) (third parties)
We continuously invest in the innovation of new products / services 3.9 370 3.9 283 0.0
In product development, we primarily invest in continuous and gradual improvements in our 3.8 370 3.8 275 0.0
products
We offer our customers a significant number of other products / services besides our own so that 3.5 374 3.5 278 0.0
we would not be seen as a mere supplier of products but also as an offering channel / platform
We offer our end customers several new products via several different channels 3.7 375 3.6 279 -0.1
Our offering is suitable for many different kinds of environments / platforms 3.9 376 3.8 277 -0.1
Our aim is to understand the end customer’s everyday life so that we can offer them suitable 4.0 372 4.1 278 0.1
product / service concepts
We are responsible for producing services to end customers and their customer experience is an 3.9 373 3.9 276 0.0
important part of our value chai
Scale 1 = does not describe at all ... 5 = describes very well 15 * Changes marked with an asterisk are statistically
significant.Company’s current business operations
Development – Germany
2019 2021
Change
Average N Average N
Low pricing is a key factor in the demand for our products 3.2 370 3.0 277 -0.2
We wish to offer our customers easy-to-use products / services 3.5 362 3.3 273 -0.2
We wish to complement our data from several different data sources and interactive situations so
3.4 364 3.3 274 -0.1
that we can create the best possible experience for our customers
A third party is responsible for providing our products / services to end customers 3.2 365 3.0 272 -0.2
Part of our business model is to bring together the end customer and the suitable product / service
3.3 364 3.1 271 -0.2
supplier(s) (third parties)
We continuously invest in the innovation of new products / services 3.5 375 3.5 278 0.0
In product development, we primarily invest in continuous and gradual improvements in our
3.6 368 3.5 273 -0.1
products
We offer our customers a significant number of other products / services besides our own so that
3.2 364 3.1 271 -0.1
we would not be seen as a mere supplier of products but also as an offering channel / platform
We offer our end customers several new products via several different channels 3.4 368 3.2 273 -0.2
Our offering is suitable for many different kinds of environments / platforms 3.4 364 3.3 274 -0.1
Our aim is to understand the end customer’s everyday life so that we can offer them suitable
3.6 365 3.6 276 0.0
product / service concepts
We are responsible for producing services to end customers and their customer experience is an
3.5 370 3.6 276 0.1
important part of our value chai
Scale 1 = does not describe at all ... 5 = describes very well 16 * Changes marked with an asterisk are statistically
significant.Company’s current business operations
Development – the Netherlands
2019 2021
Change
Average N Average N
Low pricing is a key factor in the demand for our products 3.4 400 3.3 281 -0.1
We wish to offer our customers easy-to-use products / services 3.5 389 3.7 277 0.2
We wish to complement our data from several different data sources and interactive situations so
3.5 392 3.8 279 0.3
that we can create the best possible experience for our customers
A third party is responsible for providing our products / services to end customers 3.2 397 3.1 278 -0.1
Part of our business model is to bring together the end customer and the suitable product / service
3.5 397 3.4 278 -0.1
supplier(s) (third parties)
We continuously invest in the innovation of new products / services 3.7 400 3.9 284 0.2*
In product development, we primarily invest in continuous and gradual improvements in our
3.6 400 3.9 276 0.3*
products
We offer our customers a significant number of other products / services besides our own so that
3.4 401 3.3 279 -0.1
we would not be seen as a mere supplier of products but also as an offering channel / platform
We offer our end customers several new products via several different channels 3.5 393 3.6 279 0.1
Our offering is suitable for many different kinds of environments / platforms 3.5 387 3.6 282 0.1
Our aim is to understand the end customer’s everyday life so that we can offer them suitable
3.7 396 3.9 280 0.2
product / service concepts
We are responsible for producing services to end customers and their customer experience is an
3.7 401 3.8 280 0.1
important part of our value chai
Scale 1 = does not describe at all ... 5 = describes very well 17 * Changes marked with an asterisk are statistically
significant.Data economy capabilities
Overall results – Averages
Please evaluate the accuracy of the following statements that measure the maturity level of data economy in your company?
(N = 1 197)
Our company has the needed skills to function as an active member of data
3,3
economy
Our company has taken action to increase customers’ trust related to data
3,3
collection
Our company has clear practices for data exchange 3,3
Our company has the technical capabilities to collect and combine data from
3,2
other players and to transform it into new services
Our company has the technical capabilities to share data with other companies 3,2
Data-related regulation has had a positive effect on our company’s data-based
3,2
business
Our company has a data strategy which includes the aspect of data sharing 3,1
Our company needs customer data from other companies 3,0
1,0 1,5 2,0 2,5 3,0 3,5 4,0 4,5 5,0
Scale 1 = does not describe at all ... 5 = describes very well 18Data economy capabilities
Overall results – Distributions
Please evaluate the accuracy of the following statements that measure the maturity level of data economy in your company?
(N = 1 197)
Our company has taken action to increase customers’ trust related to data
9% 12% 30% 32% 16%
collection
Our company has the needed skills to function as an active member of data
9% 12% 31% 32% 15%
economy
Our company has clear practices for data exchange 10% 13% 28% 34% 15%
Our company has the technical capabilities to share data with other companies 10% 15% 29% 32% 13%
Our company has the technical capabilities to collect and combine data from
10% 14% 30% 33% 13%
other players and to transform it into new services
Our company needs customer data from other companies 16% 16% 28% 28% 12%
Data-related regulation has had a positive effect on our company’s data-based
10% 12% 35% 31% 12%
business
Our company has a data strategy which includes the aspect of data sharing 13% 15% 30% 30% 11%
0% 10% 20% 30% 40% 50% 60% 70% 80% 90% 100%
1 2 3 4 5
Scale 1 = does not describe at all ... 5 = describes very well 19Data economy capabilities
Comparison by country
Finland France Germany the Netherlands
Average N Average N Average N Average N
Data-related regulation has had a positive effect on our company’s
3.0 298 3.3 296 3.2 295 3.3 300
data-based business *
Our company needs customer data from other companies * 3.0 299 3.2 297 3.0 298 2.9 298
Our company has a data strategy which includes the aspect of data
2.9 299 3.4 297 3.0 298 3.2 298
sharing *
Our company has clear practices for data exchange * 3.0 299 3.5 298 3.3 297 3.4 300
Our company has the needed skills to function as an active member of
3.3 295 3.4 298 3.3 298 3.3 298
data economy
Our company has taken action to increase customers’ trust related to
3.2 297 3.4 299 3.3 298 3.4 297
data collection *
Our company has the technical capabilities to share data with other
3.1 297 3.3 299 3.1 299 3.4 298
companies *
Our company has the technical capabilities to collect and combine
3.2 298 3.4 297 3.2 299 3.3 299
data from other players and to transform it into new services
* In statements marked with an asterisk, the differences
Scale 1 = does not describe at all ... 5 = describes very well 20 between countries are statistically significant.Data economy capabilities
Development – Finland
2019 2021
Change
Average N Average N
Data-related regulation has had a positive effect on our company’s data-based business 2.7 419 3.0 298 0.3*
Our company needs customer data from other companies 2.9 417 3.0 299 0.1
Our company has clear practices for data exchange 2.9 423 3.0 299 0.1
Our company has taken action to increase customers’ trust related to data collection 3.1 421 3.2 297 0.1
Our company has the technical capabilities to share data with other companies 3.1 424 3.1 297 0.0
Our company has the technical capabilities to collect and combine data from other players
3.1 421 3.2 298 0.1
and to transform it into new services
* Changes marked with an asterisk are
Scale 1 = does not describe at all ... 5 = describes very well 21 statistically significant.Data economy capabilities
Development – France
2019 2021
Change
Average N Average N
Data-related regulation has had a positive effect on our company’s data-based business 3.4 397 3.3 296 -0.1
Our company needs customer data from other companies 3.3 396 3.2 297 -0.1
Our company has clear practices for data exchange 3.5 395 3.5 298 0.0
Our company has taken action to increase customers’ trust related to data collection 3.6 397 3.4 299 -0.2
Our company has the technical capabilities to share data with other companies 3.5 400 3.3 299 -0.2
Our company has the technical capabilities to collect and combine data from other players
3.4 398 3.4 297 0.0
and to transform it into new services
* Changes marked with an asterisk are
Scale 1 = does not describe at all ... 5 = describes very well 22 statistically significant.Data economy capabilities
Development – Germany
2019 2021
Change
Average N Average N
Data-related regulation has had a positive effect on our company’s data-based business 3.1 402 3.2 295 0.1
Our company needs customer data from other companies 3.1 401 3.0 298 -0.1
Our company has clear practices for data exchange 3.4 403 3.3 297 -0.1
Our company has taken action to increase customers’ trust related to data collection 3.4 402 3.3 298 -0.1
Our company has the technical capabilities to share data with other companies 3.4 404 3.1 299 -0.3
Our company has the technical capabilities to collect and combine data from other players
3.4 404 3.2 299 -0.2*
and to transform it into new services
* Changes marked with an asterisk are
Scale 1 = does not describe at all ... 5 = describes very well 23 statistically significant.Data economy capabilities
Development – the Netherlands
2019 2021
Change
Average N Average N
Data-related regulation has had a positive effect on our company’s data-based business 3.2 423 3.3 300 0.1
Our company needs customer data from other companies 3.2 423 2.9 298 -0.3
Our company has clear practices for data exchange 3.3 423 3.4 300 0.1
Our company has taken action to increase customers’ trust related to data collection 3.3 425 3.4 297 0.1
Our company has the technical capabilities to share data with other companies 3.4 427 3.4 298 0.0
Our company has the technical capabilities to collect and combine data from other players
3.4 426 3.3 299 -0.1
and to transform it into new services
* Changes marked with an asterisk are
Scale 1 = does not describe at all ... 5 = describes very well 24 statistically significant.Potential of data economy
Data economy as a competitive edge
Comparison by country

                                                      A competitive edge is
                                                      expected to happen in
                                                      the future by half of the
                                                      respondents,
                                                      while one quarter says
                                                      that this already materialized.

                                                      Finland is behind other
                                                      countries regarding this
                                                      self-assessment

                                                      One out of five respondents
                                                      does not expect this for their
                                                      own company

                             Differences between countries are
                        26        statistically significant.
Data economy as a competitive edge
Development – Finland
Finnish respondents
Do expect more to come
But also do not see that much
benefit to have already
happened to this point,
compared with 2019.
Various achievements could be
seen as natural or as a given
The difference between years is
27 statistically significant.Data economy as a competitive edge
Development – Germany
Germany:
Share of those who do say the
competitive edge already
occurred has declined vs 2019.
Share of less bullish
respondents increased.
The difference between years is
28 statistically significant.Data economy as a competitive edge
Development – France
France:
Share of those who do say the
competitive edge already
occurred has declined vs 2019.
Share of less bullish
respondents increased.
The difference between years is
29 statistically significant.Data economy as a competitive edge
Development – the Netherlands
Netherlands:
Same picture:
Share of those who do say the
competetive edge already
occured declines vs 2019.
Share of less bullish
respondents increased
The difference between years is
30 statistically significant.Potential in data sharing
Overall results
Half of the respondents consider the
potential by sharing data for
• saving costs and
• creating new revenue streams
as large or very large
Only one in ten sees no potential
Scale:
1 = no potential at all ...
31 5 = very large potentialPotential in data sharing
Comparison by country
All four countries are very close to each other
Finland France Germany the Netherlands
Average N Average N Average N Average N
create additional revenue from current business model 3.2 300 3.4 299 3.1 299 3.2 299
create new revenue streams from innovations 3.2 299 3.4 297 3.2 298 3.3 299
saving costs 3.3 300 3.4 297 3.2 298 3.4 298
3 1 4 2
Scale: 1 = no potential at all ... 5 = very large potential Differences between countries are
32 statistically significant for all statements.Current status of companies
Overall results – Averages
All statements on same
level, with slightly higher
consent for not being a
player in data economy
Scale: 1 = totally inaccurate ... 5 = totally accurate
33Current status of companies
Overall results – Distributions
Scale: 1 = totally inaccurate ... 5 = totally accurate
34Current status of companies
Comparison by country
Finland France Germany the Netherlands
Average N Average N Average N Average N
Our company does not take part in data sharing ecosystems nor are we
2.8 300 3.1 297 3.1 296 3.2 297
interested in them
Our company does not currently participate in data sharing ecosystems but
2.7 299 3.0 299 2.9 299 3.0 298
plans to join one
Our company is part of one or more data sharing ecosystems 2.7 300 3.0 297 2.9 300 3.1 297
We are planning to facilitate data sharing ecosystems 2.6 300 3.2 296 2.9 298 3.0 296
Our company is the facilitator of one or more data sharing ecosystems 2.5 298 3.1 294 2.9 297 3.0 294
Scale: 1 = totally inaccurate ... 5 = totally accurate Differences between countries are
35 statistically significant for all statements.Data economy challenges
Challenges in the creation of new services
Overall results

                     37
Challenges in the creation of new services
Comparison by country
Which of the following do you see as the biggest challenges for businesses the
Finland France Germany
regarding the creation of new data-based services? Netherlands
I do not see any challenges for service creation 13% 12% 13% 21%
Low funding available in relation to required investments 17% 13% 9% 15%
Complexity of the regulatory framework for businesses 21% 36% 31% 32%
Lack of competence on data economy related business models 26% 25% 27% 24%
Customers do not recognize the potential of such new services 31% 24% 22% 14%
Lack of competence on data economy related technical capabilities 24% 23% 24% 17%
Lack of available data, specifically from different industry sectors 14% 21% 21% 14%
Lack of available data on the market (from sellers or as shared in
13% 13% 17% 12%
ecosystems/networks)
NL: smart & seeing less obstacles (customers´ understanding)
DE: worrying about regulations, but no problem with money raising
FR: even more facing the complexity of regulatory framework
FI: bad money/customer recognition ratio
Differences between countries are
38 statistically significant for all statements.Objectives for fair data economy
Taking objectives into practice                                                                            Most of the companies claim to
                                                                                                                  act fair, but not too altruistic
       Overall results – Averages
         Please indicate whether the following objectives of data use are taken into practice in your company? (N = 1 200)

                We strive to create trust by acting and behaving transparently                                                      3,7

                            Our digital services are designed to respect privacy                                                    3,7

                               We understand our data repositories and assets                                                 3,5
   We have defined ethical rules for our organization for using, collecting and
                                                                                                                              3,5
                                    sharing data
Our digital services are designed to respect control over personal and business
                                                                                                                        3,3
                             data (data sovereingty)
Our company’s consideration of the rights of individuals and/or organisations
                                                                                                                        3,3
                         exceeds statutory requirements
 We communicate about the use of data in our corporate social responsibility
                                                                                                                     3,3
                                  reporting (CSR)
  Involving customers and individuals in designing our services is our design
                                                                                                                    3,2
                                      principle
We offer our customers easy tools to access and manage their personal and/or
                                                                                                                    3,2
                                  business data
   We create value from data, not just for our operations, but also for society,
                                                                                                                  3,1
                              people, and environment
      The data we gather from consumers is available for them to use in other
                                                                                                              3,0
                             services outside our company
                                                                                   1,0    1,5   2,0   2,5   3,0           3,5             4,0   4,5   5,0
                       Scale: 1 = totally disagree ... 5 = totally agree             40
Taking objectives into practice
Overall results – Distributions
Please indicate whether the following objectives of data use are taken into practice in your company? (N = 1 200)
Our digital services are designed to respect privacy 6% 8% 25% 36% 26%
We strive to create trust by acting and behaving transparently 5% 7% 26% 37% 25%
We have defined ethical rules for our organization for using, collecting and
9% 9% 26% 35% 20%
sharing data
We understand our data repositories and assets 6% 9% 30% 37% 18%
Our digital services are designed to respect control over personal and business
11% 10% 31% 31% 17%
data (data sovereingty)
Our company’s consideration of the rights of individuals and/or organisations
10% 10% 34% 32% 15%
exceeds statutory requirements
We communicate about the use of data in our corporate social responsibility
11% 12% 31% 32% 14%
reporting (CSR)
We create value from data, not just for our operations, but also for society,
13% 14% 31% 28% 13%
people, and environment
Involving customers and individuals in designing our services is our design
12% 12% 32% 32% 12%
principle
We offer our customers easy tools to access and manage their personal and/or
13% 12% 30% 34% 12%
business data
The data we gather from consumers is available for them to use in other
17% 14% 30% 28% 11%
services outside our company
0% 10% 20% 30% 40% 50% 60% 70% 80% 90% 100%
Scale: 1 = totally disagree ... 5 = totally agree 41 1 2 3 4 5Taking objectives into practice
Comparison by country
Finland France Germany the Netherlands
Average N Average N Average N Average N
Our digital services are designed to respect privacy 3.7 300 3.7 298 3.7 296 3.8 300
Our digital services are designed to respect control over personal and 3.1 297 3.4 297 3.4 298 3.4 298
business data (data sovereingty) *
The data we gather from consumers is available for them to use in other 2.7 300 3.2 298 3.1 299 3.1 300
services outside our company *
We create value from data, not just for our operations, but also for society, 3.0 299 3.3 298 3.2 299 3.2 299
people, and environment *
We have defined ethical rules for our organization for using, collecting and 3.3 298 3.5 299 3.5 299 3.7 298
sharing data *
We strive to create trust by acting and behaving transparently 3.7 298 3.6 298 3.6 300 3.8 298
We offer our customers easy tools to access and manage their personal 3.0 300 3.3 298 3.2 300 3.3 299
and/or business data *
We understand our data repositories and assets * 3.4 295 3.5 299 3.6 299 3.6 300
We communicate about the use of data in our corporate social responsibility 3.0 294 3.4 299 3.1 299 3.5 299
reporting (CSR) *
Involving customers and individuals in designing our services is our design 3.1 297 3.2 297 3.2 298 3.3 300
principle
Our company’s consideration of the rights of individuals and/or 3.1 297 3.4 298 3.4 300 3.5 300
organisations exceeds statutory requirements *
* In statements marked with an asterisk, the differences
Scale: 1 = totally disagree ... 5 = totally agree 42 between countries are statistically significant.Fair Data label
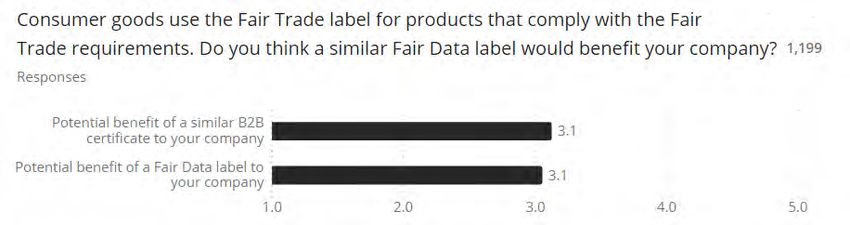
Fair Data label
       Overall results

                                         A majority would see a
                                         benefit of a fair data
                                         label for their company

Scale: 1 = not benefit at all ...
    5 = very high benefit

                                    44
Fair Data label
Comparison by country
Finland France Germany the Netherlands
Average N Average N Average N Average N
Potential benefit of a Fair Data label to your company * 2.9 299 3.1 300 3.2 298 3.1 300
Potential benefit of a similar B2B certificate to your company 3.0 298 3.2 300 3.2 297 3.1 300
All countries very close together,
apart from Finland
Scale: 1 = not benefit at all ... 5 = very high benefit
* In statements marked with an asterisk, the differences
45 between countries are statistically significant.Fair Data label
Development
FINLAND 2019 2021
Average N Average N Change
Potential benefit of a Fair Data label to your company 3.0 414 2.9 299 -0.1
FRANCE 2019 2021
Average N Average N Change
Potential benefit of a Fair Data label to your company 3.4 397 3.1 300 -0.3
GERMANY 2019 2021
Average N Average N Change
Potential benefit of a Fair Data label to your company 3.2 394 3.2 298 0.0
THE NETHERLANDS 2019 2021
Average N Average N Change
Potential benefit of a Fair Data label to your company 3.4 414 3.1 300 -0.3*
Scale: 1 = not benefit at all ... 5 = very high benefit 46 * Changes marked with an asterisk are
statistically significant.Segmentation of respondents
Backround on respondent segmentation
The study included investigation of the nature of the respondent companies’ digital business models.

The analysis is loosely based on the MIT Sloan Center for Information System Research’s (2017) division model (Weill & Woerner:
What’s Your Digital Business Model?: Six Questions To Help You Build The Next-Generation Enterprise, HBR Press 2018).

Each of the four digital business profiles (below in a four-square matrix) were converted to corresponding business claims on two
axes:
• Y-axis: Maturity of creating and utilizing
   customer insight.

                                                     Knowledge of your end customer
• X-axis: Refinement of digital business model.

The results of the specific statements are
                                                                                      Omnichannel                Ecosystem driver
presented in pages 11-17 in this report.

                                                                                                                      Modular
                                                                                        Supplier                      producer

                                                                                                    Business design
Share of groups in the data
Knowledge of your end customer
Omnichannel Ecosystem driver
Modular
Supplier producer
Positioning in a digital business model. All the countries (N=924):
Business design
the Netherlands
Finland (N=242) France (N=222) Germany (N=236)
Positioning by country (N=224)
(percentages calculated from
classified respondents) 2019 2021 Change 2019 2021 Change 2019 2021 Change 2019
2021 Change
Omnichannel 47% 48% +1% 32% 36% +4% 29% 37% +8% 31% 36% 5%
Supplier 16% 15% -1% 18% 17% -1% 20% 22% +2% 18% 17% -1%
Ecosystem driver 13% 13% - 19% 14% -5% 17% 19% +2% 24% 17% -7%
Modular producer 25% 23% -2% 30% 33% +3% 30% 21% -9% 26% 30% 4%
Finland: France: Germany: the Netherlands:
48% 13% 36% 14% 37% 19% 36% 17%
15% 23% 17% 33% 22% 21% 17% 30%
Share of omnichannel companies significantly higher in Finland.
Share of suppliers and ecosystem drivers are quite even within all markets, slightly higher in Germany.
Share of modular producers highest in France and the Netherlands.
23% (2019: 24%) of respondents could not be classified due to either non-responses or repeated estimations.Summary
Summary 1/3
- A potentially positive impact of data economy for the own organization is seen by a majority;
  share of those confirming it already did so has declined, probably as competitors could catch up
  in the meantime. All in all, close to 50% of respondents see that data economy could create
  them a competitive edge.
- Generating costs saving is seen as the most important positive outcome. The perception of their
  own role is a bit fuzzy: on average they ‘do participate a bit’ but the largest part denies an active
  role. In general, a widely scattered picture
- Biggest challenge for creating new data-based services based on data is the complexity of
  regulatory framework and lack of competence regarding data economy related business
  models.
- Companies claim to respect client´s privacy and are transparent in how they handle their data,
  but aren´t to generous by returning data or value to their customers
- A Label is welcome by all countries, but share of respondents seeing it as creating an advantage
  declines vs 2019.
- The share of omnichannel players is highest (32-47%), followed by modular producers (21-
  33%), share of ecosystem drivers is lowest (13-19%)
                                                  51
Summary 2/3
Changes in business model during the last two years:
– Overall comparison between different features of business model development depicts these different
themes as having relatively even results: significant changes have been made between by 11-13 percent of
the respondents irrespective of the element examined.
– France is the leader in companies making changes to revenue model, value proposition, partners ja
activities. Similarly, Germany heads the quartet in making changes to companies’ business models as
relates to customers and channels. Finland is the clear front runner in making changes to resources.
Company’s current business operations:
– All surveyed criteria set between 3.0 – 3.9 points. The most valid criteria (in describing current business
operations of the responding companies) is: “our aim is to understand the end customer’s everyday life
so that we can offer them suitable product/service concepts” and the least valid on the other hand: “A
third party (for example resellers / distributors) is responsible for providing our products / services to
end customers”.
– In country comparisons the Netherlands scores highest in seeking to complement own data with
different data sources. France scores highest in e.g. low pricing, third party distribution and platform
compatibility. Finland scores best in end customer understanding and providing for the end customer as
an important part of company’s value chain. Germany scores the lowest on all criteria but one. Finnish
results have increased almost throughout since 2019 whereas results in France and Germany are in
decline in similar fashion. Netherlands goes both ways.
52Summary 3/3
Data economy capabilities:
– Results overall are on relatively similar level between the measured criteria (3.0 – 3.3).
– Highest score is obtained by “Our company has the needed skills to function as an active
member of data economy” and “Our company has taken action to increase customers’
trust related to data collection”. Lowest score is found in: “Our company needs customer
data from other companies”.
– In country comparisons France forms out as the front runner. Finland has the lowest
capabilities (or on par with lowest) in all but one criteria. Yet the development in Finnish
results has been notably positive, i.e. results have significantly increased, especially in the
terms of the perceived positive impact of data-related regulation (+0,3). In France and
Germany the results have declined, some even significantly.
53@sitrafund sitra.fi
You can also read