The future of participating business in a low interest rate environment - Richard Holloway Nigel Knowles 9 November 2012

Page created by John Ferguson
 
CONTINUE READING
The future of participating business in a low interest rate environment - Richard Holloway Nigel Knowles 9 November 2012
The future of participating business
in a low interest rate environment

Richard Holloway

Nigel Knowles

9 November 2012
1
The future of participating business in a low interest rate environment - Richard Holloway Nigel Knowles 9 November 2012
Agenda
   Introduction
   ZIRP
   Managing PRE in a low interest rate environment
   Lessons from Japan
   Solutions for a low interest rate environment

2
The future of participating business in a low interest rate environment - Richard Holloway Nigel Knowles 9 November 2012
Introduction

3
The future of participating business in a low interest rate environment - Richard Holloway Nigel Knowles 9 November 2012
Audience question

    Is there a future for participating
    business in Singapore?

4
The future of participating business in a low interest rate environment - Richard Holloway Nigel Knowles 9 November 2012
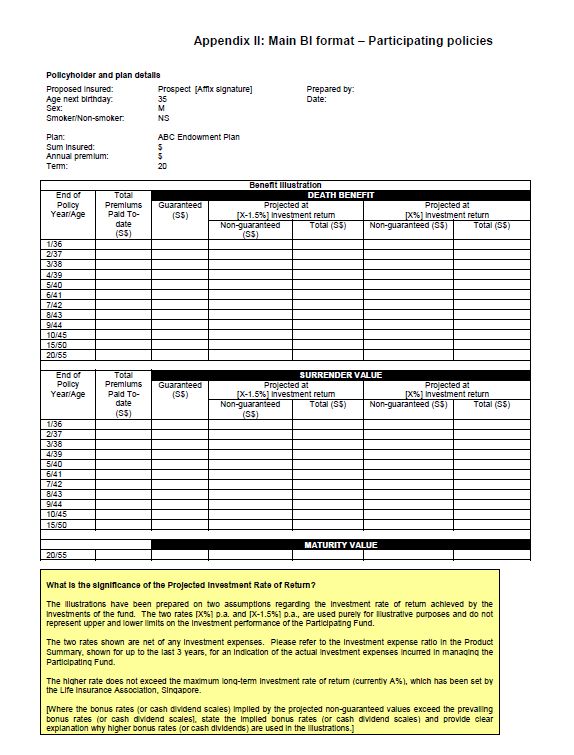
Current market data – Singapore
   The following graph shows the business mix of Singapore’s life insurance
    industry, measured by new business APE:

                                                     Product mix
                                 (Source: Life Insurance Association Singapore www.lia.org.sg)
                       100%

                       90%

                       80%

                       70%
          Percentage

                       60%

                       50%

                       40%

                       30%

                       20%

                       10%

                        0%
                              2007         2008           2009                2010      2011     2012Q2

                                                       Linked    Non-linked

5
The future of participating business in a low interest rate environment - Richard Holloway Nigel Knowles 9 November 2012
Business mix - Prudential Asia
   Prudential 2012 Half Year Results

                                        Hong Kong, Singapore
                                        and Malaysia only

                                        Participating products
                                        increases from around 20%
                                        in 2007 to around 35% in
                                        2012.

                                        Increased focus on health
                                        products

                                        Significant drop in
                                        proportion of linked
                                        business following the
                                        Global Financial Crisis

6
The future of participating business in a low interest rate environment - Richard Holloway Nigel Knowles 9 November 2012
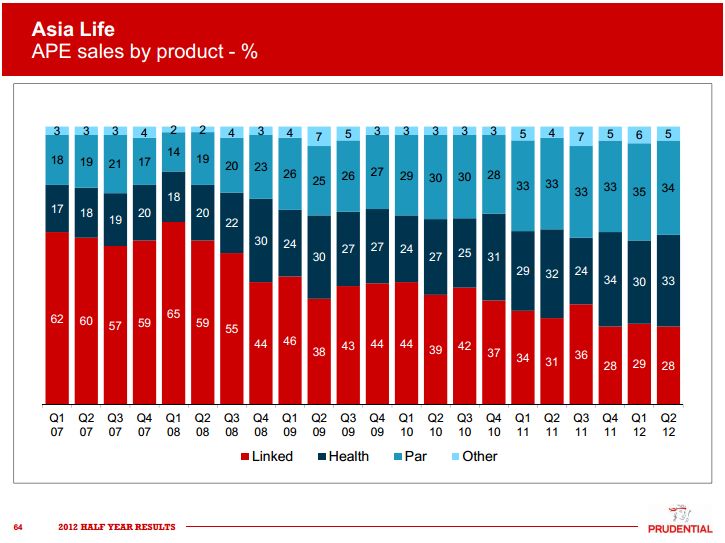
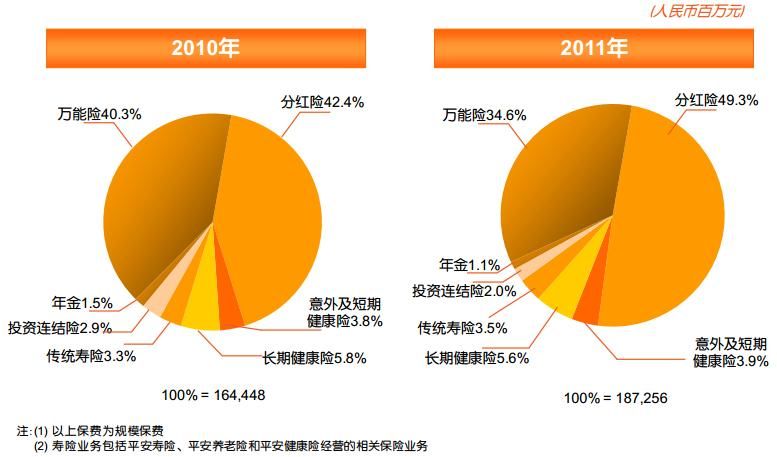
Business mix - Ping An Life
   2011 Year-end results for Ping An Life (all channels)

                                                            Universal life mix drops from
                                                            40% to 35%

                                                            Participating products
                                                            increases from around 20%
                                                            in 2007 to around 35% in
                                                            2012.

                                                            Other lines of business
                                                            remain broadly stable

7
The future of participating business in a low interest rate environment - Richard Holloway Nigel Knowles 9 November 2012
ZIRP

8
The future of participating business in a low interest rate environment - Richard Holloway Nigel Knowles 9 November 2012
Zero interest rate policy (ZIRP)
 On December 16, 2008, the Federal Open
                                                                        Press release Board of Governors of
  Market Committee changed the rules of the                             Federal Reserve System
  game
                                                                        The Federal Open Market Committee
                                                                        decided today to establish a target
                            Federal Funds Rate                          range for the federal funds rate of 0 to
    6.00%
                                                                        1/4 percent.
    5.00%
                                                                        …labor market conditions have
    4.00%                                                               deteriorated, and the available data
    3.00%
                                                                        indicate that consumer spending,
                                                                        business investment, and industrial
    2.00%                                                               production have declined.…Meanwhile,
                                                                        inflationary pressures have diminished
    1.00%
                                                                        appreciably.
    0.00%
       Dec 2002 Apr 2004 Sep 2005 Jan 2007 Jun 2008 Oct 2009 Feb 2011
                                                                        …In particular, the Committee
    Source: wikipedia.org
                                                                        anticipates that weak economic
 We’re still trying to figure out what the new                         conditions are likely to warrant
                                                                        exceptionally low levels of the federal
  rules are                                                             funds rate for some time.

9
The future of participating business in a low interest rate environment - Richard Holloway Nigel Knowles 9 November 2012
ZIRP in US
                Monetary policy is producing low short-term and long-
                                      term rates
                                       10Y Govt Bond Yield   3 Month Govt Bond Yield
         6.00

         5.00

         4.00
     %

         3.00

         2.00

         1.00

                                                                                              0.02          0.1
         0.00
             2005               2006             2008           2009                   2010          2012

         Source: treasury.gov

10
ZIRP in Singapore?

                             10-Year Singapore Govt. Bond Yield
               4.00

               3.50

               3.00

               2.50
     Yield %

               2.00

               1.50

               1.00

               0.50

               0.00
                      Nov

                      Nov

                      Nov

                      Nov

                      Nov
                      May

                      May

                      May

                      May
                      Mar

                      Sep

                      May
                      Mar

                      Sep

                      May
                      Mar

                      Sep

                      Mar

                      Sep

                      Mar

                      Sep

                      Mar

                      Sep
                      Jan

                       Jul

                      Jan

                       Jul

                      Jan

                       Jul

                      Jan

                       Jul

                      Jan

                       Jul

                      Jan

                       Jul
                      2007       2008      2009             2010   2011   2012
     Source: treasury.gov                      Year/Month

11
NIRP in Europe
 Negative interest rates are starting to be observed in some markets

                             Benchmark bond yields 23 July
                              (Source: Thomson Reuters)
               2.5

                 2

               1.5
     Percent

                 1

               0.5

                 0

               -0.5
                      2014            2017                    2022      2044

                                  Germany    Switzerland   Denmark

12
Current market data
           QE is boosting risky asset prices
                                                                                 Equity prices have rallied as
            10Y Govt Bond Yield (LHS)     S&P500 index level (RHS)
    8.00                                                               1800
                                                                                  monetary policy is weakened
    7.00                                                               1600       and QE makes returns on
    6.00                                                               1400
                                                                       1200       bonds unattractive
    5.00
                                                                       1000
%

    4.00
                                                                       800
    3.00
                                                                       600
    2.00                                                               400
    1.00                                                               200
    0.00                                                               0
        2000         2002        2005     2008         2010            QE is boosting risky asset prices
                                                                              CMA DJ CDX North_America XO SEN 5Y
                                                                              CMA ITRAXX European Union XO SEN 5Y

     High yield debt yields have                              1,400
                                                               1,200
      shrunk as investors seek                                 1,000
      higher returns (iTraxx                                    800
                                                         bps

      crossover indices illustrated on                          600
                                                                400
      the right)                                                200
                                                                  0
       Source: Bloomberg, asianbondsonline.adb.org                 2007             2008               2009         2010

13
Current market data
                    250
                               Is the sovereign crisis going to go away soon?
                               Deficit and total debt data from OECD (sized by GDP)
                                                                                                          JP
                    200
     Debt (% GDP)

                                                                                                GR

                    150

                                                                 IT
                                                                                  FR                 US
                    100                                                  Euro
                                                           GE                              SP

                     50
                                        KR

                     -
                          -5                          0                                5                  10
                                                          2012 Deficit (% GDP)

                    Source: Key tables from OECD - ISSN 2074-384x - © OECD 2012

14
Impact on participating business

         Customer                       Re-risking?
         • With low interest            • A participating
           rates the                      product investing
           guaranteed                     predominantly in
           benefits look                  fixed income looks
           unattractive                   very unattractive
         • Do illustrations
           need revising?
                         Shareholder
                         • To the shareholder
                           10% of a small
                           number is a very
                           small number!
                         • MCEV measures
                           in a low
                           interest/high
                           volatility
                           environment?

15
Managing PRE in a low interest rate
environment

16
Product example – Malaysia
              The following product is a typical deferred annuity savings contract
              It is not unusual to see market participants illustrating excess returns above risk-free.
               The following example is from Prudential Malaysia (Prucash premier product)

                               Illustrative cash flows
                                                                                Description            Amount
                                                                                Premium payment term   10 years
                                       Bonus               Gtee
                                                                                Income benefit         20 years = 7% sum
                                                              Maturity                                 assured
                                                                                                       (4% anticipated
                                                                                                       endowment
 Cash flow

                                                                                                       + 3% simple bonus)
                                                                                Maturity benefit       Sum assured
                                                                                                       + Terminal bonus 196%
                                                  Income                                               + Simple bonus 85%
Premium
                                                                                Illustrated return     = 4.9% each year
             0     2   4   6    8 10 12 14 16 18 20 22 24 26 28 30              (company earns 7%)
                                         Year

                 For illustration purpose only, cash flows not drawn to scale

             17
Product example (reversionary bonus) –
Singapore
    The following is an example of typical Singapore (limited pay) endowment assurance with
     terminal bonuses:

                                                          47,754/136,000 = 35% terminal bonus

                                     Annual         Projected Maturity Amount For AIA Smart
                                                    Growth 24                                 Projected
                                     Premium
                                                                                              Return at
                                     (Payable for                 Non-
                                                    Guaranteed                  Total         Maturity
                                     12 years)                    Guaranteed
                                     $6,000         $91,600       $70,340       $161,940      4.4%

                                                                 70,340/91,600 = 77% terminal bonus
18
Product example (cash bonus) – Singapore
    The following is an example of typical Singapore (limited pay) endowment assurances
     with cash dividends:
                                                                                              Annual cash payout:
                                                                                              - 2.25% guaranteed
                                                                                              - 0.8% non-guaranteed

                                Annual         Projected Payment Amount For AIA Gen3      Projected
                                Premium
                                                                                          Investment
                                (Payable for                  Non-
                                               Guaranteed                    Total        Return
                                10 years)                     Guaranteed
                                $79,800        $146,250       $52,000        $198,250     5.25%

                                                 Projected Payment Amount For Great
                                                 Eastern Guaranteed Rewards                 Projected
                                   Single
                                                                                            Investment
                                   Premium                      Non-
                                                 Guaranteed                     Total       Return
                                                                Guaranteed
                                   $50,000       $52,500        $19,000         $71,500     3.80%

19
Product illustrations shaping PRE
    Unlike some other territories, the participating insurance industry has some restrictions in
     terms of advertising of policy returns:

                Pillars of policyholder protection
                         (LIA Guidelines)
               Basis of             Format of             Other general Compliance
               illustration         illustration          requirements and annual
               • to ensure fair     • to ensure that      on benefit    certification
                 and consistent       information         illustrations • By Principal
                 illustrations of     provided is                          Officer and
                 policy benefits      proper, clear and   • Limitations
                                                            regarding      Appointed
                 and charges,         adequate so that                     Actuary
                 particularly         consumers can         wording e.g.
                 benefits and         make an               “risk-free”
                 charges of           informed            • Consequences
                 nonguaranteed        decision              of early
                 nature                                     termination

20
PRE and asset mixes
2011 Par Fund Asset Mix Comparison:

(in SGD
millions)
                 Great Eastern                 AIA               Prudential        Tokio Marine

               Amount     % Mix       Amount         % Mix    Amount     % Mix   Amount    % Mix

  Equities     5,128      27.9%       2,816          19.2%    2,398     21.7%     728      34.0%

    Debt
securities
               7,418      40.3%       10,148         69.3%    7,667     69.3%    1,108     51.8%

  Property     1,356      7.4%         391            2.7%      33       0.3%      85       4.0%

      Loans    1,451      7.9%         365            2.5%     411       3.7%      28       1.3%
 Cash and
  deposits
               2,709      14.7%        379            2.6%     420       3.8%     187       8.7%
       Fixed
      assets
                 69       0.4%          15            0.1%      12       0.1%      2        0.1%
       Other
      assets
                275       1.5%         532            3.6%     120       1.1%      3        0.1%

      TOTAL    18,406    100.0%       14,645         100.0%   11,063     100%    2,142      100%

 21
Product illustrations shaping PRE

 How achievable is 5% in
  the current environment
  of falling yields and given
                                     LIA
  different asset mixes          Guideline
                                investment
 Alternatively, if 5% were        return
                                             5.00%
                                (May 2012
  to be too hard to achieve,       letter)
  how easy is it to change
  bonus rates in practice?

  22
Product illustrations shaping PRE
     Revised Guidelines may help to
      protect policyholders, but
      differences with illustrations for                Arguably a hostile media and the
      other investments remain                           difficulties faced by Equitable Life
                                                         Assurance Society had a greater impact
                                                         on PRE/participating business in the UK
                                                         than any amount of disclosure:

                                                         “…the Financial Services Authority’s (FSA)
                                                         current rules do enough to protect the
                                                         interests of with-profits policyholders.(they)
                                                         allow companies a significant amount of
                                                         discretion to run the funds...”
                                                         www.which.co.uk

                                                         “With-profits endowments and pensions are
                                                         now so widely discredited that cynics dub
                                                         them ‘without-profits’ policies.”
LIA Guidelines on Benefit Illustrations (May 2012)       Daily Telegraph 25 February 2012

 23
Key issues for PRE

     How do I balance the need to protect
     policyholders with the need to make the
     product attractive?
     Will I be able to make bonus cuts
     readily?

     Does transparency help or hinder par
     business?

24
Lessons from Japan

25
Introduction of ZIRP in Japan

 For much of the 1990s, Japan suffered from deflation

                                             CPI YoY
                                     http://www.e-stat.go.jp
                5

                4

                3

                2

                1
     Percent

                0

               -1

               -2

               -3

               -4

                -5
               Jan 1991   Jan 1996          Jan 2001       Jan 2006   Jan 2011

26
Introduction of ZIRP in Japan

 To tackle the deflationary climate, in February 1999, the Policy Board of the
  BOJ embarked on ZIRP
 To manage expectations, the BOJ added that it was committed to ZIRP until
  deflationary concerns had alleviated

                                   Uncollateralised Overnight Rate
              9
              8
              7
              6
        Percent

              5
              4
              3
              2
              1
              0
             07/1985     01/1991         07/1996       12/2001       06/2007   12/2012
     Source: boj.or.jp

27
Impact of ZIRP in Japan

 The impact of deflation and ZIRP on JGB yields has been pronounced

                                   Japan Government Bond Yields
                             JGB 01Y::Yield   JGB 10Y::Yield     JGB 20Y::Yield
                12
                10
                 8
      Percent

                 6
                 4
                 2
                 0
                Jan 1990         Jan 1995      Jan 2000        Jan 2005       Jan 2010
     Source: wikiposit.org

28
Market restructuring

 Faced with persistently low investment returns, the industry found a number of
  solutions including a focus on product strategy, distribution, risk management
  and insolvency(!)
                                      Improved            Gradual
               Deregulation of
                                       financial       implementation
                product and
                                      reporting;           of risk
               price; dramatic
                                       solvency         management
              shift in sales mix
                                    requirements         processes

                                   Staff reductions;
             Rationalisation of                        Growth of new
                                    hiring freezes;
              sales; reduction                          distribution
                                    compensation
             in sales force size                         channels
                                      reductions

                                       Gradual
              Insolvency and                           Dramatic growth
                                     reduction in
              restructuring of                         of well managed
                                    balance sheet
              weaker players                             new entrants
                                         risk

29
Product mix

 The major response has been a shift away from the traditional whole life
  product with riders to interest sensitive products and also towards protection
 Not good for par!

30
Distribution
 Inefficient sales forces have been restructured while professional sales advisor
  channels have flourished
 Is the trouble with par really a trouble with distribution costs?

31
Cost control

 Successful companies have managed costs aggressively
 Mortality profits against the reserving bases have made helpful contributions to
  the bottom line

                                   Japan Life Insurance Overview
                                                       Expense Ratio (LHS)
        14.5%

        14.0%

        13.5%

        13.0%

        12.5%
             2000     2001      2002      2003       2004    2005      2006   2007   2008   2009   2010

       Source: Life Insurance Association of Japan

32
Lessons from Japan

           Product              Costs

                 Distribution

33
Solutions

34
Cost or distribution management: too
demanding?
  Low interest rates are helping to drive the US$ downwards
  Inflation is picking up in many countries which are finding it difficult to
   conduct “normal” domestic monetary policy given the stimulus efforts in
   the United States and Europe
  At the same time agency costs are surprisingly “stubborn” to reduce, but
   agency remains an important component of insurance distribution

                                 Singapore annual Inflation rate (CPI)
                      10.0

                       8.0

                       6.0
            Percent

                       4.0

                       2.0

                       0.0

                      -2.0
                          2000   2002       2004      2006       2008    2010

Source: singstat.gov.sg
35
Cost or distribution management: too
                demanding?         New business APE by distribution channel                                           New business APE by distribution channel
               2,500                                                                                  100%
                                                                                                       90%
               2,000                                                                                   80%
                                                                                                       70%
SGD millions

               1,500                                                                                   60%
                                                                                                       50%
               1,000                                                                                   40%
                                                                                                       30%
                500                                                                                    20%
                                                                                                       10%
                     0                                                                                  0%
                          2005     2006      2007        2008   2009     2010        2011   1H 2012          2005    2006      2007        2008    2009        2010       2011   1H 2012

                         Tied Agents      Bank Distribution     Financial Advisors      Others                Tied Agents     Bank Distribution      Financial Advisors      Others
                           Note: 1H 2012 statistics have been annualized.
                                                                  New business APE by distribution channel based on 1H 2012
                100%
                 90%
                 80%
                 70%
                 60%
                 50%
                 40%
                 30%
                 20%
                 10%
                  0%
                                 AIA             Aviva            AXA         Great Eastern           HSBC      Manulife            NTUC          Prudential      Tokio Marine

                                                  Tied Agents                   Bank Distribution              Financial Advisors                 Others
               Source: Life Insurance Association of Singapore
                36
Product: try something else?

           Non-par         Par

37
Customer: Is high equity exposure the
answer?
 How do we earn 5% (or should
  we be aiming higher?)
 The impact of higher equity                   Attractive product
  exposure on risk management                     needs equity
                                                    exposure?
  (capital requirements) and on
  risk adjusted profitability
  measures (MCEV) may be
  unattractive?
 High equity exposure dictates
  low guarantees and ideally a     Deferral of bonus       High equity exposure
                                   equals deferral of         demands lower
  greater weighting towards          shareholder            guarantees and/or
  terminal bonus. Does this work      dividend?             deferral of bonus?
  from a customer perspective?
 High terminal bonus weighting
  delays the emergence of
  shareholder profits
38
Product: unitised with-profits?
 Many unitised savings contracts in the
  United Kingdom are written as unitised
  with-profits
                                                              Product wrapper
 This is effectively a “fund option” inside a
                                                                 (non-par)
  linked master wrapper
 The policyholder
                                                                                Unitised
 – enjoys a 100/0 investment return subject to                Unit-linked
                                                                               with-profit
   smoothing
 – enjoys pooling of asset risk with other participating
   policies and the existing inherited estate
 – benefits from guaranteed claim values at
   maturity/death                                          Expense          Risk
 – and pays for explicit protection and expense charges    charge           benefit
   just like a normal linked product                                        charge
 The shareholder
 – enjoys a transparent charging structure, which may                Shareholder
   be profitable under market consistent measures
 – gets paid for providing risk capital to support
   insurance risk not paid for “borrowing” existing par
   fund capital
 39
Product: unitised with-profits?
 Participating funds work well for the
  exercise of discretion and in              Variable
                                                          Par
  particular the pooling of risk between   annuity/CPPI
  generations
 Alternatives like variable annuity
  products might work to provide some
  of the benefits of UWP in a cost
  effective manner (but not pooling)
 The Insurance Act (revised 2002) in
  Singapore requires separate funds to
  be established for separate policies
  defined to be “investment-linked”,
  “participating” or “non-participating”
 In the United Kingdom, many of these
  hybrid policies are written as linked
  policies with a reinsurance into the
  participating fund
 40
Audience question

     Is there a future for participating
     business in Singapore?

41
Disclaimer
 This presentation is intended solely for educational purposes and
 presents information of a general nature. It is not intended to guide or
 determine any specific individual situation and persons should consult
 qualified professionals before taking specific actions. Neither the
 presenters, nor the presenters’ employer, shall have any responsibility or
 liability to any person or entity with respect to damages alleged to have
 been caused directly or indirectly by the content of this presentation.

42
Contact Information

Richard Holloway FSAS FIA
Managing Director
South East Asia & India Life
Milliman Singapore
Tel     +65 6327 2301
Mobile +65 9732 0150
Email richard.holloway@milliman.com

Nigel Knowles FFA
Principal & Consulting Actuary
Milliman Hong Kong
Tel     +852 2152 3808
Mobile +852 5 9686 3757
Email nigel.knowles@milliman.com

43
You can also read