The COVID-19 Pandemic in the Emerald Coast region and Florida: An Economic Impact Assessment, May 2021 - Emerald Coast ...
←
→
Page content transcription
If your browser does not render page correctly, please read the page content below
Emerald Coast Regional Council
                                                                          Regional Economic Analysis Program
                                                                                Featuring REMI Policy Insight®

The COVID-19 Pandemic in the Emerald Coast region and Florida: An Economic Impact Assessment, May 2021

About the Emerald Coast Regional Council (ECRC)
ECRC supports northwest Florida by planning for and coordinating intergovernmental solutions to growth-
related problems, providing technical assistance to local governments, and meeting the needs of the
municipalities in our seven-county region: Escambia, Santa Rosa, Okaloosa, Walton, Bay, Washington, and
Holmes.

The mission of the Emerald Coast Regional Council is to preserve and enhance the quality of life in northwest Florida
by providing professional technical assistance, planning, coordinating, and advisory services to local governments,
state and federal agencies, and the public.

About the Tampa Bay Regional Planning Council (TBRPC)
The TBRPC supports local government initiatives and projects with planning services and economic analysis
throughout Florida.

The TBRPC provides economic analysis services through the Tampa Bay Economic Development District and the
Regional Economic Analysis Program. TBRPC uses state-of-the-art computable general equilibrium and input-
output models to assist its partner agencies in assessing the impacts of potential job-creating projects and
investments, as well as the economic analysis of environmental and public policy issues.

Executive Summary
Coronavirus disease (Covid-19) is a novel infectious respiratory disease that spreads from person to person and
has infected more than 2.3 million people and caused more than 37,000 deaths in Florida as of June 1, 2021.1
Because of the number of Covid-19 cases and deaths in the state, Florida has vaccinated over 10 million people as
of May 23, 2021.2 The United States and Florida have enforced social distancing and economic shutdowns to stop
the spread of the disease. In March 2020, economic shutdowns from Covid-19 caused the U.S. gross domestic
product (GDP) to contract by 9.5% (a -33% annualized rate of change) and the unemployment rate to increase to
14.8% (a 10% increase) in one quarter. Since the initial peak of the Covid-19 crisis, the GDP expanded by 8.5% (a
38% annualized rate of change) in Q1 2020. In Q1 2021, the GDP increased by 2.6% (an 11% annualized rate of
change).3 In April 2021, the unemployment rate was 6.1% which is 4% higher than the level prior to Covid-19.4

Stay-at-home orders, closures of non-essential businesses, and severe travel restrictions due to Covid-19 have
had a severe impact on employment in Florida. In Emerald Coast, the Covid-19 impacts were more modest than
the rest of the state. Jobs in Bay, Escambia, Holmes, Okaloosa, Santa Rosa, Walton, and Washington counties
decreased by about 39,000 (-9%) during the peak of the Covid-19 crisis from Q3 – Q4 2020. However, many of the
individuals that were laid off due to Covid-19 have returned to work, and more individuals have entered the labor
force through 2020 and 2021. Over 50,000 (13%) jobs have returned from Q1 2020 – Q3 2021.5

1
  https://floridahealthcovid19.gov/#latest-stats
2
  https://floridahealthcovid19.gov/vaccines/
3
  https://fred.stlouisfed.org/series/GDP
4
  https://www.bls.gov/news.release/pdf/empsit.pdf
5
  https://www.bls.gov/lau/#tables
2 Social distancing and employment changes also have had a large impact on mobility. In May 2020, three of the most notable mobility changes were visits to parks, workplaces, retail and recreation, and residential locations in Florida. The changes to mobility are compared to the baseline month, which is the normal value for that month calculated by Google based on medium values from previous periods before the Covid-19 shutdown. Unlike the rest of Florida, Emerald Coast counties have had large increases in most mobility categories in May 2021 compared to the base month. In May 2021, average mobility in retail and recreation increased 31% in Bay, 17% in Okaloosa, and 37% in Walton counties compared to the base month. In May 2021, average mobility in parks increased 93% in Bay, 52% in Escambia, 149% in Okaloosa, and 103% in Walton counties compared to the base month.6 The job loss during Covid-19 caused decreases in consumer spending throughout Florida. Taxable sales numbers decreased modestly from Q3 to Q4 2020 in some Emerald Coast counties, like Escambia County, where there was over $147 million (-10%) decrease in sales in Q4 2020.7 Most Emerald Coast counties’ retail sales decrease again in Q2 2020. The counties that saw the largest drops in Q2 2020 were Bay county with over $332 million (-22%) decrease, Okaloosa county with over $256 million (-17%) decrease, and Walton county with over $325 million (- 32%) decrease. The total taxable sales for Emerald Coast were over $20 billion in 2020. Comparing the total taxable sales in 2020 to the corresponding total taxable sales in 2019 shows a decrease of $58 million (-0.3%) in 2020. Accordingly, even though Emerald Coast’s taxable sales did not decrease as quickly in Q4 as the rest of Florida, many of the counties were hit with a second decrease in sales in Q4 2020. Recovery forecasts have become more optimistic in recent months. The Conference Board, a nonprofit entity that provides reports to help the global business community navigate current economic, health, and social events, predicts that U.S. gross domestic product (GDP) will rise 6.4 percent in 2021. Increases in consumer spending, increasing vaccination rates, reopenings, and the CARES Act III aid will cause this rapid expansion.8 The Federal Reserve Bank of San Francisco expects U.S. gross domestic product (GDP) to increase by 6.6% in 2021.9 TBRPC analyzed the direct and indirect impacts caused by jobs lost from Covid-19 and projects the future recovery of those jobs in Escambia, Santa Rosa, Okaloosa, Walton, Bay, Washington, and Holmes. TBRPC used the REMI (Regional Economic Models, Inc) PI+ model to project Emerald Coast counties’ future economic recovery based on jobs lost and gained in 2020 and 2021. This scenario indicates that Covid-19 directly reduced 26,082 jobs (-5%) in Emerald Coast in 2020, which increased gross domestic product (GDP) by about $330 million (0.6%). Since vaccinations and reopenings continue to happen throughout 2021, Emerald Coast counties will recover 21,908 jobs (4%) in 2021 compared to 2020, which are estimated to increase the region’s gross domestic product (GDP) by $3 billion (7%) in 2021. Although the Emerald Coast economy is recovering, Covid-19 has slowed the job growth of the region. The REMI Model estimates that total employment is still 17,381 jobs (-3%) below what employment levels were supposed to reach before the pandemic. About Covid-19 Coronavirus disease (Covid-19) is a novel, highly contagious respiratory disease. Covid-19 symptoms include fever, cough, difficulty breathing, and loss of taste or smell, and symptoms can range from being very mild to potentially deadly. Older adults and people with severe underlying medical conditions are at higher risk for developing more serious complications from Covid-19. 6 https://www.google.com/covid19/mobility/ 7 https://floridarevenue.com/taxes/taxesfees/Pages/sales_tax.aspx 8 https://conference-board.org/research/us-forecast 9 https://www.frbsf.org/economic-research/publications/fedviews/2021/april/april-8-2021/
3

Covid-19 has infected more than 33 million people and killed more than 592,000 people in the U.S.10 According to
the Florida Department of Health, more than 2.3 million people have been diagnosed with Covid-19 in Florida.
The disease has caused over 37,000 deaths as of June 1, 2021. Vaccinations are a critical resource for preventing
the further spread of Covid-19 and allowing Floridians to return to their regular pace of life. According to the
Florida Department of Health, 10 million people have received vaccinations in Florida as of May 23, 2021.

U.S. health officials encouraged social distancing beginning in early March 2020 to stem the spread of the virus,
and large segments of the economy shut down or shifted to remote operation.11 Social distancing drive impacts to
consumer spending and business productivity as well as supply chain disruptions. Shutdowns caused sharp
declines in travel, retail sales, medical appointments, and many other activities and increases in layoffs. This halt
in travel and consumption and the increase in unemployment have generated indirect impacts on the service
economy and severe fiscal impacts on state and local governments.

Pandemic-related Impacts on the U.S. economy broke historical records earlier last year. In Q4 of 2020, the U.S.
gross domestic product (GDP) contracted by 9.5% (a -33% annualized rate of change), and the unemployment
rate increased to 14.8 (a 10% increase) in one quarter. Since the initial peak of the Covid-19 crisis, the GDP
expanded by 8.5% (a 38% annualized rate of change) in Q1 2020. In Q1 2021, GDP increase 2.6% (an 11%
annualized rate of change).12 In April 2021, the unemployment rate was 6.1% which is 4% higher than the level
prior to Covid-19.13

Figure 1: Gross Domestic Product (GDP)

Source: Federal Reserve Band of St. Louis (FRED),1947-2021. https://fred.stlouisfed.org/series/GDP

The Conference Board released the U.S. Economic Outlook with three forecasts for the U.S. economy on March
10, 2021. In the base case forecast, the Conference Board projects that employment will rebound through
consumption and that U.S. gross domestic product (GDP) will rise 6.4% in 2021.14 Similarly, the Federal Reserve
Bank of San Francisco (FRBSF) expects a year-to-year U.S. gross domestic product (GDP) growth of 6.6% in 2021

10
   https://covid.cdc.gov/covid-data-tracker/#datatracker-home
11
   https://www.healthaffairs.org/
12
   https://fred.stlouisfed.org/series/GDP
13
   https://www.bls.gov/news.release/pdf/empsit.pdf
14
   https://conference-board.org/research/us-forecast
4

  and the U.S. to return to pre-pandemic levels by 2022 and 202315. The Conference Board and FRBSF add that the
  increase in job growth further supports the economic recovery claims and will further compound the recovery in
  employment and gross domestic product (GDP).

  The Emerald Coast Regional Council (ECRC), in partnership with the Tampa Bay Regional Planning Council
  (TBRPC), prepared an analysis of Covid-19’s economic impacts and the future recovery for Bay, Escambia,
  Holmes, Okaloosa, Santa Rosa, Walton, and Washington counties with updates as the situation develops. This
  report discusses pandemic impacts on Emerald Coast employment and consumer spending, a summary of the
  current situation, and a look at the near future.

  Job Changes Due to Covid-19
  In Florida, Covid-19 had a severe impact on employment. In Emerald Coast, Covid-19 had an impact on
  employment in Q3 and Q4 2020, but the impacts were more modest than the rest of the state. Using U.S. Bureau
  of Labor Q3 2020 employment data, jobs in Bay, Escambia, Holmes, Okaloosa, Santa Rosa, Walton, and
  Washington counties decreased by about 39,000 (-9%) during the peak of the Covid-19 crisis from Q3 – Q4 2020.
  However, many of the individuals unemployed during the Covid-19 shutdown are returning to work. Over 50,000
  (13%) jobs have returned from Q1 2020 – Q3 2021.16 Table 1 summarizes the change in the number of jobs from
  January 2020 through March 2021 by quarter and county.

  Table 1: Change in Jobs by Quarter and County
 County              Q3/20               Q4/20              Q1/20             Q2/20             Q3/21        Total Job Change
   Bay           627       1%      -5,036      -6%     4,113    6% -1,646       -2% 5,969             8%      4,027          5%
Escambia        -307      0.2%    -14,726 -10% 10,124 8%                362     0.3% 5,486            4%       939           1%
 Holmes         26        0.4%      -677      -10%      449     7%      34       1%    199            3%        31          0.5%
 Okaloosa     1,291       1%       -8,285      -9%     4,860    6% -1,055       -1%   6,167           7%      2,978          3%
Santa Rosa     -347     -0.4%      -8,223     -10%     5,793    8%      209     0.3% 4,482            6%      1,914          2%
  Walton        414       1%       -2,790      -9%     1,571    6%     -268     -1%   2,694           9%      1,621          5%
Washington      20       0.2%       -956      -10%      642     8%      -38    -0.4%   465            5%       133           1%
   Total      1,724      0.4%     -40,693      -9%    27,552 7% -2,402 -1% 25,462                     6%      11,643         3%
  Source: U.S. Bureau of Labor Statistics, 2020-2021. https://www.bls.gov/lau/#tables

  As seen in Table 1, Bay, Escambia, Holmes, Okaloosa, Santa Rosa, Walton, and Washington counties have about
  11,643 more jobs (3%) at the end of Q3 2021 than before the Covid-19 economic shutdown in Q3 2020. The U.S.
  Bureau of Labor Statistics data indicate that many people who were laid off due to Covid-19 have returned to
  work, and even more have entered the labor force through 2020 and 2021. Changes in employment cause
  changes in mobility and consumption. For example, as businesses hire employees back, more people will travel to
  work and have disposable income to spend. When people start spending more money, businesses compound the
  recovery in employment by hiring more employees to account for increased demand for services and goods as
  consumption increases.

  Mobility as an Indicator of the Economy After Covid-19
  Social distancing, a mostly voluntary minimization of contact between members of the public to stem the
  infection rate of the disease, was encouraged across the country beginning in March 2020. Social distancing
  caused an unprecedented shift in mobility, with significant reductions in the use of transit stations, trips to retail,

  15
       https://www.frbsf.org/economic-research/publications/fedviews/2021/april/april-8-2021/
  16
       https://www.bls.gov/lau/#tables
5
recreation, workplaces, and to see family and friends. Using cell phone location history data collected by Google
Maps and made publicly available by Google, Table 2 summarizes the percent change in trips to location types in
May 2020 and 2021.
Table 2: Google Mobility Change by Percentage for May 2020 & 2021 in the U.S., Florida, & ECRPC Counties
Category Year Nation State Counties
United Florida Bay Escambia Holmes Okaloosa Santa Walton Washington
States Rosa
Retail & 2020 -27% -30% -0.5% -13% * -8% 3% -5% -10%
Recreation 2021 -5% -9% 31% -0.2% * 17% 9% 37% 5%
Grocery & 2020 -4% -12% -11% 5% * 6% 11% 8% 16%
Pharmacy 2021 3% -2% 33% 6% * 17% 16% 30% 17%
Parks 2020 22% -26% 45% 62% * 71% 71% 39% *
2021 36% -7% 93% 52% * 149% 49% 103% *
Transit 2020 -38% -48% -16% -19% * -26% * -3% *
Stations 2021 -20% -19% 33% 6% * 53% * 34% *
Workplaces 2020 -37% -35% -21% -27% -18% -26% -26% -22% -20%
2021 -23% -22% -9% -22% -10% -16% -12% -9% -10%
Residential 2020 13% 13% 7% 9% * 9% 9% 6% *
2021 4% 4% 1% 3% * 1% 3% -1% *
Source: Google Mobility, 2020-2021. https://www.google.com/covid19/mobility/
*Not enough data
In May 2020, three of the most notable mobility changes were visits to parks, workplaces, retail and recreation,
and residential locations in Florida. The changes to mobility are compared to the baseline month, which is the
normal value for that month calculated by Google based on medium values from previous periods before the
Covid-19 shutdown. In May 2020, the average workplace mobility decreased 35% compared to the base month,
and the average retail and recreation mobility decreased 30% compared to the base month. In May 2020, the
average mobility to residential locations increased 13% compared to the base month, and the average mobility to
parks decreased 26% compared to the base month. In May 2021, Florida has seen increased employment and
loosening social distancing restrictions, but there are still notable mobility changes. Average workplace mobility
decreased 22% compared to the base month, and average retail and recreation mobility decreased 9%. In May
2021, average mobility in residential locations increased 4% compared to the base month. Although there are still
decreases in mobility across many categories of places in Florida, decreases in mobility are becoming more and
more modest.
The counties in the Emerald Coast region saw decreases in mobility in May 2020. However, unlike the rest of
Florida, Emerald Coast counties are seeing large increases in most mobility categories like retail and recreation,
grocery and pharmacy, and parks in May 2021 compared to the base month. In May 2021, average mobility in
retail and recreation increased 31% in Bay, 17% in Okaloosa, and 37% in Walton counties compared to the base
month. In May 2021, average mobility in parks increased 93% in Bay, 52% in Escambia, 149% in Okaloosa, and
103% in Walton counties compared to the base month.6
Changes to Taxable Sales Due to Covid-19
The jobs lost from Covid-19 and the decreases in mobility to retail and recreation, among other places, caused a
shift in sales patterns in Emerald Coast. From Q3 – Q4 2020, there was a sharp decline in consumption across all
categories aside from home utilities, such as plumbing, electrical, and air-conditioning services. However, since
Q1 2020, spending has increased across all counties. Decreasing unemployment throughout the counties is
causing this increase in consumption because as more people return to work, more people have disposable
income to spend.
Table 3 indicates the Florida Department of Revenue 2019 and 2020 taxable sales numbers for Bay, Escambia,
Holmes, Okaloosa, Santa Rosa, Walton, and Washington counties by quarter. Table 4 shows the change in taxable
sales numbers by quarter in each county over 2020.
Table 3: 2020/2019 Emerald Coast Taxable Sales in Millions of Dollars
County Q3/20 Q4 /20 Q1/21 Q2/21 Total in Total in
Difference in
2020 2019
Sales from 2019
to 2020
Bay $1,019 $969 $1,511 $1,179 $4,678 $4,991 -$313 -6%
Escambia $1,518 $1,370 $1,644 $1,607 $6,139 $6,086 $52 1%
Holmes $23 $23 $33 $23 $102 $84 $18 21%
Okaloosa $1,023 $998 $1,536 $1,280 $4,837 $4,847 -$10 -0.2%
Santa Rosa $448 $441 $528 $506 $1,924 $1,721 $202 12%
Walton $449 $456 $1,025 $700 $2,630 $2,604 $26 1%
Washington $46 $45 $48 $46 $170 $205 -$35 -17%
Source: Florida Department of Revenue,2020. https://floridarevenue.com/taxes/taxesfees/Pages/sales_tax.aspx.
*Currency figures in current $
Table 4: Emerald Coast Changes in Taxable Sales by quarter in 2020 in Millions of Dollars
County Q3/20 Q4/20 Q1/20 Q2/21 Total Change in
Sales in 2020
Bay -$65 -6% -$50 -5% $542 56% -$332 -22% -$36 -10%
Escambia $61 4% -$147 -10% $273 20% -$37 -2% -$80 -13%
Holmes $3 17% -$0.1 -0.4% $11 47% -$10 -30% -$1 -11%
Okaloosa -$72 -7% -$25 -2% $537 54% -$256 -17% -$8 -2%
Santa Rosa $40 10% -$7 -1% $87 20% -$23 -4% -$4 -2%
Walton -$89 -17% $6 1% $569 125% -$325 -32% $32 21%
Washington $2 4% -$1 -2% $3 6% -$2 -3% -$5 -23%
Source: Florida Department of Revenue,2020. https://floridarevenue.com/taxes/taxesfees/Pages/sales_tax.aspx.
*Currency figures in current $
The data show that, unlike most of Florida, taxable sales numbers decreased modestly from Q3 to Q4 2020 in
some counties, like Escambia County, where there was over $147 million (-10%) decrease in sales in Q4 2020. 17
After the initial sales decrease in Q4 2020, most counties’ retail sales decrease again in Q2 2021. The counties
that saw the biggest drops in Q2 2021 were Bay with over $332 million (-22%) decrease, Okaloosa with over $256
17
https://floridarevenue.com/taxes/taxesfees/Pages/sales_tax.aspx7 million (-17%) decrease, and Walton with over $325 million (-32%) decrease. The total taxable sales for Emerald Coast were over $20 billion in 2020. Comparing the total taxable sales in 2020 to the corresponding total taxable sales in 2019 shows a decrease of $58 million (-0.3%) in 2020. Accordingly, even though Emerald Coast’s taxable sales did not decrease as quickly in Q4 2020 as the rest of Florida, many counties were hit with a second decrease in sales in Q2 2021. Since Q4 2020, there is a general trend of increased spending that is beneficial for the region. As people spend, they generate activity that is likely to encourage job growth, which will ease the unemployment gap created by Covid-19 and further compound the consumption benefits as those that gained jobs now consume more. Therefore, TBRPC anticipates that the increase in employment and spending, seen at the end of 2020 for the rest of Florida, will continue through 2021 for Emerald Coast. Timing of a Recovery in the U.S. The Conference Board released a U.S. Economic Outlook with three forecasts for the U.S. economy on March 10, 2021. In the base case forecast, the Conference Board projects that employment will rebound through consumption and that gross domestic product (GDP) will rise 6.4 percent in 2021.18 This forecast assumes that Covid-19 cases will decrease and that social distancing restrictions will be eliminated in the first quarter of 2021. The Conference Board forecast also assumes that vaccinations will be widely available by early 2021 and universally available by early 2022. Figure 2 shows the U.S. Economic Outlook with the three forecast scenarios. The base case scenario described above is the black, extended line. TBRPC will analyze the direct and indirect job loss using an employment change scenario like the base case scenario. Figure 2: The Conference Board U.S. Economic Outlook Source: The Conference Board Base Case Economic Outlook, 2019-2020-2021. https://conference- board.org/research/us-forecast REMI Analysis of Employment Change This analysis of direct and indirect job loss impacts from Covid-19 projected the future recovery of jobs in Bay, Escambia, Holmes, Okaloosa, Santa Rosa, Walton, and Washington counties using the REMI Model. The SFRPC and the TBRPC used a Pre-Covid-19 baseline forecast as a control. The Pre-Covid-19 Baseline is not an official REMI forecast but could be used as a reasonable baseline, assuming COVID-19 never happened. To account for the impacts of Covid-19, Tampa Bay Regional Planning Council (TBRPC) used the March RSQE 2021 updated 18 https://conference-board.org/research/us-forecast
8

national forecast. The March RSQE 2021 Forecast is based on the 2019-2020 historical data from the U.S. Bureau
of Economic Analysis released on January 28, 2021, The U.S. Economic Outlook for 2020-2022 from the University
of Michigan’s Research Seminar in Quantitative Economics (RSQE) released on February 19, 2021, and The Budget
and Economic Outlook: 2021 to 2031 from CBO released in January and February 2021.

The March RSQE 2021 Update represents the economic impacts across the nation caused by Covid-19 and the
forecasted recovery. This scenario indicates that Covid-19 reduced 26,082 jobs (-5%) in Emerald Coast in 2020,
which increased regional gross domestic product (GDP) by about $330 million (0.6%). Since vaccinations and
reopening continue to happen throughout 2021, Emerald Coast counties will recover 21,908 jobs (4%) in 2021,
which are estimated to increase the region’s gross domestic product (GDP) by $3 billion (7%) in 2021. Although
Emerald Coast’s economy is recovering, Covid-19 has slowed the job growth in the area.

Tables 5, 6, 7, and 8 present the differences between the March RSQE 2021 forecasted results and the Pre-Covid-
19 forecasted results. In other words, the differences show how much Covid-19 slowed economic growth. Covid-
19 reduced total employment by 33,671 (-6%) less in 2020 than was expected before Covid-19, which resulted in
the gross domestic product (GDP) being $1 billion (-3%) below the forecasted gross domestic product (GDP)
before Covid-19.

Job loss usually has a compounded impact on the economy because as individuals lose jobs, individuals lose
income and cannot consume and contribute to gross domestic product (GDP). When individuals no longer have
the income to spend, demand for goods decreases, and more jobs are lost. Although Emerald Coast’s counties
will recover 21,908 (4%) in 2021, the REMI Model estimates that total employment is still 17,381 jobs (-3%) below
what employment levels were supposed to reach before the pandemic. Although the area is still seeing a
decrease in unemployment, Emerald Coast gross domestic product (GDP) will be 129 million (0.2%) more in 2021
than was expected before Covid-19.

 Table 5: Summary of Employment Loss in 2020 (REMI)
                                                                                          Counties
    Category             Units              Bay                  Escambia           Holmes             Okaloosa
Total Employment     Individual        -6,047     -5%        -11,348     -6%      -438    7%         -5,978     -4%
                       (Jobs)
 Labor Force*        Individual       -512       -0.6%      -1,018       -0.7%     -78     -1%       -336        -0.3%
                       (Jobs)
Gross Domestic      Millions of      -$196        -2%        -$482        -3%     -$14     -4%       -$260       -1%
    Product       Current Dollars
Personal Income     Millions of       $446         5%         $542        4%       $8      1%        $370         3%
                  Current Dollars
Source: TBRPC REMI PI+ (2021) *Currency Figures in current $
9
Table 6: Summary of Employment Loss in 2020 (REMI)
Counties
Category Units Santa Rosa Walton Washington Total
Total Employment Individual -4,983 -8% -4,223 -10% -654 -7% -33,671 -6%
(Jobs)
Labor Force* Individual -1,032 -1% -595 -2% -101 -1% -3,672 -1%
(Jobs)
Gross Domestic Millions of -$209 -4% -$266 -8% -$26 -4% -$1,347 -3%
Product Current Dollars
Personal Income Millions of $180 2% $2 0.03% $31 4% $1,589 3%
Current Dollars
Source: TBRPC REMI PI+ (2021) *Currency Figures in current $
Table 7: Summary of Employment Loss in 2021 (REMI)
Counties
Category Units Bay Escambia Holmes Okaloosa
Total Employment Individual -2,789 -2% -402,070 -23% 792 1% -581,848 -19%
(Jobs)
Labor Force* Individual -166 -0.2% -109,710 -8% 78 0.2% -167,235 -7%
(Jobs)
Gross Domestic Millions of -$108 1% -$37,569 -23% $77 2% -$53,851 -19%
Product Current Dollars
Personal Income Millions of -$591 -7% -$21,006 -13% -$5 -0.1% -$31,607 -12%
Current Dollars
Source: TBRPC REMI PI+ (2021) *Currency Figures in current $
Table 8: Summary of Employment Loss in 2021 (REMI)
Counties
Category Units Santa Rosa Walton Washington Total
Total Employment Individual -3,005 -4% -2,974 -7% -377 -4% -17,381 -3%
(Jobs)
Labor Force* Individual -921 -1% -642 -2% 78 1% -2,230 -5%
(Jobs)
Gross Domestic Millions of -$59 -1% -$177 -5% -$5 -1% $129 0.2%
Product Current Dollars
Personal Income Millions of $339 4% $50 1% $57 7% $2,497 5%
Current Dollars
Source: TBRPC REMI PI+ (2021) *Currency Figures in current $
*The number of people in the labor force, i.e., employed or seeking work; calculated with participation rates by
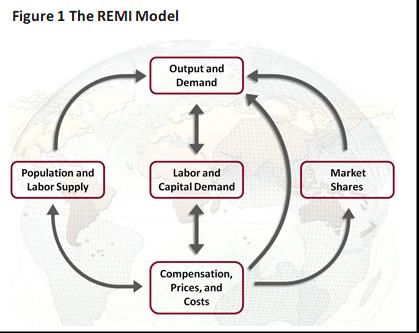
age cohort. Other Definitions found in Appendix.10 Summary and Conclusions As residents receive Covid-19 vaccinations across Florida and pandemic restrictions are loosened, a recovery in both jobs and sales in the Emerald Coast counties is apparent. With increased employment, persons will now have a disposable income, and consumption will increase throughout the region. The compounded economic impacts from increased employment and consumption will further help Bay, Escambia, Holmes, Okaloosa, Santa Rosa, Walton, and Washington counties recover through 2021. TBRPC staff will be awaiting future data to watch for trends as they develop. Appendix: About REMI PI+ REMI PI+ is an economic modeling tool that supports economic and demographic analysis of many different policy issues. In this case, TBRPC used REMI PI+ to analyze how COVID-19 impacts the Tampa Bay Area and Florida economies. The REMI model builds upon decades of research and various data sources, econometric models, and an input-output model that tracks the flow of spending through the economy from consumer or producer spending to all other sectors of the economy. REMI PI+ Model Structure Figure 1 depicts the interactions within the REMI model among five economic “blocks.” Imagine a factory (the Output block) that sells to all the sectors of final demand as well as to other industries. The Labor and Capital Demand block shows how labor and capital requirements depend both on output and their relative costs. Population and Labor Supply are shown as contributing to demand and to wage determination in the product and labor market. The feedback from this market shows that economic migrants respond to labor market conditions. Demand and supply interact in the Wage, Price and Profit block. Once prices and profits are established, they determine market shares, which along with components of demand, determine output. The REMI model brings together all the above elements to determine the value of each of the variables in the model for each year in the baseline forecasts. The model includes all the inter-industry relationships that are in an input-output model in the Output block but goes well beyond the input-output model by including the relationships in all the other blocks shown in figure 5.4. In order to broaden the model beyond the standard Input-Output methodology, it was necessary to estimate key relationships. This was accomplished by using extensive data sets covering all areas in the country. These large data sets and decades of research effort have enabled REMI to simultaneously maintain a theoretically sound model structure and build a model based on all the relevant data available. The model has strong dynamic properties, which means that it forecasts not only what will happen but when it will happen. This results in long-term predictions that have general equilibrium properties, which means that the
11

long-term properties of general equilibrium models are preserved without sacrificing the accuracy of event timing
predictions and without simply taking elasticity estimates from secondary sources.

Glossary
Employment - estimates of the number of jobs, full-time plus part-time, by place of work for all industries. Full-
time and part-time jobs are counted at equal weight. Employees, sole proprietors, and active partners are
included, but unpaid family workers and volunteers are not included.
Total Labor force- The number of people in the labor force, i.e., employed or seeking work; calculated with
participation rates by age cohort.
Personal Income - Income received by persons from all sources. It includes income received from participation in
production as well as from government and business transfer payments
Gross Domestic Product - The market value of goods and services produced by labor and property in the United
States, regardless of nationality.
Taxable sales number - Total revenue divided by one plus your local sales tax amount.

       Prepared by Jamie Neville, Florida Statewide Economic Analyst, on 6/15/21 using REMI PI+, Press Contact:
                                                                 Wren Krahl, wren@tbrpc.org, 727-570-5151 x 22
You can also read