The Good Credit Index - Sacha Hilhorst Elliot Jones July 2019 - Demos
←
→
Page content transcription
If your browser does not render page correctly, please read the page content below
The Good Credit Index

Sacha Hilhorst
Elliot Jones

July 2019
Demos is a champion of people, ideas and democracy. We bring people together. We
bridge divides. We listen and we understand. We are practical about the problems we
face, but endlessly optimistic and ambitious about our capacity, together, to over-come
them.

At a crossroads in Britain’s history, we need ideas for renewal, reconnection and the
restoration of hope. Challenges from populism to climate change remain unsolved,
and a technological revolution dawns, but the centre of politics has been intellectually
paralysed. Demos will change that. We can counter the impossible promises of the
political extremes, and challenge despair – by bringing to life an aspirational narrative
about the future of Britain that is rooted in the hopes and ambitions of people from
across our country.

Demos is an independent, educational charity, registered in England and Wales.
(Charity Registration no. 1042046)

Find out more at www.demos.co.uk
As the publisher of this work, Demos wants to encourage the circulation of our work
as widely as possible while retaining the copyright. We therefore have an open access
policy which enables anyone to access our content online without charge. Anyone can
download, save, perform or distribute this work in any format, including translation,
without written permission. Its main conditions are:

    •   Demos and the author(s) are credited
    •   This summary and the address www.demos.co.uk are displayed
    •   The text is not altered and is used in full
    •   The work is not resold
    •   A copy of the work or link to its use online is sent to Demos.

You are welcome to ask for permission to use this work for purposes other than those
covered by the licence. Demos gratefully acknowledges the work of Creative Commons
in inspiring our approach to copyright. To find out more go to www.creativecommons.org

This project was made possible thanks to a generous grant from NewDay.

Published by Demos July 2019.

© Demos.
Some rights reserved.
76 Vincent Square
London, SW1P 2PD
T: 020 3878 3955
hello@demos.co.uk
www.demos.co.uk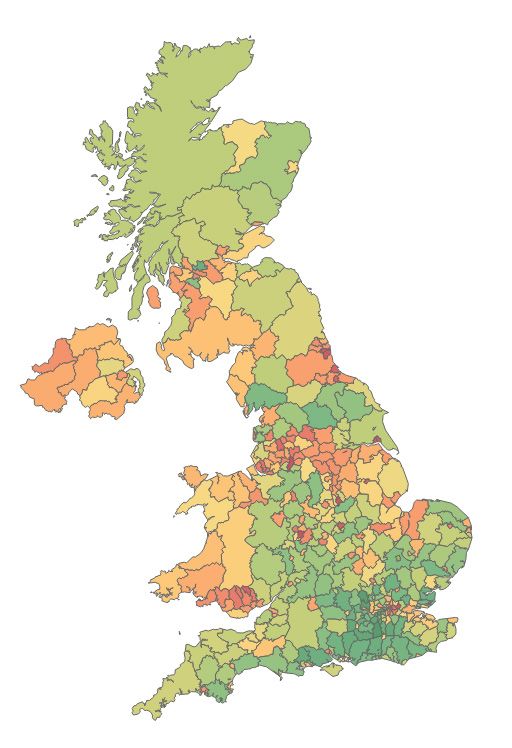
Contents

Acknowledgements                          1

Executive Summary                         2

Introduction                              3

01. Place and Credit                      5

02. Policy Developments                   9

03. Methodology                           13

04. Insights from The Good Credit Index   17

05. Credit havens and credit deserts      24

06. Policy Recommendations                28

Conclusions                               33

Appendix A: The full index                35

Appendix B: Methodological Appendix       36

Endnotes                                  41

Licence to Publish                        44
Acknowledgements
We owe a debt of gratitude to several people and organisations for their support for this
project. This report was made possible by a grant from NewDay. We thank them for their
support, expertise and engagement throughout this project, which was an invaluable
resource at every stage.

Many organisations kindly and generously shared data and insights with us. First of
all, we would like to thank data, analytics and technology company Equifax for sharing
data for this project as well as insights from the remarkable credit building programmes
they have supported. We would also like to thank trade association ABCUL, cash point
network LINK and the Registry Trust.

We would also like to thank all our Demos colleagues for their input, particularly Josh
Smith for all his work making the credit environment strand possible, Hettie O’Brien for
her brilliant insights, Tessa van Rens for generously offering to proofread, Laurence
Cubbon for ironing out difficulties along the way and Izzy Little and Maeve Thompson
for their expert guidance in the production and dissemination stages.

Finally, we thank all the participants in our focus groups for sharing their frank and
honest assessment of the UK credit economy. Their stories were truly remarkable.

As always, any errors and omissions remain our own.

Sacha Hilhorst and Elliot Jones

                                                                                            1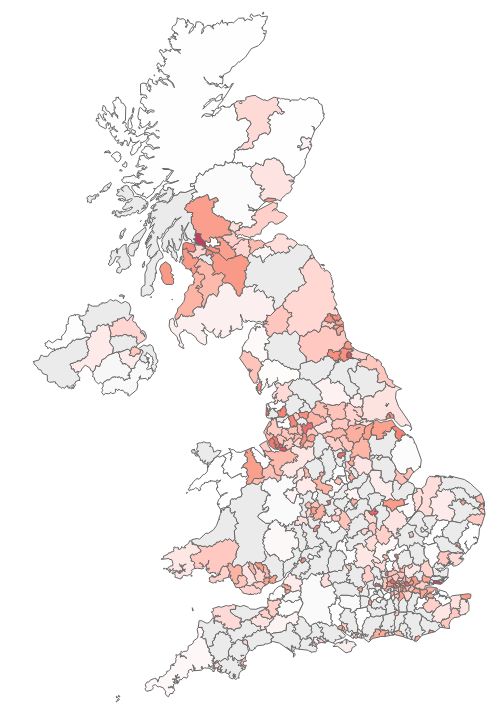
Executive Summary
This inaugural Good Credit Index maps access to good credit across the country.
Combining a number of public and private data sets measured at the local authority
level, the Index is more granular and comprehensive than previously possible. The Index
will be repeated yearly.

The Index is divided into three strands: credit need (including variables such as
income, the percentage of people struggling to keep up with bills and the volume of
credit searches), credit scores (including i.a. rates of CCJs and insolvencies as well as
average credit scores) and the credit environment (the number of payday lenders and
pawnbrokers but also bank branches and credit unions on the high street).

Key findings include:

     • At least 29 local authorities in the UK can be defined as ‘credit deserts’, which
       means the average person in the area would struggle to access affordable credit.
       Credit deserts are defined as areas where poor credit scores intersect with high
       credit need. The Index shows that credit deserts tend to have a higher density
       of payday lenders, pawnbrokers and rent-to-own shops.

     • Post-industrial towns show particularly high levels of credit need. These places
       tend to fall towards the bottom of the index, with the South Wales Valleys and
       Merseyside struggling especially. However, it is worth noting that this does not
       correspond to high levels of unsecured consumer borrowing overall. In general,
       this tends to be higher in more affluent parts of the country where more people
       have access to cheap and abundant credit, such as 0% interest credit cards.

     • The credit environment has changed considerably since the height of payday
       lending on the high street around 2013-2014. The seven biggest payday lenders
       who were trading on the high street during the peak years have jointly lost over
       a thousand shops.

     • Nevertheless, payday lenders, pawnbrokers and rent-to-own shops are still
       clustered in areas with high credit need. The areas of the highest credit need
       have almost five times as many payday lenders, pawnbrokers and rent-to-own
       shops as the areas with the lowest need.

Considering the wide credit gap between different parts of the country, Demos calls for
place-based strategies to build better credit, outlined in the Recommendations at the
end of this report.

                                                                                            2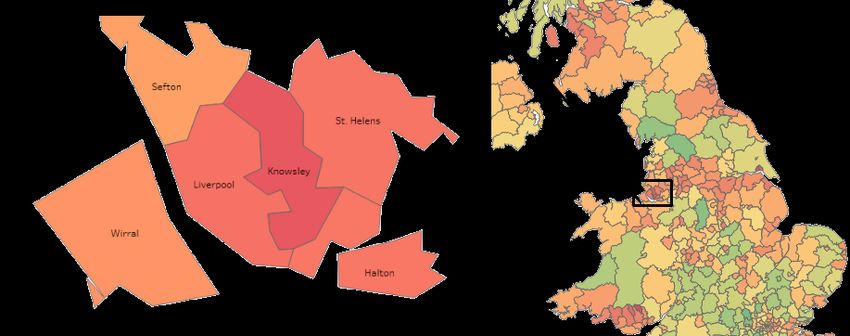
Introduction
For most UK citizens, credit has become a part of everyday life. Almost four in five UK
adults (79 per cent) hold some form of consumer credit, including credit cards, personal
loans and retail finance.1 But when we need a loan, a mortgage or a credit card, not
everyone is able to get credit at an affordable price under fair conditions. Inequalities
run through the system - some are invisible, such as the credit scores attached to us
all, and some visible, through high streets filled with pawnbrokers and payday lenders.
Differences in credit need and credit environment result in vastly different experiences
from region to region, borough to borough or even street to street. In a London focus
group, participants described the difference between their high street and the high
streets in more well-to-do parts of town. One woman said: “It's completely sanitized
for people [in more affluent areas]... They haven't got a clue how the real world actually
operates. They would just go to a merchant bank.” Another added: “They’ve got a bank
manager to look after them, I’m sure.” In some areas of the country, most people can
access an affordable loan, while in other areas, it is a distant fantasy. This research maps
these hidden and not-so-hidden inequalities, presenting the inaugural Good Credit Index.

People in our focus groups and polling were clear: good credit is affordable, sustainable
(offered only to those who can reasonably pay it back) and transparent (both in it
advertising and its use). Users of high-cost credit often see no other option. As one
man said, “If you've got children and you need your washing machine fixed, you haven't
got any choice, have you?” - but they deserve viable alternatives. Or better still, they
need support to ensure they don’t need short-term credit in the first place. This Index
formulates recommendations to help identify, design and target interventions.

In the Good Credit Index, access to good credit is divided into three different strands:

      (1) credit need. Are people in need of credit? It includes indicators such as the
      percentage of households struggling to keep up with bills, the percentage of
      people on low incomes and the volume of credit searches.
      (2) credit scores. Do people have sufficiently high credit scores to access credit
      options with lower interest rates?
      (3) the credit environment. What type of credit does the local high street offer?
      This strand classes bank branches, free cash points and credit unions as positive
      factors and payday lenders as negative factors.

The Good Credit Index brings together 21 different variables across the three streams to
present a picture of credit in the UK in a more granular and comprehensive way than ever
before. Most of all, the Good Credit Index aims to be a thinking tool. Repeated annually, it
will allow us to track progress over time, to identify the areas with the lowest access to
good credit and to break down complex issues into their constituent parts. Is it a matter
of thin credit files? A lack of affordable provision?

Some local authorities might be called credit havens. These are places where need is
low and scores are high. We might look at these places for examples of best practice,
especially when they score better than would be expected based on average income

                                                                                               3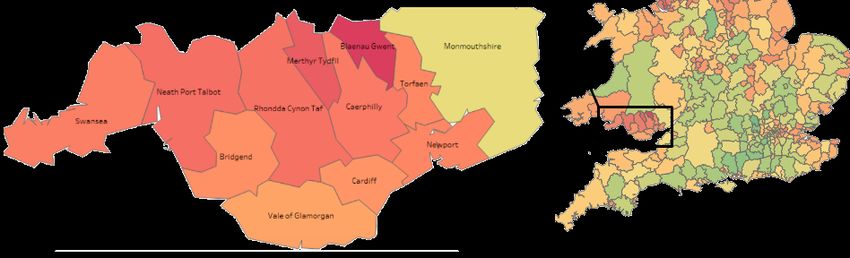
alone. We also identify 25 ‘credit deserts’. Just as food deserts are areas where it is
difficult or costly to access healthy and nutritious food, credit deserts are areas where it
is difficult or costly to obtain good credit. These divisions tend to reproduce themselves
over time, as businesses come to anticipate a higher or a lower default rate and adjust
their offer accordingly. Many forms of risk scoring factor in geographic data, calculating
a risk premium not just on the basis of data about an individual, but also on the basis of
information about the area they live in. This can mean that two otherwise identical people
could pay different rates based on where they live. Furthermore, the high street offer will
change shape in response to (lack of) demand. Therefore, the UK needs a place-sensitive
strategy for economic well-being, and financial inclusion should be a key part of this.

                                 Credit scores: high            Credit scores: low

  Credit need: low               Credit haven                   Credit-free economy

  Credit need: high              Market-based solutions         Credit desert

Users of short term credit on how to define ‘good credit’

      The APR has to be lower [than it is now]. 1,298%, how about that? Your children will be
      paying for that and their children will be paying for it.

      I think [we need] a greater level of responsibility, so not just giving it to anyone who
      walks through the door. Maybe taking a deeper look at, can this person afford to pay
      it back alright. Or even borrow this much. There's so much emphasis on just, if you
      come in, you can get this today.

      I think [payday lenders are] preying on people that are vulnerable and that’s not right.

      [Good loans] are clear and obvious about what you can and can't get. There's nothing
      hidden.

                                                                                                 4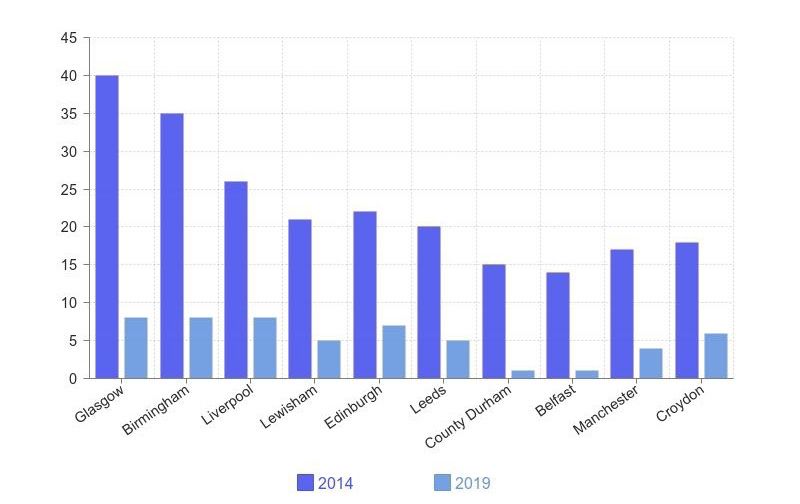
01.
Place and credit

                   55
“In any run-down town - and plenty of not so run-down towns - the pawn shop and
the loan shop are default occupiers”, writes geographer Julian Dobson, making them a
constant presence on the high street and in people’s lives.2 Choices about credit are not
made in a vacuum. In areas with credit unions and local welfare schemes to help people
weather financial difficulty, it is easier to maintain healthy finances. For those living in
areas with high concentrations of bad credit options, however, it becomes more difficult
to make choices that secure financial resilience. When faced with a sea of bad options,
people who are already financially unstable or indebted can slide into a downward spiral.
The places themselves are also shaped by differential access to credit. Credit options are
unevenly spread across the country, with payday lenders disproportionately clustered in
deprived areas.3 High-cost credit providers have a doubly negative effect on communities
and high streets: they can worsen the financial difficulties of local residents and extract
money that could otherwise circulate in the local economy, exacerbating processes of
urban degeneration. This chapter summarises the academic and grey literature on place
and credit, supplemented with findings from focus groups in London and Sheffield.
Geographies of financial inclusion
Policymakers and academics tend to view credit mostly through the lens of personal
finance rather than geography. As Leyshon, French and Signoretta note, the lack of
interest in the geography of financial inclusion can reflect a “disjuncture” between the
perspective industry professionals and policy makers, and the realities of financial
inclusion as experienced “on the ground.”4 When a bank branch closes, for instance,
what might appear on a map to be a straightforward three mile journey to the nearest
alternative becomes far more problematic and time-consuming when immobilities of
place - such as access to a car - are taken into account.
Work from the Bureau of Investigative Journalism showed the importance of geography
to understanding the distribution of bad credit across the UK. Data collected in 20145
suggested that high-cost short-term credit (from here on, HCSTC) and payday loan
providers deliberately targeted deprived areas in the UK; Lewisham, the 16th most
deprived area in the UK, was the “capital” of high cost credit, with 7.6 providers for
every 100,000 residents. At the time of the report, a Lewisham councillor revealed
that HCSTC providers had flyered council estates, suggesting a level of geographic
and socioeconomic targeting on the part of HCSTC providers. Work from Alan Walks
on household debt in Canadian cities notes that “just like income and wealth, debt
commitments and highly leveraged households are unevenly distributed across space,
with implications for the financial, social and political stability of metropolitan regions
and local neighbourhoods.”6
Despite the fact that many people now access financial products including HCSTC loans
online, geography and place are still important for understanding the reality of financial
exclusion as experienced by many people in the UK. As research from the Consumer
Finance Association in the UK shows, a distinction exists between consumers of high
street payday loans and consumers of online payday loans. High street payday loans
attract proportionately more consumers from low-income backgrounds than online
payday loans.7 Moreover, even when consumers purchase their loans online, they may
6still receive targeted advertisements and adjusted risk premiums based on their location.
In focus groups, participants said that high-street lenders facilitated impulsive decision-
making. Especially when living hand to mouth for a long time, people described hitting
a breaking point. Getting a loan was “like a drug”. This was enabled by retailers doing
everything in their power to make the process frictionless.
If it's on the high street, you can actually walk into the shop and take the rings off your
fingers and the chain off your neck and say, "Okay, take this. I'll do whatever." It's much
more a split second thing if you're desperate.
I think there is a difference [compared to online] because when you go into a shop like
that, I feel like the staff are trained to be persuasive. When someone comes in, they're
going to try and talk you into it. Even when you have somewhere like BrightHouse,
they'll try and say to you what a good idea it is to do this.
[The first time I took out credit] was in a local shop. It looked all attractive and inviting,
and I thought it was quite targeted and it had a lot of minority people on the displays
in the window. I went in there, and it was really easy. I was young and I was quite
desperate, and they made it sound like it would be a few minutes, "Oh, just sit down for
a few minutes. Give us your photo ID." It was really quick to get the money. It was very
quick and really easy. There wasn't much talk of the consequences or paying it back.
Environments and decision-making
Understanding the role of geography and place in the HCSTC market is also instrumental
in grasping how people decide between good and bad credit options. Research on
“obesogenic” environments provides a helpful analogy. An obesogenic environment
is one that “promotes gaining weight and [...] is not conducive to weight loss”.8 Such
environments are characterised by poor access to healthy food and few opportunities
for physical activity. For example, a US study found that people who did not have a
walking or biking trail within ten minutes from their house were significantly more likely
to be obese.9 There is also evidence that the presence of unhealthy food options in and
around schools heightens the risk of obesity in pupils, particularly for students from less
wealthy families.10 Similarly, UK and US scholarship has identified ‘food deserts’, where
it is particularly difficult to access affordable, healthy food.11 The exact influence of
obesogenic environments and the prevalence of food deserts are a matter of academic
debate.12 What is relevant in the present context, however, is that social inequalities are
expressed geographically, and that these geographies may subsequently reinforce those
same inequalities.
The UK credit landscape can be understood in a similar way to obesogenic environments
and food deserts. When people live in places with a deluge of poor choices - high-cost,
short term credit and payday loans - they are less able to make sound financial decisions,
and more likely to get caught in a downward spiral of indebtedness. Once someone has
taken out a loan once, they will receive constant offers of more credit from that point on.
It can be very difficult to close credit accounts (such as store cards). Moreover, from the
moment someone performs even just a ‘soft search’ to see if they are eligible for credit,
7they are inundated with flyers in the mail. “It is hard to close your account. They won't do
it,” one woman said. “Once I just paid it off, I was like, ‘I want it shut down, I don't want it
anymore. Take me off the file.’ It's just impossible.” Many participants in the focus groups
described an experience of being “sucked in” or “getting hooked”.
It's so easy to just step inside and be like, "Well, this would be a solution for a really
difficult problem I have.”
People get stuck in this trap so when there's a little offer of a little bit of money, they're
not getting from anywhere else, you can't go to your bank and get a loan, it's easy for
people to just say, "Yes, I'll do it. Why not?" Because people want to have the normal
things they see everyone else having.
They are on the high street with all the stuff in the window, which is, you know, a nice
sofa, and a nice this and a nice that. [...] The interest rate is still high. I thought the
government was supposed to have done something.
In short
Place matters for financial decision-making. It influences the financial options we see
around us and the price we pay for them. Literatures on food deserts and obesogenic
environments offer a useful guide to think through issues around credit beyond the
limiting lens of personal finance.
The intersection between geography and financial indebtedness
is crucial for understanding how the high cost credit market
operates, why providers target particular places, and why some
places have higher levels of household debt.
Experiences of credit
It's just if you don't have savings and you're in need - your washing machine breaks...
I just didn't have any savings. You just go and take [a high-cost loan], and obviously,
you just begin to learn how bad they are.
It's too complex. If you've got a slight mental health problem, you cannot deal with
any of that [...] It goes above your head and rather than have to deal with that, you just
say, ‘I give up.’
You hit a breaking point [after living hand to mouth for a long time] and don't really
care how you're going to get it back at that point.
802.
Policy developments
99Where do people turn for credit, other than mainstream lenders? And how have policy
developments affected access to good credit from the government, the free market and
social lenders? Over recent years, the market for credit has undergone several drastic
changes. With the localisation of the social fund, the government largely removed itself
as a lender to the lowest-income households. Over the same period, the market for short-
term high-cost credit expanded. The government and regulators have attempted to curb
the worst excesses associated with high-cost credit, with the FCA setting a credit cap
and the government announcing a pilot for a zero interest loan scheme.
Government loans
Some have argued that the state should function as a lender to the lowest income
households when they experience financial shocks. To an extent, this was the role of
the Social Fund, which was established in 1986 to provide a variety of payment options
for the most financially vulnerable within society. One element of the fund was the
Budgeting Loan, a means-tested government-led lump sum credit system for people on
social security benefits. The Social Fund was localised in the 2012 Social Reform Act,
passing the responsibility for budgeting loans to Local Authorities.13
Localisation coincided with large cuts to local authority budgets, and welfare funding
was not ring-fenced. A 2016 analysis by the National Audit Office found that councils
had spent only 56 per cent of the money devolved from the Department for Work and
Pensions on welfare programmes.14 Many limited or restricted the types of loans they
provided (e.g. only for white goods). Recent figures from Greater Manchester Poverty
Action show that in 2017/18, the number of successful applications for support through
local welfare assistance schemes in England was 161,337, compared to the 1,329,693
awards made through the social fund in 2010/11 – an 88 percent decrease.15
Under Universal Credit, it is possible to get a budgeting advance to cover unexpected
payments. However, conditions are strict and there is no longer any ring-fenced local
budget to identify and remedy local need. Charities have voiced major concerns, with
several arguing that the Social Fund was not so much localised as it was abolished.16
Recently, the government announced that it will be piloting a programme of no-interest
loans, modelled, it seems, after the Good Shepherd scheme in Australia which was
successful in reducing dependence on payday loans there. This is a positive development,
although as of yet, details are sparse and it is not yet clear how many people would be
eligible. In addition, the government has made £55 million from the dormant accounts
initiative available to Fair4All Finance, an initiative which will seek to improve access to
affordable credit and promote alternative solutions to those who need it.17
Payday loans
Changes in the payday loan market and subsequent regulatory interventions have
further restricted the availability and nature of credit. Payday loans are unsecured loans
with a running time under 12 months.18 The market for payday loans expanded rapidly
between 2008 and 2012. By 2012, payday revenue had surpassed £1 billion, with some
10.2 million payday loans written. There is extensive evidence that consumers do not
10shop around for a payday loan, but rather opt for the most easily available product.19 In
addition, many consumers were structurally dependent on payday loans, taking out an
average six loans a year.20 Many would ‘roll over’ their loans, extending the duration of
the loan, often for a high fee.21
The regulator for the financial industry, the Financial Conduct Authority (FCA), has
determined that for some it is better not to borrow at all than to borrow at a high price.
Using a sophisticated quasi-experimental research design, the FCA could determine that,
all else being equal, those who were only just accepted for a payday loan were more likely
to fall into further financial difficulty (missing payments, exceeding their overdraft limits
and defaulting on debt) compared to people with ever so slightly lower credit scores
who were rejected for the same type of loan. “HCSTC”, the FCA could determine, “was
the cause of these increased risks.”22 Informed by this research, the FCA set a price cap,
restricting interest rates at 0.8 per cent per day and total repayment including fees at
100 per cent.23
Since the introduction of the cap, the market has contracted. The number of people
taking out at least one high-cost short-term loan fell by 800 thousand in 2014-2015
compared to 2012-2013. In large part, this is due to lower applications, rather than
more rejections. Those who do still access payday loans are likely doing so at a slightly
lower cost. Citizens Advice reported an 86 per cent decline in the number of clients who
contact them about payday loan problems, and also saw sharp reductions in people
accessing advice about payday loans on the website.24 Many people who would have
previously been able to access a payday loan now cannot. Research from the Carnegie
UK Trust, Barrow Cadbury, Toynbee Hall and CBiS suggests that people rely on friends
and family or go without, sometimes with harmful consequences.25 People might also
decide to postpone paying ‘safe bills’, purchase goods on credit and sell them for cash or
turn to illegal moneylenders. There is however a lack of data to estimate the prevalence
of each of these alternative strategies.
Credit unions and CDFIs
The government has proposed using credit unions in order to challenge the prevalence
of payday loans. The number of people using credit unions has grown rapidly, to over
2 million.26 However, the credit union sector faces significant challenges in its capacity
to offer affordable credit at scale. Each union is distinct, and not all desire to reach out
to disadvantaged and vulnerable groups, with many opting to focus not on the highest-
risk households but rather on those who are ‘just about managing.’27 In addition, credit
unions sometimes struggle in an increasingly digital lending environment.28
Similarly, community development finance institutions (CDFIs) provide loans to
businesses and individuals that cannot access finance from mainstream financial
providers. In contrast to credit unions, CDFIs hold no savings, and instead rely on external
investment to provide loan capital. In 2016-17 CDFIs in the UK lent £230 million to British
businesses, social enterprises and individuals.29 Of their customers, 33 per cent had
a household income below £15,000 and 47 per cent were benefit recipients.30 CDFIs
have traditionally made use of public sector grants, such as the 1999 Phoenix fund and
European Union structural funds. The latter provides 10 per cent of annual funding for
11UK CDFIs.
The sector now faces numerous pressures, with EU funds frozen since 2016 and the
coalition government deciding to dissolve English Regional Development Agencies, a
major source of CDFI funding. Responsible Finance, the trading name of the Community
Development Finance Association, has advocated for a national CDFI fund of £150
million to unlock investment and scale-up the industry’s impact on “excluded and
underserved communities”.31 However, to achieve long-term financial sustainability,
CDFIs must “demonstrate their viability, without subsidy, to commercial investors”.32
Reviewing current policy
The Good Credit Index divides access to good credit into three dimensions: credit
need, credit scores and the credit environment. Significant policy energy has gone into
improving credit scores, especially through data solutions such as fintech-enabled rent
recognition, which ensures rent payments boost an individual’s credit scores in the same
way mortgage payments do. Meanwhile, changes in government provision of loans and
regulatory pressures have changed the credit environment, restricting the supply of
credit from both the government and commercial lenders. Few policies, however, have
addressed the reasons people need credit. Policy interventions such as the credit cap
have arguably been a great success, but future strategies will need to tackle credit need
as well as credit supply. This will require critically assessing, for example, programs
such as Universal Credit and devoting more policy energy and investment to early
interventions when people fall behind on essential bills, finding ways to boost incomes
and devising schemes to help people access essential goods such as refrigerators and
washing machines at a low cost. The final chapter of this report makes a number of
policy recommendations to improve access to good credit across all three strands.
1203.
Methodology
13
13The Good Credit Index is intended to offer a geographic look at access to good credit
around the UK, utilising both private and public sector administrative and geospatial data.
The Good Credit Index is based on three sub-indices which measure different aspects of
credit which were found to be important based on focus groups and a literature review.
These three strands are the credit environment (the physical availability of good and bad
credit on the high street); credit scores (the likelihood that citizens would be approved
for credit); and credit need (the likely demand for credit, particularly short-term credit).
The overall Good Credit Index was created by summing these three sub-indices, with
an equal weighting given to each.
Level of analysis
The index is calculated at the local authority district level, which, given the available data,
was the most granular level to feasibly examine. We chose to exclude Isles of Scilly, the
Orkney and Shetland Islands, the Outer Hebrides and the City of London, for which the
index was unreliable due to their small populations.
Data
We used a variety of data sources to produce our indicators for the Good Credit Index.
In the pilot stage, we compiled a list of 48 indicators which might have a bearing on
access to good credit, which were narrowed down to a shorter list of the most relevant
data types. These include publicly available national statistics, publicly published data
from financial inclusion charities, geospatial data scraped from Open Street Map and
credit provider websites, and private data kindly provided to us by credit reference agency
Equifax, credit union trade organisation ABCUL, the Registry Trust and the cash machine
network LINK. In every instance we used the most recent available data. The data sets
we received were aggregated to the local authority level. None of the data sets offered
information about individuals.
Due to time lags in publishing national statistics, some data are from 2019, whereas
others are from 2018 or even 2017. For a full list of data sources, see Appendix B.
Some of the indicators used in the index are directly linked to access to good credit. For
example, when many people in a particular location are having to declare bankruptcy,
this will have a direct, adverse effect on the availability of good credit. Other indicators
are used as proxies. Thin credit files, for instance, can also hamper access to credit.
Because there are no publicly available data on the percentage of people with a thin
file, we opt instead to use proxies such as voter registration rates and the percentage
of people in the rented sector, both of which signal thin credit files. In other cases, the
proxy intends to capture something which is otherwise difficult to measure. In the credit
environment, we include financial services such as free cash points. This is not meant
to suggest that in the absence of free cash points, people opt for bad loans, but rather
to capture a general measure of geographical financial inclusion.
Weighting
For each of the sub-indices, the sources used to calculate the index were weighted
14based on our assessment of their relative importance, utilising findings from polling to
weight the credit environment and using regressions against suitable proxies for the
credit scores and credit need. The table below outlines what the various strands were
weighted against.
Strand Weighted against
Credit need Volume of credit broker searches by local
authority
Credit scores Credit scores by local authority
Credit environment Polling on the relative benefit or harm of
having a particular financial service on
the high street (e.g. free cash points)
Limitations
The intention of the Good Credit Index is to give a sense of the overall financial health
of an area, so we advise against reading too much into a local authority being placed
133th versus 134th and instead focus on the broad patterns and trends that appear in
geographic distribution and the similarities and differences across overall higher and
lower scoring local authorities. As the Index is repeated over time, we will also be able
to assess the performance of each local authority compared to previous years.
There are also elements of access to good credit which were not included because of a
lack of suitable data. This includes levels of fraud (which severely affect credit scores)
and the use of illegal moneylenders (which is an indication of serious credit need).
Unfortunately, there are no data available at the local authority level for either.
For a more detailed methodology, see Appendix B. For more detailed results, see the
digital index which can be found online at demos.co.uk.
2020 REVISION
The Good Credit Index methodology is regularly revised to ensure it accurately captures
the current credit situation, and will be updated where necessary. The variable ‘internet
use’, which was used to weight the credit availability scores skewed the scores in the
wrong direction, and has been deleted from the Credit Availability equation.
Moreover, in 2020 we gained access to more comprehensive datasets, describing both
2019 and 2020, covering all bank branches and credit unions in the UK. Given these
changes, we changed the calculation of the credit availability index in 2020. We have
published the revised 2019 credit availability index scores, and the revised aggregate
credit index 2019 here, alongside the 2020 index using the new methodology. The
revised 2019 Good Credit Index will more accurately reflect the credit situation around
the country.
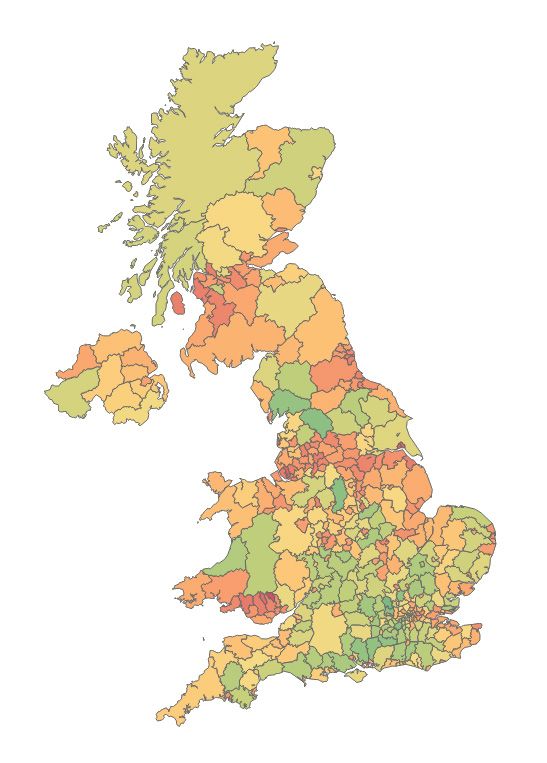
15Maps of the highest-scoring areas (in green) and the lowest-scoring areas
(in red)
1604.
Insights from the Good Credit
Index
17• Post-industrial towns and cities see particularly high levels of credit need, while affluent
areas in the South East (including several London boroughs) see lower levels of need.
Several rural areas do very well, e.g. the Derbyshire Dales.
• High credit need does not correspond to high overall volumes of credit use. Credit use
is high across the country and more affluent areas, where people can likely access
credit at a lower cost, seem to have generally higher overall volumes of credit use.
• 32 local authorities have an average credit rating which is usually defined as ‘poor’.
Most of these local authorities are credit deserts: they see a confluence of high credit
need and low credit scores - discussed in more detail in the next chapter.
• Since 2014, there has been a remarkable retreat from the high street, with many
payday lenders shutting down or going online-only.
Credit need
The map of credit need shows a variegated pattern.
On the one extreme, we have affluent areas with
high levels of financial service provision, including
several of the more affluent London boroughs
and large swathes of the South East of England.
Rural areas fall in the middle with some at the very
top, such as the Derbyshire Dales. Towards the
other end, we see a clustering of post-industrial
and coastal towns and cities. The Welsh Valleys
and Merseyside seem to struggle particularly. In
Knowsley, for example, 0.7 per cent of the adult
population performed a credit broker search in
March 2019, compared to a country-wide average
of 0.27 per cent.
Although some of these patterns are a
straightforward reflection of poverty, it is worth
noting that these towns are not necessarily the
poorest parts of the country. For example, the town
of Corby, which is in the bottom 25 local authorities
on the overall Good Credit Index, is fairly average
in terms of disposable income. But when relatively
high wages are accompanied by high earnings
volatility and/or seasonal unemployment, this will
yield a high need for credit. The over-representation
of post-industrial towns in the lower echelons of the Map of credit need by local authority
index of credit need would suggest that changing
employment structures leave a long-lasting mark on credit need and access to good
credit (see also the St Helens case study at the end of this chapter).
It is also worth pointing out that low levels of credit need do not necessarily translate
into low levels of credit use. Maps produced by the ONS using Equifax data show high
18levels of consumer credit use across the country, with some of the highest volumes of
unsecured consumer borrowing found in affluent areas in the South East.33 This seems to
reflect the fact that wealthier households can access credit more easily, more abundantly
and more cheaply. For example, unsecured consumer borrowing in Wokingham (8th from
the top in the aggregate index) is 60 per cent higher than unsecured consumer borrowing
in Hull (8th from the bottom in the aggregate index), at £4840 per adult resident in
Wokingham compared to £3016 per adult resident for Hull. This is consistently the
case for the highest-scoring LAs compared to the lowest-scoring ones and dovetails
with findings by the FCA that recent growth in consumer credit has been driven largely
by people with high credit scores using prime credit products such as credit cards with
0 per cent interest.34
People up and down the income ladder make fairly heavy use
of credit to smooth their incomes and spread out payments.
The difference lies in the type of credit people use and the price
they pay.
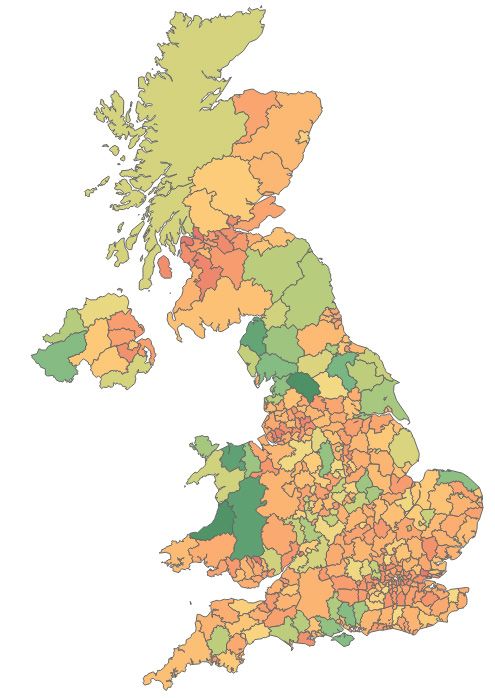
Credit scores
Credit scores are determined by a large number
of different factors, mostly through black-box
systems. Debts, county court judgments and
insolvencies all drag down credit scores. Lenders
may also choose not to lend to an individual
because they already have several current lines
of credit, while yet another group might be denied
credit because they have thin credit files. To
assess the latter, we have used proxies such as
voter registration rates and the size of the rented
sector, as people who rent are much more likely
to have a thin credit file.
32 local authorities have an average credit score
which Experian marks as ‘poor’ (see the full list
in footnote).1 Looking at the spatial distribution
of credit scores, several factors stand out. Rural
areas tend to do much better than cities. In part,
this may be due to the fact that people who live in
the countryside are on average older than people
who live in cities. Because credit scores are all
about reducing uncertainty, most of us tend to Average credit score by region
see our credit scores improve as we get older.
However, when using age-adjusted credit scores, the same patterns appear.
1 The LAs with a ‘poor’ average credit score are Thanet, Great Yarmouth, Torfaen, Lincoln,
Barnsley, Dundee City, Rochdale, St. Helens, Swansea, Blackburn with Darwen, Nottingham, Hyndburn,
South Tyneside, Burnley, Corby, Doncaster, Sandwell, North Ayrshire, Stoke-on-Trent, Halton, Sunderland,
Caerphilly, Liverpool, Wolverhampton, Hartlepool, Neath Port Talbot, Rhondda Cynon Taf, North East
Lincolnshire, Knowsley, Blackpool, Merthyr Tydfil, Blaenau Gwent, and Kingston upon Hull. 19Lowest scores Highest scores
Kingston upon Hull, 669 Chiltern 859
City of
Blaenau Gwent 671 Wokingham 858
Merthyr Tydfil 685 Elmbridge 853
Blackpool 686 St Albans 851
North East 689 Waverley 850
Lincolnshire
Knowsley 689 Richmond upon Thames 850
Rhondda Cynon Taf 700 Rushcliffe 849
Neath Port Talbot 703 Hart 847
Hartlepool 705 South Bucks 846
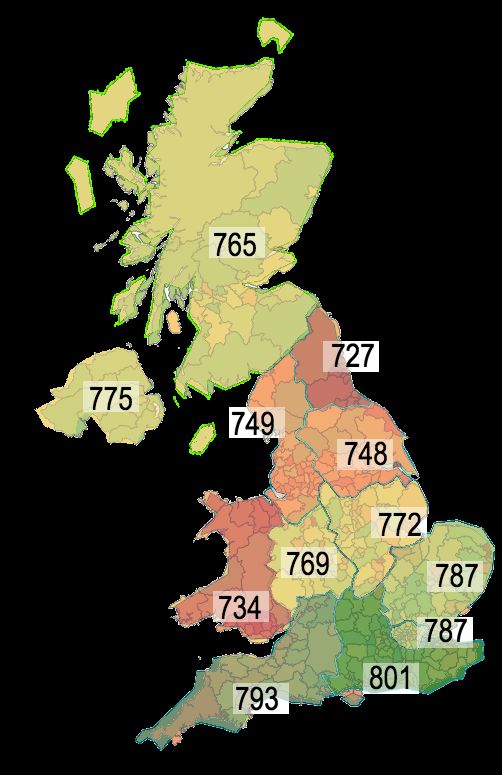
The regional distribution of credit scores shows a fairly clear north-south division. Wales
and the North East have the lowest average scores, while scores are highest in the
South East and South West (although scores in Cornwall tend to be much lower). The
Midlands, Scotland and Northern Ireland fall roughly in the middle. Others have pointed
out that within-region variation is higher than between-region variation. It is worth noting,
however, that of the 68 local authorities in the South East, 63 have a higher score than
any local authority in the North East. Only a few of coastal areas in the South East have
credit scores similar to those in the North East (Thanet, Portsmouth, Gosport, Hastings
and Southampton). This can rightly be called a credit gap.
Map of credit environment
The ‘credit environment’ strand of the Good Credit Index maps the credit options
available to people in their local area. Since their peak around 2014, there has been
a remarkable retreat from the high street, with many payday lenders shutting down
or going online-only. A map of all major payday lenders published by the Bureau of
Investigative Journalism (TBIJ) in 2014 provides a useful benchmark. Of the seven
largest lenders identified by the TBIJ at the time, only two are still offering loans on the
high street (H & T Pawnbrokers and Cash Converters). Oakam, The Money Shop and
Cash Generator have stopped providing personal loans, while The Cheque Centre and
Speedy Cash relaunched as online-only.35
The FCA has been crucial in this transformation. Even before implementing the credit
cap, the FCA had been warning payday lenders that it would be monitoring the market
more tightly. The Cheque Centre was the first to stop providing payday loans, having been
warned by the FCA that their working practices were not in line with regulation.36 As the
credit cap came into effect, others, too decided to cease their payday loan operations.
Glasgow, where the largest lenders had a combined 40 shops
in 2014, there are only eight of their shops left. Cardiff, which
used to have seven loan shops, has none left.
20This is a remarkable transformation. It does not mean, of course, that people no longer
struggle with loans - many will be struggling with other money problems including
council tax and rent arrears or loan shark debt. Moreover, with many regular shops now
becoming lenders as well, we may not be seeing a disappearance of high-street lending,
but rather a diffusion. Many high street retailers now sell their products along with loans.
Offering these loans (often with hefty charges for late repayment) has become a major
and growing part of retailers’ business model. Nevertheless, payday loans do represent
a particularly pernicious type of debt and the retreat from the high street can rightly be
celebrated.
Map of the credit environment (left) and the concentration of payday lenders,
21
pawn shops and rent-to-own shops (right) by local authorityCase study: St Helens
St Helens is a metropolitan borough in Merseyside with 179,300 inhabitants. The borough
is named after St Helens, the town at its centre. The town lies on top of the South
Lancashire coalfield and throughout the 20th century the area was known for coal mining
and glassmaking. St Helens falls in the bottom ten per cent in the Good Credit Index. It
places 375th out of 386 local authorities, forming a part of a larger Merseyside cohort
falling at the bottom of the index.
Looking at the index more closely, we see that St Helens has very high levels of credit
need, with a much lower than average income and a comparatively high percentage of
residents trying to get by on less than £10,000 per year. This translates into a very high
rate of payday loan debt, personal insolvencies and County Court Judgements. In St
Helens, there are 27.5 CCJs per 1000 inhabitants, compared to a national average of 16.
The high street bears the marks of this financial exclusion. The small town centre has
a BrightHouse, an H & T Pawnbrokers, a Cash Converters, another two loan shops,
another pawnbroker and a shop operated by a doorstep lender just outside of the centre,
all in close proximity. Residents of St Helens are particularly reliant on this physical
infrastructure, as a relatively high percentage of residents struggle to use the internet.
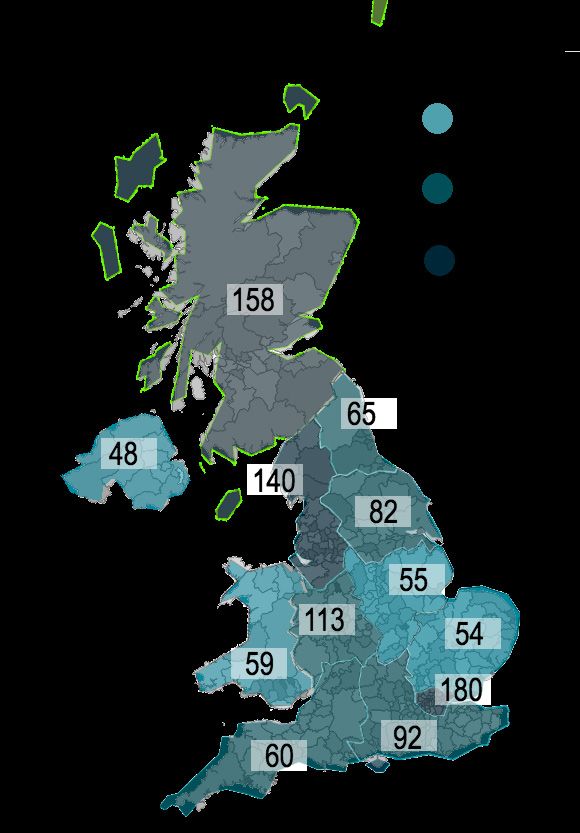
22Number of ‘mainstream’ payday loan shops which have disappeared between
2014 and 2019, by region37
2305.
Credit havens and credit deserts
24• The Good Credit Index reveals 29 ‘credit deserts’ - places where high need for credit
coincides with low credit scores
• We see a clear relationship between credit deserts and high-cost loan shops,
pawnbrokers and rent-to-own shops, suggesting a degree of targeting
• The areas of the highest credit need have almost five times as many payday lenders,
pawnbrokers and rent-to-own shops as the areas with the lowest need
The Good Credit Index shows many different areas dealing with different challenges
around credit; in some university towns, we see large numbers of young people with
thin credit files, while post-industrial towns struggle with high levels of credit need and
some large cities deal with high streets full of high-cost credit options. We define credit
deserts as areas where the average resident has a high need for credit but would struggle
to access credit at an affordable price. This is operationalised as local authorities which
have:
a) A high level of credit need, scoring in the highest 20 per cent and
b) An average credit score generally defined as ‘poor’38
29 local authorities qualify as credit deserts: Torfaen, Lincoln, Barnsley, Dundee City,
Rochdale, Swansea, Blackburn with Darwen, Nottingham, Hyndburn, South Tyneside,
Burnley, Corby, Doncaster, Sandwell, Stoke-on-Trent, Halton, Sunderland, Caerphilly,
Liverpool, Wolverhampton, Hartlepool, Neath Port Talbot, Rhondda Cynon Taf, North
East Lincolnshire, Knowsley, Blackpool, Merthyr
Tydfil, Blaenau Gwent, and Kingston upon Hull.
The phrase ‘credit desert’ might suggest that
these areas have no financial infrastructure
at all, but that is not quite right. Many of these
places do have bank branches, building societies
and credit unions, but credit scores are so
consistently low that most residents would
struggle to access these. In most credit deserts,
the paucity of affordable options is accompanied
by a concentration of high-cost credit, as most
credit deserts feature a very high number of
payday lenders, pawnbrokers and rent-to-own
shops (with ‘very high’ defined as the top quintile).
Just like food deserts often have
an over-representation of less
nutritious options, credit deserts
have an over-representation of
unaffordable lenders.
The location of credit deserts
25The credit environment of credit deserts
18 of the 29 credit deserts have a ‘very high’ number of high-cost lenders, with almost all
the remaining deserts having a ‘high’ presence compared to other areas.39 By comparison,
no local authority in the top fifty highest scores has a very high concentration of loan
shops, pawnbrokers and rent-to-own shops, and only one (Westminster) falls in the
second-highest category.
When the FCA instituted the credit cap, some retailers suggested this meant the end of
lenders targeting the very poorest. But the correlation between loan shops, need and
deprivation has persisted. Perhaps unsurprisingly, there is a strong correlation between
the number of pawn shops and payday lenders and both the level of need and the level
of credit scores. The areas with the highest credit need have almost five times as many
payday lenders, pawn shops and rent-to-own shops as the areas with the lowest credit
need. The correlation with credit scores is even stronger.
26Case study: Blaenau Gwent
The lowest-scoring area in the index is Blaenau Gwent. Like in most of the lowest-scoring
local authorities, local industry used to provide the lion’s share of jobs in the area. Since
the collapse of local industry, locals have struggled to find employment, with wages
among the lowest in the UK.50 Interestingly, the data suggest that volumes of payday
lending are lower than average here, while the volume of searches is only just above
average. The area used to have at least one payday lender, a Cheque Centre, but this shop
is now closed. Credit scores here are the second-lowest in the country, so it is possible
that people are not looking for credit because they know it would not be available to them.
This relatively limited use of credit does not, however, spare inhabitants of Blaenau
Gwent from financial difficulty. Mapping by the Money Advice Service suggests 21.6 per
cent of adults in the area are acutely struggling to pay their bills. The rates of CCJs and
insolvencies are very high. This translates into very bad scores on the Credit Need and
Credit Score subindexes.
2706.
Policy recommendations
28
28Although it can be a struggle for an individual to gain access to good credit, there are
many possible policy solutions to help people along the way. Most notably, the Mayor of
Boston, Massachusetts, launched a programme called Boston Builds Credit, recognising
that lack of access to credit was holding back Bostonians and perpetuating racial
inequalities. A large coalition of community groups, government agencies and private
companies has been working to boost credit scores and the early results are promising.
Learning from these and other trial initiatives, this chapter presents a number of policy
recommendations.
Credit need
There are a number of well-known reasons people turn to credit: because of income
shocks, a lack of savings combined with a necessary expenditure (e.g. a washing
machine breaking down), structurally low incomes or fluctuating earnings. There are a
number of ways central and local government can help people prepare or adjust, starting
with a review of the government’s own practices.
Recommendation one: Local authorities should review their own debt collection
practices to ensure these are in line with best practice as outlined in the good practice
protocol published by the Local Government Association and Citizens Advice,40 as only
half of local authorities currently take basic steps such as referring clients to debt
agencies for help.41
Recommendation two: Local Authorities should partner with charities to source
second-hand furniture and white goods, as Swindon Council does in collaboration
with the British Heart Foundation.42 Another possibility is to partner up with a credit
union to provide loans for second-hand essential items, as Leeds Credit Union does
with support from the city council.43
Recommendation three: Local authorities and advocacy groups should campaign
against irregular payroll payouts, which are a major source of credit need.
Recommendation four: Local authorities and social housing providers should trial early
intervention schemes for low-level rent arrears, such as those outlined by Shelter.44
Recommendation five: The government and local authorities should jointly trial (and
make funds available for) converting council tax debt into a Save As You Borrow loan
with a credit union to promote a habit of saving.
Recommendation six: The government and local authorities should steer recipients
of Universal Credit towards a specific ‘jam jar’ account to help them manage their
finances, as Bristol City Council have done.45
Recommendation seven: Organisations such as Citizens advice should be supported to
hold monthly ‘welfare reform events’ in community venues, offering access to financial
capability services, advice and information on welfare benefits and debt. Including
financial capability training in these events has been proven to be effective in giving
people a greater sense of control over their finances.46
29In addition, several larger changes would have to be made to ensure the benefits
system helps people overcome debt, rather than worsening it. At present, Universal
Credit heightens credit need and uncertainty, because of the five week wait between
becoming eligible and receiving a first payment. While advances are now offered, these
need to be repaid and reduce the income a claimant receives on an ongoing basis. On
top of repaying new advances, a huge number of claimants being moved to UC - by
some estimates as many as 70% - are also having to pay back historic overpayments
of tax credits. These tax credit debts, of which many claimants were unaware, further
reduce the income of new UC claimants, increasing their precarity. Universal Credit was
designed to end the rollercoaster of over and under payments that characterised tax
credits. It would be fitting to write off the debts from the legacy system, and give both
Universal Credit and the claimants dependent on it, a fresh start.
Recommendation eight: The government should appropriately fund and ringfence local
welfare schemes to help councils respond more adequately and swiftly to local need.
Recommendation nine: The government should scrap the five week wait for Universal
Credit.
Recommendation ten: The government should consider a “tax credit jubilee”, forgiving
all historic tax credit debt as claimants are transferred to Universal Credit.
Unsurprisingly, one of the most effective ways to reduce credit need is through higher
salaries. It is crucial to involve employers in the fight for good credit, lobbying them
to offer a living wage, clarity about hours and a commitment to a minimal number of
hours, when desired by the employee. In addition, employers could offer employees
the opportunity to take part of their salary early, using fintech solutions such as those
provided by SalaryFinance and Wagestream. These services allow employees to take
part of their salary early for a small fee, at no cost to the employer. Another option to help
employees through an expenditure shock is offering extra shifts or overtime with wages
paid out immediately, allowing the employee to compensate for the extra expenditure
with extra income.
Recommendation eleven: Where possible, employers should adopt best practice in
preventing debt among employees, including fintech-powered ‘salary advances’.47
Recommendation twelve: Employers should consider offering immediate-payout extra
hours, so that employees can weather unexpected expenses by taking on an extra shift.
Credit ratings
Preventing acute credit need will often improve credit scores as well. For a more direct
approach, several interventions are possible, especially for those who are marked down
in conventional credit ratings because they are renters, migrants or self-employed.
Recommendation thirteen: Local authorities and advocacy groups should promote
voter registration and rent recognition schemes.
30Recommendation fourteen: Financial services should seek to develop fintech-powered
income verification to help people on variable incomes, especially the self-employed,
demonstrate their creditworthiness.
Recommendation fifteen: Fin-tech companies should team up with credit unions to
offer digital integration.
Recommendation sixteen: Credit ratings agencies and advocacy groups should partner
to offer credit boosting schemes, modelled after Boston Builds Credit and Atlanta
Builds Credit in the US.48
Credit environment
Improving the credit environment will require both improving the number of affordable
options and limiting predatory targeting for bad options. This will be especially relevant
for areas towards the bottom of the index, which tend to have the highest need for
affordable options and highest concentration of unaffordable options.
Recommendation seventeen: The government should trial a credit union Growth Fund,
targeting credit deserts specifically.
Recommendation eighteen: The government should commit to a formal evaluation of
budgeting loans under Universal Credit, to assess whether a) there is sufficient funding
available, b) the procedure is adequate to help people avoid high-cost credit and c) how
users experience the application and repayment processes.
Recommendation nineteen: Advocacy groups and/or charities should build a ‘forget me’
tool for (former) borrowers which automatically asks all high-cost lenders to delete all
the files and personal information they hold on a person and cease all communications
to them, so that those who no longer want to borrow money are not unduly targeted.
Recommendation twenty: Online lenders should be banned from sending reminders
and other unsolicited communications to people who started but did not complete a
loan application, or selling this information on.
Recommendation twenty-one: Government should legislate so that local authorities
have the right to prevent any payday lender or gambling shop to open up within 200
metres of another, to prevent a concentration of adverse options.
Recommendation twenty-two: Government should legislate so that high cost lenders
have to offer ‘digital real estate’ to advice services to signpost people to debt advice
and alternatives to high-cost credit.
Recommendation twenty-three: Government should ban payday loans from being
taken out between midnight and six in the morning, as evidence suggests these are
more likely to exacerbate borrowers’ financial difficulty.49
Recommendation twenty-four: The government should replace all funding to CDFIs
31You can also read