Local Outcome Improvement Plan 2017-27 Strategic Assessment - Strategic Assessment ...
←
→
Page content transcription
If your browser does not render page correctly, please read the page content below
Local Outcome
Improvement Plan
         2017-27

        Strategic
     Assessment

             1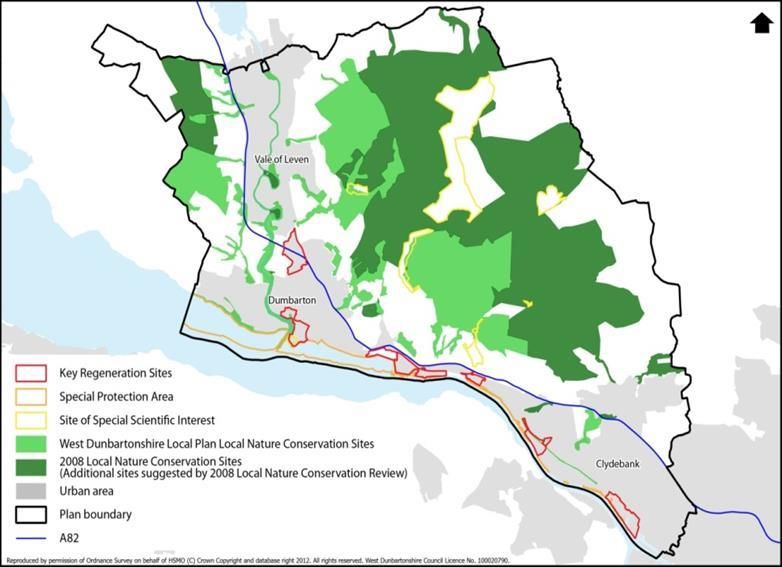
Contents

                                    Page

Background                           2

West Dunbartonshire: Area Profile    4

Population and Demographics          6

Thriving                             17

Safer                                45

Nurtured                             52

Independent                          59

Empowered                            63

Health & Well-being                  74

References                           86

                                           1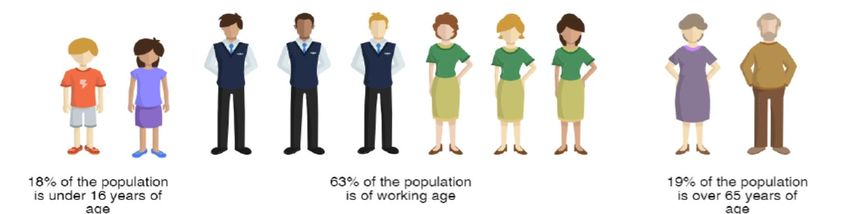
Background
A strategic assessment of the West Dunbartonshire CPP area and locality profiles
have been developed to support the identification of priorities and priority
communities in line with the requirements around locality planning.
West Dunbartonshire’s Community Planning Management Group met on May 24th
2017 to consider and agree the outcome areas that West Dunbartonshire’s Local
Outcome Improvement Plan should focus on. The Management Group proposed to
adopt 5 key outcomes (listed below) for the partnership, which will be the focus for
partnership activity and investment over the period of the plan.

   1.   Our local economy is thriving
   2.   Our communities are safe
   3.   Our children and young people are nurtured
   4.   Our older residents are supported to remain independent
   5.   Our residents are empowered

Each outcome is supported by a suite of priority areas, which will be the focus of
activity in thematic Delivery & Improvement Groups and measured through a
performance and improvement monitoring framework.

Residents were invited to complete an online survey during June and July 2017
letting us know if they agreed with these priority areas and providing them with the
opportunity to say what they felt was important to focus on. 359 residents completed
the survey. The results showed that the most respondents agreed with the outcomes
that the CPWD Management Group identified.

        120%
                Survey Results: Key Outcomes for the Partnership (2017-27)
        100%
                 15%             12%            17%            21%
                                                                               31%
         80%
                                 28%            23%            17%
         60%     48%
                                                                               26%          Don’t Know

         40%                                                                                Disagree
                                 59%            61%            62%
                                                                                            Agree
         20%     36%                                                           43%

          0%
                Our local       Our        Our children and   Our older     Our residents
               economy is   communities are young people residents are     are empowered
                 thriving       safe        are nurtured    supported to
                                                               remain
                                                            independent

The only outcome where there was disagreement was ‘Our local economy is
thriving’, however all of the priorities within this outcome area were supported by the
majority of respondents. Some residents suggested ‘Health’ and ‘Environment’ as

                                                                                                         2
outcome areas, however, these are cross-cutting areas and will be included in the
Local Outcome Improvement Plan.

During a recent Citizens’ Panel survey we asked respondents which of these four
key areas they thought should be prioritised for 2017-2021. Work, income and
economic participation, and education and learning were seen as key for future
delivery. This was consistent across all areas, including those areas categorised as
most deprived. These key areas feature in the outcome areas the LOIP will focus
on.

This strategic assessment has been structured to provide evidence in support of
each of the key outcome areas. They are:

   1.   Thriving
   2.   Safe
   3.   Nurtured
   4.   Independent
   5.   Empowered
In addition, cross-cutting evidence relating to health has been included in this
assessment.

                                                                                       3
West Dunbartonshire: Area Profile
West Dunbartonshire with a population of 89,5901 is the 8th smallest in Scotland but
with 563 people per square kilometer the distribution of the population is fairly
dense. It is the 2nd smallest Local Authority in Scotland in terms of land area at 159
sq. Km2.

West Dunbartonshire has three main settlement areas: Clydebank, Dumbarton and
the Vale of Leven. Almost half (48%) of the population live in the Clydebank area
which means it has a population similar to a large urban town. Dumbarton and the
Vale of Leven, which are classified as accessible small towns, are less densly
populated. There is one area in the northern part of the Council area which falls
within the boundary of Loch Lomond and the Trossachs National Park which is
considered to be a rural area.

The area is recognised as experiencing a range of negative outcomes in terms of
residents’ health, life expectancy, employment, school performance and crime rates.

The majority of the data contained within this strategic assessment is at a West
Dunbartonshire wide level and compares performance against other CPP areas
and/or Scotland as a whole. When drilling down to individual community level, the
focus of the CPPs assessment for locality planning is based on the geographies and
associated profiles of the CPP’s Your Community model which reflects West
Dunbartonshire’s Community Council areas. These profiles are shown in Appendix
One. More information about the role of Community Councils can be found on the
Council’s website.3

To complement this, an extract from the Improvement Service’s Community Planning
Outcomes Profiles – relating to West Dunbartonshire - has been included in
Appendix two. The full profile can be found on the Improvement Service website 4.
Although there are similarities between a few of the Intermediate zone and the Your
Community areas their geographies are different and therefore need to be treated
separately for any analyses. The CPOP brings together outcome and inequality
measurements in a way that allows each CPP to identify vulnerable communities
where negative outcomes are clustered. The profiles tell us whether inequality is
increasing or decreasing over time and which communities are faring below average
for the area or in comparison to similar communities across Scotland.

The CPOP allows us to review data over time for outcomes in West Dunbartonshire
or to compare small areas (i.e. Intermediate Zones) in West Dunbartonshire to
similar communities across Scotland, including looking at rates of improvement in
comparison to other areas.

The CPOP for West Dunbartonshire shows that the Clydebank area has poorer
outcomes; however communities within Clydebank are improving at different rates.
Kilbowie and Whitecrook have improved least while Dalmuir is most improved.

There are 18 individual indicators in the CPOP covering outcomes related to health,
poverty, education, employment, regeneration, community safety and wellbeing.
Performance over time in West Dunbartonshire is broadly similar to that of Scotland

                                                                                         4
other than in relation to unplanned hospital admissions and positive destinations. In
both of these indicators the West Dunbartonshire trend shows deterioration over time
while the Scottish trend over time is improving.
Of the 18 indicators in the CPOP 8 are showing performance which is worse than the
Scottish figure and also improving at a slower rate than Scotland. These indicators
are:
Emergency admissions
Early mortality
Fragility
Out of work benefits
Employment rate
Positive destinations
S4 tariff score
Child poverty
5
Population and Demographics
Population
The 2015 population for West Dunbartonshire is 89,5905; a decrease of 0.1% from
89,710 in 2014. This decrease is due to a higher level of deaths than births being
partly balanced by net in-migration. The population of West Dunbartonshire
accounts for 1.7% of the total population of Scotland.

In West Dunbartonshire, 17.4% of the population are aged 16 to 29 years. This is
smaller than Scotland where 18.2% are aged 16 to 29 years. People aged 60 and
over make up 23.9% of West Dunbartonshire. This is smaller than Scotland where
24.2% are aged 60 and over.

Since 1989, West Dunbartonshire's total population has fallen overall. Scotland's
population has risen over this period.

Age and Sex
The age and sex composition of the population is one of the most important aspects
of demographics as changes to different age groups will have different social and
economic impacts. For example, increases in the number of elderly people in the
population will place a greater demand on health and care services.

The median age6 in West Dunbartonshire is 42. For men in West Dunbartonshire it
is 41 and for women it is 43, with 19% of males and 16% of females aged 16 and
under. Sixty-five % of males and 61% of females are of working age and 16% of
males and 22% of females of pensionable age. For every 100 females in the
population there are 91 males.

The following charts demonstrate the breakdown of sex and age groups within the
population7.

              Estimated Population – Age Group Split (WD) 2015

                                                                                     6
Births
In 2015 there were 924 babies born in West Dunbartonshire, 461 males and 463
females. This represents a 6.3% drop in the number of births from the previous
year.

Figure 28

Since the mid-1970s, there has been a trend towards having children at older ages,
with women aged over 30 accounting for over half of all births in 2015 9.

Deaths
The number of deaths10 in West Dunbartonshire increased from 1,043 in 2014 to
1,095 in 2015. Compared to Scotland (10.4) over the period 2013 to 2015, West
Dunbartonshire (11.7) had a higher death rate. The main cause of death in West
Dunbartonshire was cancer, followed by circulatory disease. Over the period 2013 to
2015 the overall death rate was lower for males than for females.

The death rate for men in West Dunbartonshire is 11.6 per 1,000 population
compared to 10.4 for Scotland, for women the rate is 11.8 per 1,000 population
compared to 10.5 for Scotland.

Fertility Rates
Fertility in West Dunbartonshire decreased from 58.3 births per 1,000 women aged
15 to 44 in 2014, to 55.111 in 2015. For Scotland as a whole, the general fertility rate
decreased from 54.7 births per 1,000 women aged 15 to 44 in 2014, to 53.2 in 2015.

Another way of expressing this is to use the total fertility rate. In 2015 the total
fertility rate for West Dunbartonshire stood at 1.62 children per female. To ensure
the population total remains the same this figure would need to be 2.1 and if we
were looking to grow the population this would need to be 3 or above. Present day
rates can be contrasted with the period 1955-60 (the baby boom) when the fertility
rate was 4.91.

                                                                                       7
Ageing
The fall over time in fertility, together with the simultaneous improvement in
mortality, has reduced the relative size of the child population, and increased the
relative size of the pensioner population. This upward shift in the average age of
society is what is meant by the term “population ageing”. The ageing of the
population has enormous economic implications; it has the potential to have an
impact on all sectors of the economy and all aspects of economic activity.

The 2015 population estimates show a decline in the number of West
Dunbartonshire residents aged 16 and under from 16,720 to 16,694, a 0.2%
decrease. Over the same period there was an increase from 21,205 to 21,345
people aged 60 and over a 0.7% increase.

Population Projections
By 2039 the population of West Dunbartonshire is projected to be 83,690, a
decrease of 6.7 % from 2014. The population of Scotland is projected to increase by
7.5 % between 2014 and 2039.

Over the next 25 years, the age group that is projected to increase the most in West
Dunbartonshire is 75+. This is the same as for Scotland as a whole. The population
of under 16’s in West Dunbartonshire is projected to decline by 12.1 %.

West Dunbartonshire’s population is forecast to decrease because it is thought that
there will continue to be more deaths than births and there will be a continuation of
population loss due to net out migration.

Projected Birth rates
West Dunbartonshire combines a low fertility rate with very small improvements in
life expectancy. This together with the fact that the area loses more population than
it gains through migration means that the population of West Dunbartonshire is
projected to continue to decline over the next 25 years. National Records of
Scotland has projected that in West Dunbartonshire there will be a % decrease in
the number of births over the next 25 years12.

Life Expectancy
By looking at life expectancy at birth we can objectively compare mortality rates over
time, between areas and between countries. This is helpful in that it allows us to set
public health, or health improvement targets based on what we’ve seen happen over
the preceding years. This is even more helpful when used alongside other health
related information such as that published in the Scottish Index of Multiple
Deprivation (SIMD).

Life expectancy for those born in 2013-15 in Scotland was 77.1 years for males and
81.1 years for females but with considerable variation between areas across the
country. Female life expectancy was lowest in West Dunbartonshire. Females in
East Dunbartonshire have the highest life expectancy and can expect to live for 83.5
years, 4.8 years longer than in West Dunbartonshire (78.7 years).

                                                                                        8
West Dunbartonshire has life expectancy rates that are statistically significantly
worse than the Scottish average, with the second lowest life expectancy at birth of
all Scottish Local Authorities13. Based on the most recent figures available (2013-
2015) female life expectancy at birth (78.7 years) is greater than male life
expectancy (74.8 years), but both were lower than the Scottish average. Male life
expectancy at birth in West Dunbartonshire is improving more rapidly than female
life expectancy.
In West Dunbartonshire female life expectancy at age 65 (18.4 years) is greater than
male life expectancy at age 65 (16 years). The overall picture however is showing
some improvement, with the percentage change in life expectancy at birth in West
Dunbartonshire improving by 5.6% for Males and 1.7% for females over the last 12
years.
The effect that poverty has on life expectancy can been seen when comparing life
expectancy rates in the least and most deprived areas of West Dunbartonshire. The
chart below14 looks at life expectancy rates based levels of deprivation. The
intention is to use the estimates to monitor the inequality gap between those living in
the most and least deprived parts of the Council area, with the aim to improve the
measurement of local level outcomes in support of Single Outcome Agreements.
This chart shows that men living in deprived areas have an inequality gap in life
expectancy of 6 years and women of 4 years.
West Dunbartonshire Community Planning Partnership is fully committed to the
vision, values and ethos of the Equality Act 2010 and to fulfilling the three key
elements of the general equality duty as defined in the Act :-
Eliminating discrimination, harassment and victimisation;
Advancing equality of opportunity between people who share a protected
characteristic and those who do not;
Fostering good relations between people who share a protected characteristic
and those who do not.
9The Scottish Government will introduce the Socio-Economic Duty of the Equality Act
2010 in October 2017. This means that the Community Planning Partners must
consider inequality of outcomes arising from socio-economic disadvantage when
making strategic decisions. Where possible the CPP should make decisions that
improve equality for people who are socio-economically disadvantaged.
There is considerable cross-over between equality and socio-economic issues, in the
sense that many of the disadvantages faced by particular equality groups are
underpinned or made worse by low income.
Any and all approaches to regeneration and tackling inequalities must pay attention
not only to locality but the different challenges which tend to be faced by people
because of ethnicity, disability or sex or any combination of these.
Migration, Ethnicity and National Identity
Historically, Scotland has been a country of net out-migration, with more people
leaving to live elsewhere than moving into Scotland. However, since the 1960s, net
out-migration greatly reduced, and from 1990 onwards Scotland has mostly
experienced net migration gains. Scotland has now entered a period of net in-
migration. In 2013-14 net migration rose to 17,600 and in 2014-15 it rose again by
10,400 to 28,00015.
The increase in population has not been shared equally across all Scottish regions
and West Dunbartonshire has continued to experience steady net out migration in
the last 30 years; on average in 2013-15 there was a net outflow of 151 people from
West Dunbartonshire per year, meaning less people entered West Dunbartonshire
(2,324 per year) than left (2,475 per year). The 16 to 29 year olds age group
accounted for the largest group of in-migrants into West Dunbartonshire. The largest
group of out-migrants was also the 16 to 29 year olds (34%).
The main reasons people give for leaving is that they are: moving their children to a
new school area; moving for employment reasons; they have recently graduated
and are moving to take up a job, or they have recently retired. The chart below
shows the destination of people migrating from West Dunbartonshire16.
89 Syrians arrived under the Vulnerable Persons Scheme between 2015 and 2016
however they are not counted in the most recent population estimates as they
arrived after June 2015.
10The Black Ethnic Minority Population of West Dunbartonshire at the 2001 census
was 0.7%, increasing to 1.5% at the 2011 Census. This compares to 4% for
Scotland.
Minority Ethnic Groups West Dunbartonshire
Based on 2011 Census figures, the biggest ethnic group is white, which accounts for
89,306 people; this group includes white Scottish 84,344, white British 2,813 and
white Irish 1,168. There are 102 Gypsy travellers, 382 white Polish, 497 white other
and 178 mixed white. There are 845 Asian people, 251 Pakistanis, 277 Indians, 5
Bangladeshis, 160 Chinese, and 152 other Asian. There are also 261 people who
are African, 30 Caribbean, 62 Arab and 100 other ethnic groups.
Sexual Orientation
The Equality Act 2010 was introduced to help rationalise and strengthen the
legislation on Equalities issues. The Act introduced the concept of ‘protected
characteristics’ for example race, age and sex, and sex orientation.
11Profiles before 2014 did not include information on Sexual Orientation. This is
because this information is not gathered by the census; a UK survey carried out by
the Office of National Statistics showed that 95% of people said they were
heterosexual, 1% gay or lesbian, 0.5% bisexual, 0.5% other, the remaining 3% did
not know or did not answer. A UK Treasury estimate in 2005 was of 6%. No
information is available at a local level.
Religion and Belief
We know from the 2011 Census that Scotland became a less religious country in
between the 2001 and the 2011 Census. In West Dunbartonshire there was an 8%
reduction in the number of people who reported they had a religion. There was also
a drop of 22% of people who recorded their religion as Church of Scotland and a
drop of 1% in the number of people who described themselves as Roman Catholic.
The 2011 Census shows that Christians make up 65.2%17 of faiths in West
Dunbartonshire, this compares to 54 % of the population of Scotland who stated
their religion as Christian.
In West Dunbartonshire, 29% of the population stated they belonged to the Church
of Scotland compared to 32% for Scotland. The proportion of people who stated
they were Roman Catholic in West Dunbartonshire was 33.1% compared to 16% for
Scotland. The proportion of people who reported that they were Muslim in West
Dunbartonshire was 0.4% compared to 1.4% for Scotland as a whole.
Disability
The number of people in Scotland with a long-term activity-limiting health problem or
disability was slightly lower in 2011 than in 2001. This is despite the fact that the
number of people aged 65 and over increased by 10%. In West Dunbartonshire
however this is not the case with 23.1% of the population reporting long-term
activity-limiting health problems or disabilities as opposed to 22.7% in 200118.
Household Profile
The number of households in Scotland has been growing faster than the population
(in 2015 Scotland’s population was 5% higher than in 2005)19.
This is because more people are living alone and in smaller households. Average
household size in Scotland fell from 2.21 people per household in 2005 to 2.17 in
2015.
West Dunbartonshire has around 45,05620 dwellings; 10,74821 of these homes are in
WDC ownership. 96.5% are occupied, 3.3% are vacant and 0.2% are second
homes. The proportions of dwellings in Scotland which are vacant and second
homes are 3.1 % and 1.1 %, respectively27.
The most recent figures show that 51% of dwellings in West Dunbartonshire are
flats; which are mostly concentrated in the Clydebank area; 20% are terraced, 19%
are semi-detached and 9% are detached22.
Owner occupation now accounts for 56% of the housing stock in West
Dunbartonshire. Social housing accounts for 37% of the total housing stock, with
the remaining 7%23 in the private rented sector.
12The total number of households in West Dunbartonshire is projected to change from
42,106 in 2012 to 42,543 in 2037, which is an increase of 1 %. In Scotland as a
whole, the projected number of households is set to increase by 17 % over the
same 25 year period24.
In West Dunbartonshire, households headed by 60-74 year olds are projected to
increase in number by 14%, and those headed by the 75+ age group are projected
to increase in number by 70% between the years 2012 and 203725.
In Scotland, the number of lone single person households is projected to increase
by 35% over the next 25 years26. In West Dunbartonshire, the number is projected
to increase by 23%. At the same time, the number of larger households in West
Dunbartonshire is projected to fall, with the number of households of 2 or more
adults with children decreasing by 34% over the 25 year period27. The average
household size is projected to decrease from 2.13 in 2012 to 1.93 in 2037.
Scottish Index of Multiple Deprivation 2016 (SIMD)
The SIMD 2016 publication showed an increase for West Dunbartonshire in its share
of the 20% most deprived datazones in Scotland compared to 2012. West
Dunbartonshire has seen relatively large increases in its share of datazones in the
most deprived areas, showing the biggest increase in relative deprivation from 2012.
For the purposes of SIMD 201628,
West Dunbartonshire consists of
121 datazones. The datazone
which is the most deprived in West
Dunbartonshire is in the immediate
geography of South Drumry; within
the Community Council area of
Linnvale and Drumry and the Multi
member ward of Clydebank Central.
The datazone which is the least
deprived is in the immediate
geography of Dumbarton East;
within the Community Council area
of Dumbarton East and Central and
the Multi member ward of
Dumbarton.
The map above displays in red the data zones within West Dunbartonshire that are
ranked within the 20% most deprived in Scotland.
48 West Dunbartonshire data zones equating to 40% of all data zones in our area -
are within the 20% most deprived. Our national share is 3.4% of all data zones in
Scotland.
The following Heat Map shows the West Dunbartonshire data zones aligned to their
associated Your Community areas that are ranked within the 20% most Deprived in
Scotland for the overall ranking and each of the domains.
13Your Community area evidence sheets have been developed to assist with the
identification of areas where the CPP should develop Locality Plans. These can be
found in appendix one.
Of the 17 Your Community areas of Dalmuir and Mountblow, Dumbarton West and
Linnvale & Drumry have the poorest SIMD rankings overall.
14WD Your Community areas containing data zones ranked within the 20% most Deprived in Scotland
Overall SIMD
Employment
Education
Housing
Income
Your
Health
Access
Crime
Rank
Community
Area Data Zone
S01013228 1067 1206 996 1040 1135 6915 300 1350
Alexandria S01013231 1236 1042 1193 2211 769 4594 1412 2386
S01013227 807 619 772 1723 784 4021 731 3213
Alexandria
S01013238 573 511 876 550 592 2262 1243 1286
Balloch and
S01013240 448 530 448 649 304 2391 2883 1633
Haldane
S01013239 423 445 288 1048 646 1390 1825 4136
S01013219 1022 1301 763 1130 1670 1556 3155 531
S01013216 1068 1536 633 1436 1615 1492 2657 1276
Bonhill and
Dalmonach S01013225 758 1165 624 566 857 1993 2351 1501
S01013218 767 1166 730 426 1102 1512 2121 1511
S01013220 862 873 833 818 1636 3360 456 1600
S01013128 1019 949 1104 1890 1216 2599 538 464
S01013127 452 868 526 380 549 992 548 1105
Clydebank East S01013126 443 779 463 523 478 911 1099 1180
S01013122 306 174 442 529 791 4598 129 1537
S01013123 1371 1238 1299 1596 2435 2439 706 2023
S01013167 92 50 161 161 207 5169 311 701
S01013132 912 698 962 1269 812 4081 3702 712
S01013170 663 706 511 689 1223 2592 2449 1132
Dalmuir and
S01013166 104 75 63 754 139 5708 247 1399
Mountblow
S01013169 836 689 911 857 1016 3013 2146 1772
S01013168 1348 1150 1143 2452 1287 3415 1610 2244
S01013133 969 692 844 1975 934 4831 1658 2321
Clydebank
Duntocher and
S01013162 1198 1147 1119 2496 1104 1403 2276 1296
Hardgate
S01013155 831 1219 737 954 1025 949 2366 765
S01013156 597 925 430 1099 506 1494 2602 927
Faifley S01013153 743 1103 683 552 1418 1047 1554 1227
S01013157 732 759 679 999 886 1551 3040 1734
S01013154 1381 1513 1305 2056 1490 1333 1548 2041
S01013135 83 100 71 348 140 2403 674 675
S01013139 409 364 339 608 844 4178 664 1156
Linnvale and
S01013138 138 202 155 305 115 3311 170 1582
Drumry
S01013140 618 580 565 1521 488 4629 608 1620
S01013129 1130 1318 1237 3249 819 1538 135 2034
Parkhall, North S01013130 299 500 105 638 723 4401 439 863
Kilbowie and S01013141 1304 1198 1004 2087 1283 4467 1395 1771
Central S01013142 839 540 880 1286 895 4247 2177 1952
Dumbarton S01013186 1099 1183 758 1632 1390 2622 2355 1657
North S01013184 603 620 628 1080 805 1743 728 1797
S01013203 559 301 873 1839 940 1042 411 1195
Dumbarton
S01013206 1203 882 1381 1572 1672 2776 1103 1253
Dumbarton S01013202 869 628 1343 1279 1181 2619 256 1508
West S01013205 219 291 343 84 545 1277 812 1527
S01013201 127 270 201 109 67 2319 377 1649
S01013200 1213 947 943 2625 1561 4567 620 1966
S01013222 593 523 513 2305 264 4924 872 1984
Renton S01013207 1353 1308 1167 2311 981 2851 2357 2586
S01013208 749 648 864 1144 681 4732 361 2990
Colour % Deprived
5%
10%
15%
20%
Out with 20%
15The following sections provide evidence in support of each of the key LOIP outcome
areas where data is available. This strategic assessment will be updated when new
or additional data becomes available.
Key to Symbols
Compares the same or better than the national average or has improved locally compared to
previous years.
Compares favourably but not as good as the national average or has not improved as well as
anticipated.
Compares worse than the national average or has deteriorated locally compared to previous
years.
Information provided to highlight achievements so far or has no suitable measures to
compare with.
16THRIVING
Summary
National Outcomes:
01. We live in a Scotland that is the most attractive place to do business in Europe
02. We realise our full economic potential with more and better employment
opportunities for our people
03. We are better educated, more skilled and more successful, renowned for our
research and innovation
10. We live in well-designed, sustainable places where we are able to access the
amenities and services we need
12. We value and enjoy our built and natural environment and protect it and enhance
it for future generations
13. We take pride in a strong, fair and inclusive national identity
14. We reduce the local and global environmental impact of our consumption and
production
Key Local Issues:
Less than a quarter of Citizens’ Panel respondents said they felt their town centre
was attractive.
The majority of business enterprises (86.5%) are ‘micro’ businesses employing
up to 9 employees. This is slightly smaller than the Scottish figure of 87.8%.
Although the employment rate is slightly higher than the national average,
earnings are £17.40 per week (3%) below the average for Scotland.
The unemployment rate is higher than the national figure however it has been
improving over the past few years
The job density figure is declining
The gender pay gap is significantly wider for full time employees
College student enrolments are declining at West College Scotland Clydebank
Campus and the part-time further education students generally have a lower
success rate compared to Scotland; however the partial success rate is higher.
Key benefit claimant figures are well above the Scottish average, however there
has been a narrowing of the gap between West Dunbartonshire and Scotland
overall
West Dunbartonshire has significantly higher levels of people with no or low
qualifications and lower levels of graduates than the Scottish average.
Key Opportunities:
Current and future investment into and transformation of key regeneration sites
across the area will contribute to increased employment opportunities.
Development of town centres through Charette action plans
Modern Apprenticeship Programme challenging gender segregation and under
representation of women, Black minority ethnic and disable people
District Heating Network - Queen’s Quay
17Key Drivers
National Scottish Government Economic Strategy (2011)
Europe 2020: European Union’s ten-year growth strategy (2010)
National Transport Strategy
National Planning Framework
Tourism Scotland 2020- “The future of our industry, in our hands”
Achieving Our Potential: A Framework to tackle poverty and income
inequality in Scotland (2008)
Scottish Government’s Town Centre Action Plan (2013)
Achieving a Sustainable Future: Regeneration Strategy (2011)
Welfare Reform Programme
Developing the Young Workforce: Scotland’s Youth Employment
Strategy (2014)
Homes fit for the 21st Century: the Scottish Government's strategy and
action plan for housing in the next decade 2011-2020
Scottish Government’s Zero Waste Plan 2010
Waste (Scotland) Regulations 2012
CoSLA/Scottish Government’s Charter for Household Recycling in
Scotland 2016
Race Equality Framework for Scotland 2016-2030, Scottish
Government
Fair Scotland Action Plan, Scottish Government
A Fairer Scotland for Disabled People, Scottish Government
Equalities Action Plan for Modern Apprenticeships, Skills Development
Scotland
Social and Economic Duty (from the Equality Act 2010) October 2017
Local/ West Dunbartonshire Strategic Plan (2012-17)
Regional West Dunbartonshire Economic Development Strategy (2015)
Clyde Valley Strategic Development Plan (2012)
2012-17 National Park Partnership Plan – Loch Lomond and the
Trossachs National park
Local Development Plan
City Region/City Deal
Local Housing Strategy 2017–2022: More Homes, Better Homes West
Dunbartonshire
Local Biodiversity Action Plan
West Dunbartonshire Open Space Strategy 2011
West Dunbartonshire Council, Equality Outcomes 2017-2021
Evidence Summary
Regeneration and Strategic Partnerships
Town Centres
Business Activity
Tourism
Housing
Households in Fuel Poverty
Earnings
Employment
Jobs by Industry
18Job Density
Economic Inequalities
Unemployment
Welfare and Benefits
Child and Working Tax Credits
Adult Learning
Further/Higher Education
Adult Qualifications
Built and Physical Environment
Biodiversity
Local Designations
Historic and Cultural Heritage
Environmental Impact
Regeneration and Strategic Partnerships (and town centres)
The transformation of West Dunbartonshire’s key regeneration sites continues to be
a major and long-term priority for the Council. The overall result will be inward
investment, employment opportunities and an improved quality of life for our
communities. The priorities for these sites are detailed in the Council’s Proposed
Local Development Plan29, refreshed Economic Development Strategy and
Infrastructure Investment Plan.
The key sites for regeneration are:
Clydebank town centre and waterfront;
Carless:
Bowling Basin and Harbour;
Exxon, Bowling;
Dumbarton town centre and waterfront;
Lomondgate and the Vale of Leven Industrial Estate; and
Alexandria town centre.
During 2015/16 a number of activities helped to progress the regeneration of these
sites. Significantly, an allocation of £12.4m for the Regeneration Capital Fund was
approved by the Council to accelerate development and regeneration through-out
the area. This Fund will help support a number of important projects that are outline
below.
Major proposals for the regeneration of Queens Quay in Clydebank were granted
planning permission in principle in March 2016. These include over 1,000 homes,
retail, leisure, office and public realm uses. Plans are also being progressed for an
84 bed care home and new health centre on the site and the possibility of a district
heating scheme. Towards the town centre the Council is progressing plans with
Sustrans to invest £4.3m in improving Glasgow Road and Dumbarton Road to
create better connections between the town centre and the waterfront whilst
providing an enhanced setting for the town’s civic buildings. The former Playdrome
site in the town centre has been marketed to developers to provide new facilities on
19the site and the new £22m leisure centre at Queens Quay which replaces the
Playdrome opened in April 2017.
The Exxon City Deal project at Bowling has funding of £27.897m over the next
seven years. This would see the transformation of the former Exxon Mobil site and
improved road access along a section of the A82 trunk road. A detailed project
business case will be presented to the Council for approval in February 2017.
Both the Queens Quay and Exxon Mobil sites represent significant brownfield former
industrial sites in West Dunbartonshire, amounting to nearly 200 acres, which the
Council is seeking to regenerate.
The three strategic projects above will continue to be informed and supported by
Equality Impact Assessment Processes.
Progress has been made by Scottish Canals to enhance and restore the existing
built heritage at Bowling Basin. A second phase of works to provide ism space
within the lower historic railway arches is close to completion and works to enhance
the entrance area are imminent. The Council is now in discussions with Scottish
Canals regarding the delivery of a number of major elements of their proposals
including housing and roads and bridge infrastructure which have now received
planning consent.
Progress with the new town centre office development for completion by January
2018 and the development of proposals for a waterfront walk and cycle way from the
town centre to the Rock and Castle are key activities that the Council has
progressed in Dumbarton in the past year. This investment and previous
expenditure on the new town centre road access has helped stimulate recent private
sector development plans along the waterfront by Turnberry, Culross and Lidl who
are all now at planning application stage.
At Lomondgate, planning permissions have been achieved for a 54 bed extension to
the Premier Inn and 58 residential units at area 5 and an additional 52 residential
units have been built in this year.
A recent review of Lomondgate by Strathleven Regeneration CiC showed that, by
April 2016, Lomondgate had delivered £99m of private sector investment, 692 full-
time equivalent jobs, 344 homes completed, 390,000 ft² of employment floorspace,
approximately £745,000 in Council Tax contributions per annum, £7.5m invested in
road infrastructure, drainage and services and 68.9 acres of land developed or in
development. Nearby, the Council as continued to support the Business
Improvement District (BID) at the Vale of Leven Industrial Estate to complete their
Improvement Plan for the area by June 2017.
The Mitchell Way area in Alexandria is a key regeneration site, owned by WDC. A
preferred bidder was selected for the site in March 2016 to deliver a foodstore
(25,000 square feet) with 145 car parking spaces as a first phase and a three storey
development facing Bank Street and Mitchell Way as a second phase - comprising
of 10 retail units and 24 residential units. As part of wider works the Council has
20instructed the demolition of a number of redundant properties in the town centre, to
enable future development and improvements to the town centre.
The Council is working in partnership with Loch Lomond and the Trossachs National
Park Authority and Scottish Enterprise to deliver actions from the Balloch Charrette.
A notional allocation of £1.2m has been set aside by the Council from the
Regeneration Fund towards the creation of public squares within the Main Street
and adjacent to the train station.
A Citizens’ Panel survey carried out in 201530 revealed respondents’ perceptions of
the attractiveness of town centres. The table below shows that fewer than a quarter
overall said they felt their town centre was attractive, while this falls to only 7% for
Dumbarton (where 58% of respondents rated the town centre as ‘not attractive at
all’) and 10% for Alexandria (where 43% rated the town centre as ‘not attractive at
all’).
How attractive is your town centre?
Business Activity
In 2016 there were 1,535 enterprises in West Dunbartonshire31. The definition of an
Enterprise is the smallest combination of legal units (generally based on VAT and/or
PAYE records) which has a certain degree of autonomy within an Enterprise Group.
An individual site (for example a factory or shop) in an enterprise is called a local
unit. The majority of these enterprises (86.5%) are ‘micro’ businesses employing up
to 9 employees. This is slightly smaller than the Scottish figure of 87.8%. The
following charts and tables demonstrate comparisons of business sizes between
West Dunbartonshire and Scotland overall.
21West Dunbartonshire Scotland
(Numbers) (%) (Numbers) (%)
Enterprises
Micro (0 To 9) 1,535 86.5 150,985 87.8
Small (10 To 49) 205 11.5 17,470 10.2
Medium (50 To 249) 30 1.7 2,755 1.6
Large (250+) 5 0.3 690 0.4
Total 1,775 - 171,900 -
22West Dunbartonshire Scotland
(Numbers) (%) (Numbers) (%)
Local Units
Micro (0 To 9) 1,885 77.9 177,410 81.2
Small (10 To 49) 450 18.6 33,455 15.3
Medium (50 To 249) 65 2.7 6,560 3.0
Large (250+) 15 0.6 1,050 0.5
Total 2,420 - 218,470 -
Note: % is as a proportion of total (enterprises or local units)
Tourism
West Dunbartonshire combines natural scenic beauty with a proud historic and
industrial past rich with shipping heritage, marine engineering, and the printing and
dyeing of textiles. The area comprises 70 square miles of combined waterfront
offering a definitive urban and rural contrast and historic landscape within 20 minutes
from Glasgow Airport. Its boundary takes in part of Loch Lomond (South) which falls
within Loch Lomond and Trossachs National Park and is easily accessible from
Glasgow by car, train, bus, boat and bicycle. The area is well connected to
neighbouring regions along the River Clyde and also Forth & Clyde Canal where by
marine tourism can provide further opportunities for development. The area also
benefits from day visitors from Inverclyde Cruise Ships that are attracted to Loch
Lomond Shores as a destination and ease of connection along the A82.
Scottish Tourism Economic Activity Monitor (STEAM) figures for the economic
impact of tourism in West Dunbartonshire revealed the following results:
916,200 visitors to the area generating £10.53m
606,050 day visitors (66%)
100,610 staying with family and friends (11%)
170,620 staying in paid serviced accommodation (19%)
38,910 staying in paid non-serviced accommodation (4%)
2,590 full time direct jobs created through tourism and hospitality sector (7.8% of
all area’s jobs)
2,040 all registered enterprises with 10% in accommodation and food and service
sector (Business Demography 2015)
West Dunbartonshire plays host to Dumbarton castle, Auchentoshan Distillery, proud
shipping heritage around the River Clyde including the Scottish Maritime Museum in
Dumbarton and Titan Crane in Clydebank Queens Quay, as well as a range of retail
and leisure pursuits at Loch Lomond Shores at the gateway to Loch Lomond.
The area also accommodates varied outdoor pursuits and events including the
annual Scottish Pipeband Championships, Loch Lomond Highland Games, the
annual Great Scottish Swim at Loch Lomond and more recently, the Rock of Ages
event at Dumbarton Castle. These have been key events in attracting a significant
number of visitors to the area and boosted tourism revenue for West Dunbartonshire.
The development of the Council’s Local Development Plan, Infrastructure Investment
Plan 2012 and refreshed Economic Development Strategy 2015 - 2020 have
23influenced a number of regeneration priorities for the area and will have an impact of
tourism. As well as continuing efforts to regenerate our town centres, a new priority
for the Council is to work with partners and private land owners to enable the
redevelopment of West Dunbartonshire’s key regeneration sites. Information is
provided for a number of these sites below and regarding any significant national
projects.
Significantly, the Council has approved an allocation of £12.4m from its
Regeneration Capital Fund to accelerate development and regeneration through-out
the area. So far notional allocations to the total sum of £7m have been agreed for a
number of important projects – Clydebank A814 (£2.3m), Bowling Basin (£2m),
Dumbarton Walk and Cycle Way (£1.5m) and Balloch Village (£1.2m). The overall
result will be inward investment, employment opportunities and an improved quality
of life for our communities, which in turn will have a significant positive impact on
attracting further tourists and visitors to the area.
Bowling Basin - where the Forth and Clyde Canal enters the Clyde, has great
potential for increased tourists and visitors. Progress has been made by Scottish
Canals to enhance and restore its existing built heritage, including the refurbishment
and restoration of former railway arches to create new business space and promote
activity on the Canal. A community charrette took place in 2014, which has shaped
Scottish Canal’s masterplan for the area. The Council is now in discussions with
Scottish Canals regarding the delivery of a number of major elements of their
proposals including housing and roads and bridge infrastructure which have now
received planning consent.
Lomondgate, Dumbarton encompasses a development site extending to some 106
acres straddling the A82 on the north western edge of Dumbarton. The Lomondgate
development is being taken forward by Strathleven Regeneration Community
Interest Company in partnership with the Walker Group. The site covers 94 acres on
the north western edge of Dumbarton and on either side of the A82. BBC Scotland
and residential development occupy the southern side. On the northern side a 60
bed Premier Inn Hotel, a Brewers Fayre pub, restaurant and drive-thru Costa Coffee
are operational as well as additional roadside services.
The Premier Inn is currently constructing an extension to accommodate a further 54
bedrooms. This particular part of the development provides facilities for tourists
heading to and from Argyll and Bute and beyond. A 200,000 sq. ft. business park
and village are proposed as the major remaining developments. Significantly a
190,000 sq. ft. manufacturing facility for Aggreko was officially opened in April 2012
and the entrance to the northern edge of Lomondgate is now marked by a stag
sculpture. A recent review of Lomondgate by Strathleven Regeneration CiC showed
that, by April 2016, Lomondgate had delivered £99m of private sector investment,
and 692 full-time equivalent jobs.
Balloch, Loch Lomond: The Council is working in partnership with Loch Lomond and
the Trossachs National Park Authority and Scottish Enterprise to deliver actions from
the Balloch Charrette which took place in early 2016. Many of the actions seek to
enhance Balloch as a major tourist location. This includes investment in the West
Riverside site as a major tourist attraction for the area and the creation of public
24squares within the Main Street area and adjacent to the train station, to create a high
quality and welcoming arrival space.
Dumbarton Town Centre and Waterfront: The town of Dumbarton has a magnificent
setting on the banks of the River Leven, overlooking the Clyde and Dumbarton
Castle and Rock. The town has a number of opportunities to maximise its tourism
potential. Levengrove Park is currently benefiting from £3.7m of Heritage Lottery
Funding for restoration works.
The Council is progressing a new town centre office development for completion by
December 2017 and has developed proposals for a waterfront walk and cycle way
from the town centre to the Rock and Castle. This investment and previous
expenditure on a new town centre road access has helped stimulate recent private
sector development proposals.
The Charrette Action Plan for Dumbarton Rock and Castle approved in September
2015 and the Revised Urban Strategy for Dumbarton Town Centre and Waterfront,
approved in November 2014 set out further priorities for the town and waterfront
area, which the Council is taking forward with its partners.
Clydebank: Major proposals for the regeneration of Queens Quay in Clydebank were
granted planning permission in principle in March 2016. These include over 1,000
homes, retail, leisure, office and public realm uses. Plans are also being progressed
for a care home, new health centre a district heating scheme. Overall the Council is
investing over £15m as part of a joint venture with the site’s owners to transform this
part of the Clyde Waterfront.
Towards the town centre the Council is progressing plans with Sustrans to invest
£4.3m in improving Glasgow Road and Dumbarton Road to create better
connections between the town centre and the waterfront whilst providing an
enhanced setting for the town’s civic buildings. The former Playdrome site in the
town centre has been marketed to developers to provide new facilities on the site
and the new £22m leisure centre at Queens Quay which replaces the Playdrome
opened in 2017.
Exxon City Deal Investment, Bowling: The Exxon City Deal project at Bowling has
funding of £27.897m over the next seven years to transform the former industrial, 81
acre site. This would include improved road access for tourists and visitors, with the
creation of a section of relief road to alleviate future congestion along the A82 trunk
road.
Housing
The latest Scottish Index of Multiple Deprivation (SIMD16) reveals that 7% (8 out of
121) of West Dunbartonshire’s datazones are in the 15% most deprived in Scotland
under the Housing domain.
The Local Housing Strategy 2017 – 202232: More Homes, Better Homes West
Dunbartonshire published in November 2016 provides the strategic direction for
housing services across all tenures and informs the future investment in housing
25and related services across West Dunbartonshire. It focuses on the following five
themes:
Housing Need and Demand;
Promoting Good Quality Housing;
Homelessness and Housing Options;
Sustainable and Supportive Communities; and
Addressing Particular Housing Needs.
The strategy sets out how West Dunbartonshire Council and its partners plan to
address the housing challenges, and take up the opportunities, presented over the
five year period 2017/18 – 2021/22. It introduces the Council’s ambitious More
Homes West Dunbartonshire initiative to maximize the delivery of new affordable
housing. The strategy’s approach to equalities was noted as strength by the
Scottish Housing Regulator.
There has been an average of 191 new owner occupied houses constructed in West
Dunbartonshire each year for the past 10 years. Over the period around 64% of
private sector completions have been in Dumbarton and the Vale of Leven.
A Housing Needs and Supply Assessment33 (HNDA) was undertaken through the
Clydeplan group of 8 local in the Glasgow and Clyde Valley city region area and
completed in 2015 as part of the proposed Strategic Development Plan.
The HNDA shows a continuing reduction anticipated in West Dunbartonshire’s
population, due primarily to net outmigration.
Whilst the projected population in West Dunbartonshire continues to decline, the
number of households is projected to increase. This trend is reflected across both
the private and social rented tenures.
Over the city region as a whole, the 2015 HNDA estimates suggest more muted
growth in the private sector and more significant growth in the Social Rented /Below
Market Rent sector compared with the previous HNDA. The study noted the
following characteristics of the make-up of housing in West Dunbartonshire:
West Dunbartonshire has a higher than average proportion of flats than most
local authorities at 51%, with only the four Scottish cities having more (and
against a Scottish average of 38%).
It has a higher than average percentage of dwellings in the lowest three Council
Tax bandings (A-C).
Almost half of West Dunbartonshire Council’s own housing stock is of non-
traditional construction
House prices34 in West Dunbartonshire generally remain below the Scottish
average, as do household incomes. The chart and tables below gives an indication
of the West Dunbartonshire house prices by type and in comparison with the
Scottish equivalents. Over the same period, in West Dunbartonshire the volume of
house sales increased by 8.3%, though this compares with a Scottish increase of
18.2%
26Average Property Prices
300,000
250,000
200,000
150,000
100,000
50,000
0
Jan-Mar 2015
Jan-Mar 2016
Jan-Mar 2015
Jan-Mar 2016
Jan-Mar 2015
Jan-Mar 2016
Jan-Mar 2015
Jan-Mar 2016
Jan-Mar 2015
Jan-Mar 2016
All Detached Semi Terraced Flat
WD Scotland
Average Property Price
Jan-Mar 2015 Jan-Mar 2016
WD 118,737 100,469
Scotland 173,731 159,198
Detached Semi Terraced Flat
Jan-Mar Jan-Mar Jan-Mar Jan-Mar Jan-Mar Jan-Mar Jan-Mar Jan-Mar
2015 2016 2015 2016 2015 2016 2015 2016
WD 245,163 224,839 136,953 107,990 109,746 93,166 70,842 62,627
Scotland 267,375 236,249 164,032 150,051 141,298 126,434 132,606 122,801
Households in Fuel Poverty
A household is considered to be in fuel poverty if it is required to spend more than
10% of its disposable income (including housing benefit or income support for
mortgage interest) on all household fuel use.
According to the latest data, West Dunbartonshire’s rate of fuel poverty is lower than
the Scottish average and in comparison to most other areas in Scotland (see charts
below).
27Fuel poverty levels by Local Authority
Eilean Siar
Orkney Islands
Highland
Dumfries And Galloway
Shetland Islands
Scottsih Borders
Argyll and Bute
Aberdeenshire
Dundee city
North Lanarkshire
South Ayrshire
North Ayrshire
Stirling
Inverclyde
Angus
Moray
Glasgow city
Perth and Kinross
East Ayrshire
Clackmannanshire
Fife
East Lothian
South Lanarkshire
East Renfrewshire
East Dunbartonshire
Falkirk
Midlothian
West Dunbartonshire
Aberdeen City
Renfrewshire
City of edinburgh
West Lothian
0% 10% 20% 30% 40% 50% 60% 70%
Earnings
In 2016 the gross average earnings35 for West Dunbartonshire - by place of
residence - was £519.20 per week. This is lower than the Scottish average of
£536.60 and the Great Britain average of £541.00.
The gender pay gap(%)36 for median gross hourly earnings (excluding overtime) for
West Dunbartonshire as at April 2016 for all employees - which includes full time and
part time employees) - was lower than the average for Scotland and Great Britain
and the gap is significantly wider for full time employees. Part time employee data at
West Dunbartonshire level has not been published because the estimate was
considered unreliable for practical purposes or disclosive.
Area All employees Full-time employees
Great Britain 18.4 9.9
Scotland 15.6 6.2
West Dunbartonshire 14.5 13.9
28Employment
The number of people who were in employment in West Dunbartonshire to
September 2016 was 42,800 representing 73.6% of the working age population.
This represents a 6.7% increase on last year’s figures of 40,100. These figures
reflect some improvement in the Scottish Economy since year. The following chart
shows that the area is performing slightly better than the Scottish average.
29The latest Scottish Index of Multiple Deprivation (SIMD16) reveals that 27% (33 out
of 121) of West Dunbartonshire’s datazones are in the 15% most deprived in
Scotland under the Employment domain.
Jobs by industry
In 2015 there were 31,000 employee jobs in the area37. 20,000 were full-time
positions and 11,000 were part time.
These jobs were predominantly in the following industries:
Human health and social work activities 7,000
Wholesale and retail trade; repair of motor vehicles and motorcycles 4,500
Public administration and defence; compulsory social security 3,500
Education 3,000
Accommodation and food service activities 2,500
Manufacturing 2,250
Financial and insurance activities 2,000
Job Density
The Job density figure shown represents the ratio of total jobs to working age
population. Total jobs include employees, self-employed, government supported
trainees and HM forces. A job density figure of 1.0 would mean there was a job for
every working person, anything less than 1 means there are fewer jobs than
needed.
The job density figure for West
Dunbartonshire is 0.57 a decrease
from last year’s figure of 0.61.
Job Density
0.57 Total number Many people from West
Dunbartonshire travel to work in
of jobs 42,800 Glasgow City. The job density
figure for Glasgow has increased
from 0.93 to 1.05.
This may have a positive impact on West Dunbartonshire’s workforce, who depends
on Glasgow for employment
30Economic Inequalities
The Recession affects different groups in different ways.
At a Scotland level the aggregated unemployment level for non-white ethnic groups
continues to be twice that White ethnic groups. Employment rates are also lower.
Employment rates for disabled people also continue to lag well behind. The table
below demonstrates the variance between West Dunbartonshire and Scotland.
WDC Scotland
Overall employment rate 73.6% 73%
Employment rate ethnicity: White groups 69% 74%
Employment rate ethnicity: Black groups 100%* 59%
Disabled 43% 44%
Over 50 36% 40%
Data shows similar gaps to Scotland, apart from for Black groups which is the
opposite of the national picture, however the figure of 100%* above is an estimated
based on a very small sample of people so it should be treated with caution,
especially as the figure has varied widely in the year up to the publication of these
latest figures from July 2016. National data continues to show that people from
Black minority ethnic groups are twice as likely to be unemployed, as people from
White groups.
The latest Scottish Index of Multiple Deprivation (SIMD16) reveals that 31% (38 out
of 121) of West Dunbartonshire’s datazones are in the 15% most deprived for
Scotland under the Income domain. At the national level, people non-White minority
ethnic groups are twice as likely to be in poverty as those from White groups.
Unemployment
The level of unemployment at September 2016, the most recent figure, was 6.2%
compared to 4.9% for Scotland and the UK, the figure represents a 17.6% decrease
in unemployment levels within West Dunbartonshire compared with period last
year.38
Welfare and Benefits
The Department of Work and Pensions statistics for working age people for the year
up to February 2016. There are 840 less people claiming out of work benefits in
West Dunbartonshire than in the previous year a reduction of 8.5%. Table 10 gives
this year’s figures which show that 19.2% of the working age population derive some
or all of their income from benefits.
31Claimants of Key Benefits 2016
West Dun. West Dun. (%) Scotland (%) GB (%)
Total Claimants 11,220 19.2 13.7 11.8
By Statistical Group
Job Seekers 1,610 2.8 1.8 1.5
ESA/Incapacity 6,220 10.7 7.9 6.2
Lone Parents 910 1.6 1 1.1
Carers 1,240 2.1 1.6 1.6
Others On Income
200 0.3 0.2 0.2
Related Benefits
Disabled 900 1.5 1 1
Bereaved 130 0.2 0.2 0.2
Out-Of-Work Benefits 8,940 15.3 10.8 9
The figures are improving and there has been a narrowing of the gap between West
Dunbartonshire and Scotland overall.
Child and Working Tax Credits
H. M .Revenue and Customs records the number of families in receipt of tax credits.
This is the recommended proxy indicator of child poverty levels in local areas. The
most recent information39 shows that 7,300 families in West Dunbartonshire were in
receipt of child and working tax credits, a decrease of 200 on the previous period
Working Families tax Credit
Of this group there were 2,700 working families who would be described as
experiencing in-work poverty, a reduction of 100 families from the previous year.
Adult Learning
Increasing opportunities for lifelong learning coupled with improving educational
attainment continue to be central to long term workforce planning in the area.
Increasing economic growth from industries requiring high levels of both technical
and professional skills relies on a better educated and more skilled workforce.
The latest Scottish Index of Multiple Deprivation (SIMD16) reveals that 18% (22 out
of 121) of West Dunbartonshire’s datazones are in the 15% most deprived in
Scotland under the Education domain.
32You can also read