The Harmful Effects of Denial: When Political Polarization meets COVID-19 Social Distancing
←
→
Page content transcription
If your browser does not render page correctly, please read the page content below
Middle Atlantic Review of Latin American Studies, 2021
Vol. 4, No. 3, 10-30

 The Harmful Effects of Denial: When
 Political Polarization meets COVID-19
 Social Distancing

 Tharcisio Leone
 German Institute for Global and Area Studies (GIGA)
 & Freie Universität Berlin
 tharcisio.leone@giga-hamburg.de

 This work uses anonymized geolocation data from 60 million mobile phone users in Brazil to
 quantify the impact of coronavirus lockdown measures on social distancing. The results
 confirm that the current share of the population staying home is lower than the target set by
 the public authorities to combat the spread of COVID-19. Using difference-in-difference and
 panel data regression to evaluate the determinants of social distancing, this paper confirms a
 statistically significant association between political support for Bolsonaro and social
 distancing. Since the Brazilian president is urging the population to ignore the COVID-19
 “hysteria" and get back to a normal routine, the impact of social distancing rules on the
 circulation of people is lower at a statistically significant level in municipalities with a higher
 share of Bolsonaro voters.

 Keywords: COVID-19, social distancing, behavioral change, geolocation data, Brazil

 Este trabajo utiliza datos anonimizados de geolocalización de 60 millones de usuarios de
 teléfonos móviles en Brasil para cuantificar el impacto de las medidas estatales de
 confinamiento (lockdown) por el coronavirus en el distanciamiento social. Los resultados
 confirman que la proporción actual de la población que permanece en el hogar es inferior al
 objetivo fijado por las autoridades públicas para combatir la propagación del COVID-19.
 Utilizando los métodos de diferencia-en-diferencia y de regresión de los datos de panel para
 evaluar los determinantes del distanciamiento social, este estudio confirma una asociación
 estadísticamente significativa entre el apoyo político a Bolsonaro y el distanciamiento social.
 Dado que el presidente brasileño está instando a la población a ignorar la “histeria” alrededor
 del COVID-19 y a volver a la rutina normal, el impacto de las reglas de distanciamiento social
 en la circulación de las personas es menor y estadísticamente significativo en los municipios
 con una mayor proporción de votantes por Bolsonaro.

 Palabras clave: COVID-19, distanciamiento social, cambio de comportamiento, datos
 de geolocalización, Brasil

© 2021 The Author. Published by the Middle Atlantic Council of Latin American Studies on the
Latin American Research Commons (LARC) at http://www.marlasjournal.com
DOI: 10.23870/marlas.327
Leone – The Harmful Effects of Denial

Introduction and Literature Review
 Since the initial outbreak of COVID-19 in Wuhan, China, the coronavirus has spread rapidly
across the world, with the World Health Organization (WHO) declaring the disease a global pandemic
on March 11, 2020 (Cucinotta and Vanelli 2020). In the absence of any vaccine to protect against
COVID-19, the WHO has recommended the implementation of nonpharmaceutical interventions
(NPIs) to slow the spread of infection and reduce the intensity of the epidemic, thus reducing the risk
of overwhelming health systems (Singh and Adhikari 2020; Kissler et al. 2020). Among the diverse
forms of NPIs, mathematical modeling of transmission has indicated that social distancing practiced
by the population as a whole is the most effective way to combat the spread of the coronavirus (see,
e.g., Koo et al. 2020; Ferguson et al. 2020).

 For this reason, public officials around the world are urging the people to stay home and
maintain a minimum social distance from one another of approximately two meters. In many
countries, governments have implemented strict lockdown policies in response to the COVID-19
outbreak. Interventions such as shutting down schools, facilitating working from home and canceling
large events have become common and are communicated as temporary, but necessary, measures to
“flatten the curve” (Ioannidis 2020). However, the impact of these social distancing measures depends
critically on how people respond to their introduction, which is highly likely to vary across time, from
country to country, and even from community to community (Briscese et al. 2020).

 Although stay-at-home orders become a part of everyday life around the world, very little is
known about the effectiveness of these measures in Latin America, given the methodological
difficulties in quantifying precisely the circulation of the population outside their residences. However,
a key metric for the success of the curve-flattening strategies is continuous monitoring. Having real-
time insight into the flow of people may yield useful information for the local authorities to manage
their social distancing interventions.

 Therefore, many technology companies (Google, Apple, and Facebook) have applied the
geolocation data from their users to produce information on mobility and economic trends during the
coronavirus pandemic (Ghader et al. 2020). Consequently, mobile device data became popular for
empirical investigations of human behavior during the lockdown measures. Karim and Chan (2020),
for example, use the Facebook mobility data, which tracks the location of the users with the mobile
version of the application, to estimate the effect of political party affiliation of municipal mayors on
regional movement of people in Brazil. To investigate the risk attitudes and human mobility in the
US, Chan et al. (2020) apply mobility measures on country and regional levels from the Google
Community Mobility Reports, which record the visits and lengths of stay of Google users in six
different categories of places (e.g., grocery stores, parks, train stations). Meanwhile, Hadjidemetriou
et al. (2020) apply the Apple Mobility Trends Reports containing real-time data on driving, walking,
and transit use to investigate the impact of government control measures on human mobility
reduction in the UK.

 11
 MARLAS 4(3), 2021, DOI: 10.23870/marlas.327

Middle Atlantic Review of Latin American Studies

 Since the mobility data provided by these technology companies focuses the mobility measures
on specific categories of locations (e.g., transit stations and grocery stores in the Google Community
Mobility Reports) or different types of activities (e.g., driving and walking in the Apple Mobility
Trends Reports), and are limited to the users of the respective companies, researchers have begun to
utilize geospatial information from data companies for the analysis of social distancing (Delen et al.
2020). Companies such as SafeGrap, Unacast and VenPath in the US and In Loco in Brazil manage
anonymized geolocation data of users of mobile application services and have made their datasets
freely available to researchers during the coronavirus pandemic, creating the fundamental cornerstone
for a whole range of studies concerning social distancing (see, for the US, e.g., Brzezinski et al. 2020;
Chiou and Tucker 2020; Coven and Gupta 2020; Farboodi, Jarosch, and Shimer 2020; Painter and
Qiu 2020; Villas-Boas, Sears, and Villas-Boas 2020; and for Brazil, e.g., Ajzenman, Cavalcanti, and Da
Mata 2020; Fernandes et al. 2020; Mariani, Gagete-Miranda, and Retti 2020; Peixoto et al. 2020).

 In line with this trend, this paper applies anonymized mobile phone data from approximately
60 million users in Brazil to identify the main driving forces behind social distancing and is broadly
divided into two parts: the first presents the results of social distancing since the introduction of
lockdown rules, while the second investigates whether the chances people will stay home are
associated with the political orientation of the area in which they live.

 This research is motivated by the contradictory policy responses to the COVID-19 pandemic
in Brazil. While public authorities from subnational governments have urged the people to stay home
and applied social distancing measures for the wider population, President Jair Bolsonaro has
repeatedly attacked these restrictions and advocated for the immediate return to previous daily
routines to mitigate the inevitable economic impact of the lockdown. The main hypothesis of this
work is that municipalities with a higher proportion of Bolsonaro supporters perform less physical
distancing because the president’s supporters are following his recommendations that undermine
social distancing guidelines.

 Therefore, this paper enters the broader discussion about the role of political attitudes in
determining physical distancing responses. Recent investigations carried out during the corona crisis
have demonstrated that this association does matter. Using GPS data from smartphone users, several
studies indicate a lower social distancing effectiveness in US regions with higher Republican vote
shares (see, e.g., Allcott et al. 2020; Gadarian, Goodman, and Pepinsky 2020; Grossman et al. 2020;
Painter and Qiu 2020). Similarly, Cornelson and Miloucheva (2020) demonstrate using an MTurk
survey that the willingness to comply with social distancing measures is lower in more polarized US
states. The influence of political attitudes on social distancing behavior has also been examined for
Brazil (see, e.g., Ajzenman, Cavalcanti, and Da Mata 2020; Calvo and Ventura 2020; Fernandes et al.
2020; Karim and Chan 2020; Mariani, Gagete-Miranda, and Retti 2020).

 The empirical analyses of Ajzenman, Cavalcanti, and Da Mata (2020), Karim and Chan (2020),
Fernandes et al. (2020), and Mariani, Gagete-Miranda, and Retti (2020) are excellent companions to
this paper. Karim and Chan (2020) applied the Facebook mobility data to estimate the effect of
political party affiliation of municipal mayors on social distancing of the population. According to the

 12
 MARLAS 4(3), 2021, DOI: 10.23870/marlas.327
Leone – The Harmful Effects of Denial

authors, the residents of Bolsonaro-affiliated municipalities had a 60-percent smaller reduction in
regional movement than the residents of the control municipalities. As I do in this paper, Ajzenman,
Cavalcanti, and Da Mata (2020), Fernandes et al. (2020) and Mariani, Gagete-Miranda, and Retti (2020)
combined the electoral results of Bolsonaro in 2018 with the In Loco geolocalized mobile phone data.
While Ajzenman, Cavalcanti, and Da Mata (2020) and Mariani, Gagete-Miranda, and Retti (2020)
found that social distancing decreased after Bolsonaro’s public statements against social isolation
policies in those municipalities where he received the majority of votes in the 2018 election, the results
of Fernandes et al. (2020) indicate that the higher the proportion of votes for Bolsonaro in any given
municipality in 2018, the higher the number of COVID-19 deaths there, corresponding to higher
transmission rates caused by a lower rate of effective social isolation.

 Compared with the studies mentioned above, this paper presents some methodological
differences: First, I focus the empirical investigation on physical distancing during the pandemic,
applying the Social Distancing Index (SDI) based on geolocalized mobile phone data as a dependent
variable in the empirical analysis, and not as an instrumental variable to investigate the COVID-19
outputs—measured in terms of the number of deaths, confirmed cases, and mortality rate—as in
Fernandes et al. (2020). Second, this paper seeks to develop a novel approach, with the goal of
expanding the empirical investigation to the municipalities where Bolsonaro had low political support.
While Ajzenman, Cavalcanti, and Da Mata (2020) and Mariani, Gagete-Miranda, and Retti (2020)
assume as their treatment group only the municipalities in which the president achieved more than 50
percent of the votes in 2018, this work integrates all the municipalities, presenting a linear relationship
between Bolsonaro’s support and social distancing. In addition, I expand the investigation to a period
of 103 days (February 1, 2020 – May 14, 2020) in contrast to the 17 days of Mariani, Gagete-Miranda,
and Retti (2020) and the 20 days of Ajzenman, Cavalcanti, and Da Mata (2020).

 Brazilian policy responses to the COVID-19 pandemic provide the basis for an extremely
promising area of research. To date, Brazil has imposed no nationwide lockdown rules, in contrast to
many other countries around the world. Instead, the states and municipalities are free to impose their
own restriction measures by means of executive decree. Starting with Distrito Federal on March 14,
2020, all Brazilian states have since implemented government interventions to prevent the spread of
COVID-19.

 13
 MARLAS 4(3), 2021, DOI: 10.23870/marlas.327
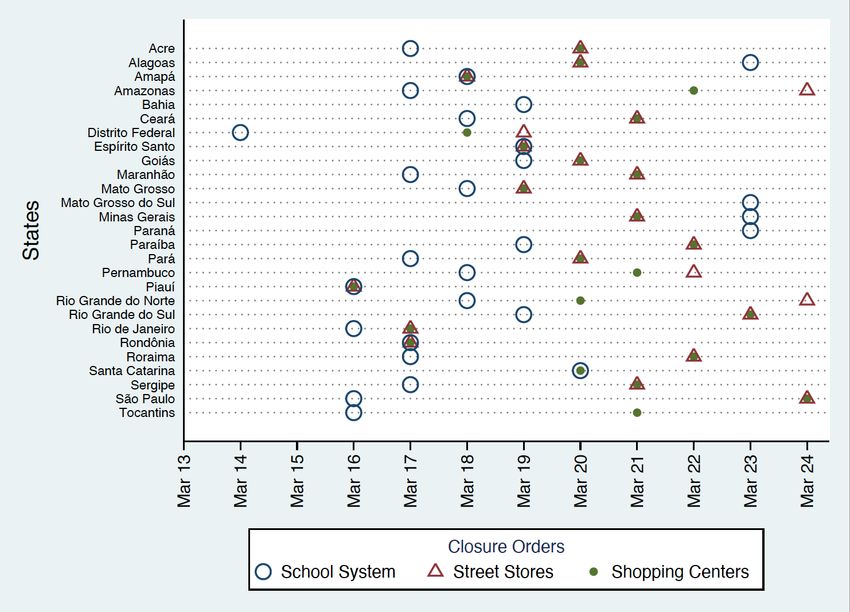
Middle Atlantic Review of Latin American Studies

Figure 1: Lockdown Measures by State

Notes: Lockdown measures refer to the decrees issued by state governments mandating the temporary
closing of establishments. Bahia, Mato Grosso do Sul and Paraná have no decree to close stores or
shopping centers. Santa Catarina and Tocantins have no decree to close stores.

Source: Official gazette of the respective states; author’s own elaboration.

 However, since the beginning of the coronavirus crisis, the reaction of President Bolsonaro
was characterized by denial (see, e.g., New York Times 2020; The Conversation 2020). On several different
occasions, the leader of the sixth-most populous country in the world has systematically ignored WHO
recommendations for combating the coronavirus pandemic (see table A1). According to Brazil’s
president, social distancing measures must be limited to those at the highest risk for becoming very ill
or dying from COVID-19. 1 Against this backdrop, the present paper will apply an econometric
approach to identify whether municipalities with more Bolsonaro supporters present lower levels of
social distancing.

1See Ricard and Medeiros (2020) for an extensive discussion on Bolsonaro’s actions to minimize the severity of the
coronavirus, discredit social isolation measures intended to mitigate the course of the disease’s spread, and increase the
distrust of public data.

 14
 MARLAS 4(3), 2021, DOI: 10.23870/marlas.327
Leone – The Harmful Effects of Denial

 The empirical results of this study show that the lockdown measures have not produced the
expected results. While public authorities have stipulated a social distancing target of 70 percent, I
show that after April on average only one in two people stayed at home on weekdays, and as time
went on, this share decreased even more. In addition, this paper confirms a statistically significant
association between political support for Bolsonaro and social distancing, suggesting that the positive
impacts of stay-at-home orders are higher in municipalities with a lower share of Bolsonaro voters.

Data
 This study combines four different datasets in the empirical investigation. The COVID-19
data are compiled daily by the Brazilian Health Ministry and contain the diagnosed cases of, and deaths
due to, coronavirus. The data on election results are from the Superior Electoral Court (TSE) and
refer to the first-round election held on October 7, 2018. The information on Gross Domestic Product
(GDP) and population comes from the Brazilian Institute of Geography and Statistics (IBGE). Finally,
the data on social distancing are provided by In Loco, a Brazilian technology company headquartered
in the city of Recife and with operational centers in São Paulo, New York, and Santa Clara, California.

 In Loco uses large-scale geolocation data collected via the Global Positioning System (GPS)
from 60 million smartphone users in Brazil. Thanks to the built-in GPS chip, modern mobile devices
can access satellite data to calculate the exact position of the users and provide a whole range of
functions, such as satellite navigation, geolocation-based social networking, personal sports
performance tracking, and so on (Sansurooah and Keane 2015). Consequently, an increasing number
of private and public companies are utilizing GPS technology to provide services through mobile
applications, also called apps.

 Seeing the resultant potential market, several start-up companies began to use this huge
geolocation database for commercial purposes. This is the background of the database used in this
paper. Founded in 2010, In Loco specializes in ubiquitous computing and has developed a software
module to collect data from mobile devices through a Software Development Kit (SDK) installed in
partner applications, allowing the company to track the geolocation data of approximately 60 million
smartphone users.2

 The recording software was designed to run in the background of the apps, uploading recorded
data automatically. For this to happen, the apps are required to inform the users that geolocation data
might be collected by the SDK, and only after the users accept In Loco’s privacy policy will the
software start collecting data. For privacy reasons, the company does not collect unique static
identifiers from mobile devices (IMEI and MAC), associated accounts (email address and telephone
number), civil identification data, or sensitive data (ethnicity, religion, political opinion, etc.). In
addition, the mobile advertising IDs are stripped out and encrypted to ensure data protection standards.
Therefore, the resulting data become strictly anonymized and do not enable any inference with the

2The concept of “ubiquitous computing” is used in software engineering to describe the technology to integrate
computing into all everyday activities of the users (see, e.g., Weiser 1999).

 15
 MARLAS 4(3), 2021, DOI: 10.23870/marlas.327
Middle Atlantic Review of Latin American Studies

user’s personal data, thus fulfilling the requirements set out in Brazilian law for data processing (Data
Protection Law and Civil Rights Framework for the Internet).

 Since the COVID-19 outbreak in Brazil, In Loco has been making use of this geolocation
database to create technological tools to support the public authorities and research bodies in
combating the spread of the coronavirus.3 Within this framework, four main projects related to the
COVID-19 pandemic are currently in progress: (i) direct communication with the population through
push notifications on government apps; (ii) an accounting system to avoid overcrowding of hospitals
and other essential services; (iii) mapping of the nonessential services that are not complying with the
isolation rules; and (iv) the creation of population-mobility indexes, which will be presented later in
these research notes.

 As of now, 22 of the 27 Brazilian states have direct agreements with In Loco to use the
geolocation database in the fight against COVID-19. With the Social Distancing Index (SDI) the
company provides a visualization of the regions with high levels of individuals leaving their residences,
allowing the government authorities to take immediate actions in order to increase the effectiveness
of the lockdown measures. The mailing of push notifications through government apps or the sending
of cars equipped with loudspeakers to highlight the importance of the lockdown rules are only some
examples of measures that have already been employed in areas with low levels of social distancing.

 The study database was supplemented by COVID-19 data obtained from the Brazilian Health
Ministry (MS). Since the eruption of the coronavirus crisis, the MS has made available on its website
a daily updated source of the most important data on COVID-19 in Brazil, containing the number of
confirmed cases, deaths, recoveries, and suspected cases divided into municipalities and days. This
information is reported electronically by the municipal secretariats of health through the Notification
System of the Health Ministry (e-SUS VE) and the Electronic System for the Monitoring of
Epidemiological Surveillance (SIVEP Gripe). While the former registers all the cases of flu, the latter
contains the cases of Severe Acute Respiratory Syndrome (SARS).

 The information about the political support for Bolsonaro stems from the Electoral Data
Repository of the TSE, which contains detailed results of all Brazilian elections since 1945. In this
paper, I use the microdata from the first-round presidential election of October 7, 2018, including the
votes received by each candidate/party and total votes cast at the constituency level. Finally, for the
GDP on a municipal level, I apply the database Gross Domestic Product of Municipalities of IBGE
from 2017. These data present the gross value added, at current prices, of the three major sectors of
the economy—Agriculture, Industry and Services—as well as taxes, net of taxes, GDP, and GDP per
capita from 2010 to 2014.

3All partnerships with In Loco are governed by contracts at zero cost to the institutions and involve the transfer exclusively
of anonymized data.

 16
 MARLAS 4(3), 2021, DOI: 10.23870/marlas.327
Leone – The Harmful Effects of Denial

Identification Strategy
 To identify the effects of political support for Bolsonaro on social distancing, I apply a
difference-in-difference (DiD) approach at the municipality level that compares the SDI pre- and post-
lockdown. The empirical model is given as:

Equation 1

 !,# = $ + % ( & !,'$%( 5 + ' & + ) !,'$%(
 + % !,#*% + ' ℎ !,#*% + ) !,'$%+
 + , + - ! + ! + & + # + !,#

where !,# denotes the Social Distancing Index in municipality and on day , & is a
dummy taking a value of 1 for each day after the stay-at-home order enacted by the respective state ,
and !,'$%( is the proportion of valid votes received by candidate Jair Bolsonaro in the first-
round election on October 7, 2018.4 The variables and ℎ are lagged values of
the accumulated confirmed cases and deaths due to COVID-19, and !,'$%+ denotes the
GDP per capita in 2017.5 and ! are dummies indicating whether any COVID-19
case had already been registered in Brazil and in the municipality , respectively, on that day.6 The
model also includes municipality-fixed effects ( ! ), time-fixed effects ( # ) and a random component
 !,# , assumed to be distributed as (0, ' ). Finally, the estimations are weighted by the respective
population sizes in 2019, and the standard errors are robust and clustered at the municipality level.

 The SDI ranges from 0 to 100 and is calculated as follows: First, In Loco uses the geolocation
data from the smartphones to identify the residential addresses of users, and each of these locations
becomes the center of a small circular region with a radius of 40 meters. If the mobile device visits a
location outside this circle, the software recognizes that as a home leave.7 Then, the SDI is calculated
initially within microregions, which are formed by regular polygons with six sides and a circumradius
of 450 meters (see figure 2). Consequently, the SDI for the microregion (polygon) corresponds to the
proportion of users with residences registered in this area that stayed within the 40-meter radius all
day.8 Finally, to ensure the identification of macrotrends, the results from the polygons are aggregated
at different administrative levels (municipal, state, and national) using the weighted average for the
mobile devices registered in the respective level.

4 Lockdown refers to the closing orders for schools, stores and shopping centers applied by the respective states (see figure
1). Given different dates, the earliest one was used.
5 To present a linear relationship in the regression outputs, the continuous variables , ℎ and

 are standardized to mean 0 and standard deviation 1.
6 Table A2 reports the descriptive statistics for the variables.
7 Movements within the 40-meter radius are not assumed to be breaching the lockdown rules, as they are necessary to

carry out essential daily activities, such as going to the supermarket, bakery, or pharmacy.
8 Due to data protection and privacy issues, the SDI is calculated only for microregions with more than 20 mobile devices.

 17
 MARLAS 4(3), 2021, DOI: 10.23870/marlas.327
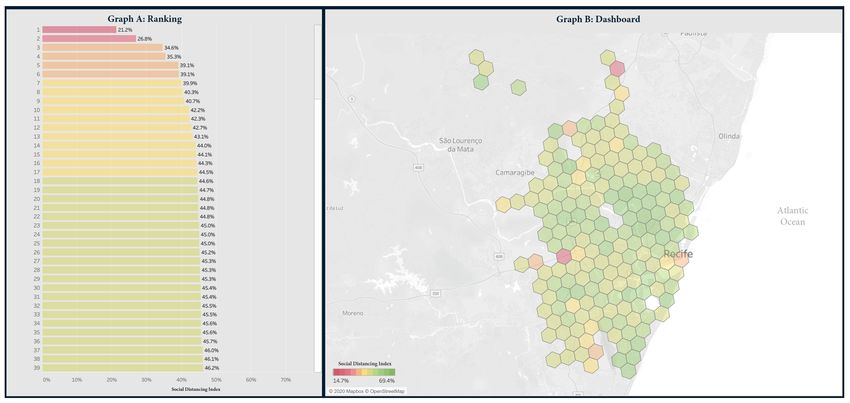
Middle Atlantic Review of Latin American Studies

Empirical Findings
Social Distancing Index

Figure 2 presents the first level of analysis and refers to the values of SDI in Recife on May 5, 2020.9

Figure 2: Social Distancing at the Micro Level

Notes: Social distancing represents the share of the population that stayed at home. Data are from
May 5, 2020, and not representative of the whole population. Graphs refer to the microregions
(polygons) located in the municipality of Recife. The regular polygons have six equal sides and a
circumradius of 450 meters. The color scale ranges from the minimum (in dark red) to the maximum
(in dark green) values of the Social Distancing Index (SDI) reported in the figure. SDI is calculated
only for microregions with more than 20 mobile devices.

Source: In Loco database; author’s own elaboration.

 In the dashboard the microregions (regular polygons) are illustrated independently on the right
side and sorted in ascending order with their respective index in the left graphic. The color scale ranges
from the minimum (in dark red) to the maximum (in dark green) values of the SDI reported in the
figure. The lower the value, the lower the share of the population that have stayed at home. Note that
on May 5, 2020, the SDI in Recife ranged from 21.2 to 62.3 percent, achieving an average value of
49.9 percent with a standard deviation of 5.5 percentage points.

9 The choice of Recife for the figure was random.

 18
 MARLAS 4(3), 2021, DOI: 10.23870/marlas.327
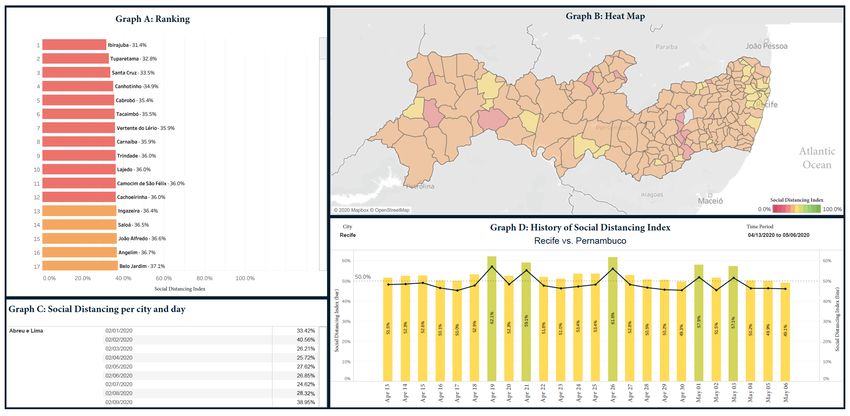
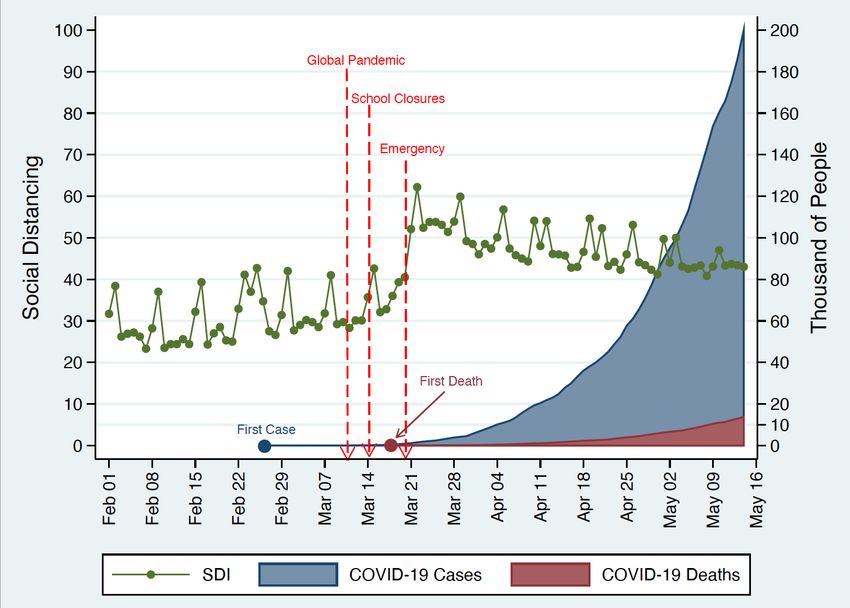
Leone – The Harmful Effects of Denial

 Figure 3 expands the investigation of social distancing to the state level. To that end, I average
the values of all (single) polygons located within the municipalities of Pernambuco, allowing for the
comparison of the SDI over time and between the municipalities.

Figure 3: Social Distancing at the Municipal Level

Notes: Social distancing represents the share of the population that stayed at home. Data are not
representative of the whole population. Graph A ranks the 185 municipalities in Pernambuco
according to the Social Distancing Index (SDI) of May 5, 2020, and graph B presents the same data in
a heat map. Graph C lists the daily SDI for all the municipalities since February 1, 2020. Graph D
illustrates the average value of SDI for the period from April 13, 2020, through May 10, 2020, for the
municipality of Recife (bar chart) and the state of Pernambuco (line chart). The color scale ranges
between the minimum (in dark red) and the maximum (in dark green) values of the SDI reported in
the figure.

Source: In Loco database; author’s own elaboration.

 As described in the introduction, the first objective of this work was to present the values of
social distancing since the introduction of the lockdown rules. Figure 4 plots the results of this exercise,
reporting the evolution of the SDI over time for the whole country and integrating into the
investigation the number of cases and deaths due to COVID-19. To combat the transmission of the
coronavirus, the responsible authorities in Brazil have set a goal of keeping 70 percent of the
population social distancing (São Paulo 2020), but as shown in figure 4 this target was achieved on
only one day during the period from February 26 to May 14, 2020.

 19
 MARLAS 4(3), 2021, DOI: 10.23870/marlas.327
Middle Atlantic Review of Latin American Studies

Figure 4: Evolution of Social Distancing Index

Notes: Social distancing represents the share of the population that stayed at home. Data are not
representative of the whole population. The WHO declared COVID-19 a global pandemic on March
11, 2020. On March 14, 2020, Distrito Federal was the first state to suspend schools and Paraná the
last on March 23, 2020. The state of emergency was declared by the federal government on March 20,
2020.

Source: In Loco and Ministry of Health databases; author’s own elaboration.

Impact of Support for Bolsonaro on Social Distancing
Table 1 reports the empirical findings from equation (1) applying OLS and FE models. While OLS
assumes that each observation is independent of any other, the FE identifies the two dimensions of
the data, following the same municipalities over time .

 20
 MARLAS 4(3), 2021, DOI: 10.23870/marlas.327
Leone – The Harmful Effects of Denial

 In the first step, I estimate the models using data for the 5,570 Brazilian municipalities and the
103 investigated days (February 1, 2020 – May 14, 2020).10 Next, since the coronavirus pandemic is
strongly concentrated in Brazil’s largest cities, I run the empirical models with the same time period as
before, but using only the 1,000 and 100 municipalities with the greatest number of recorded COVID-
19 cases (top 1000 and top 100).11 This limitation of the investigation to the municipalities with a real
COVID-19 outbreak is extremely important from a theoretical perspective to exclude the effects of
self-selection (see, e.g., Fernandes et al. 2020). Our key hypothesis is that Bolsonaro’s supporters are
persuaded by the president to take the risk of being infected and break the rules of social distancing.
In places with no registered cases of coronavirus there is practically no risk of infection, therefore the
decision to leave home will be less dependent on one’s individual political orientation.

 The response for the main research question of this paper—namely whether the effectiveness
of social distancing measures is associated with the political orientation of the population—can be
found in table 1. The main coefficient of interest is the interaction term between the dummy for
lockdown measures and the continuous variable presenting the proportion of valid votes received by
Bolsonaro in the first-round election of 2018, because it indicates whether the SDI changes according
to the share of Bolsonaro supporters in the municipality. As hypothesized from the beginning, this
coefficient is negative and significant for the models using the worst-hit cities by COVID-19, which
implies that—in the presence of a concrete risk of infection—the municipalities with a higher
percentage of Bolsonaro voters are likely to present lower shares of individuals staying at home.

10 For 952 (small-sized) municipalities the SDI could not be calculated, as the number of mobile devices within the
microregions (polygons) was lower than 20. The total population living in these municipalities in 2019 was 3,736,497,
which corresponded to 1.78 percent of the country’s population.
11 On May 14, 2020, these 1,000 (100) municipalities accounted for approximately 70 (36) percent of the country’s

population, but 96 (75) percent of its COVID-19 infections.

 21
 MARLAS 4(3), 2021, DOI: 10.23870/marlas.327
Middle Atlantic Review of Latin American Studies

Table 1: Empirical Results

 All Top 1000 Top 100
 (1) (2) (3) (4) (5) (6)
 OLS FE OLS FE OLS FE
Lockdown X Voting 0.025*** 0,009 -0,003 -0,014 -0.086*** -0.073***
 (3.021) (1.293) (-0.249) (-1.329) (-4.139) (-4.398)
Lockdown Measures 11.976*** -0,213 15.495*** 0,880 21.297*** 4.441***
 (28.851) (-0.573) (23.707) (1.623) (19.307) (5.746)
Voting for Bolsonaro 0.024*** 0,000 0.020*** 0,000 0,022 0,000
 (5.471) (.) (3.304) (.) (1.274) (.)
Lagged COVID-19 Cases 0.347** 0.226* 0.261** 0.176* 0 0,033
 (2.371) (2.234) (2.107) (2.022) (-0.005) (0.730)
Lagged COVID-19 Deaths -0.299* -0,172 -0.224* -0,130 -0,001 -0,013
 (-1.938) (-1.639) (-1.710) (-1.439) (-0.006) (-0.285)
GDP per capita 0.284** 0,000 0,183 0,000 -0,048 0,000
 (2.235) (.) (1.420) (.) (-0.244) (.)
COVID-19 in Brazil 2.514*** 2.081*** 2.510*** -7.904*** 2.504*** -13.645***
 (44.541) (5.257) (31.031) (-41.430) (16.807) (-53.244)
COVID-19 in Municipality 0,33 3.694*** -0.913*** 3.454*** -0,156 3.773***
 (1.455) (17.611) (-3.143) (13.765) (-0.255) (4.646)
Number of Observations 414.167 414.167 101.152 101.152 10.300 10.300
Number of Groups - 4.514 - 1.000 - 100
R-square 0,569 0,9 0,619 0,938 0,687 0,969
Weighted by Population Yes Yes Yes Yes Yes Yes
Municipality Fixed Effect No Yes No Yes No Yes
State Fixed Effect No Yes No Yes No Yes
Time Fixed Effect No Yes No Yes No Yes

Notes: Dependent variable is social distancing index. Top 1000 (100) focuses on the 1,000 (100)
municipalities with the greatest number of COVID-19 cases on May 14, 2020. Lagged COVID-19
cases, lagged COVID-19 deaths and GDP per capita are standardized to mean 0 and standard
deviation 1. Data are not nested within municipalities. Standard errors in parentheses are robust to
heteroskedasticity and clustered at the municipality level.

Source: In Loco, TSE, IBGE and Ministry of Health databases, author’s own estimates.

 To show how social distancing correlates to political support for Bolsonaro, I compute the
marginal effects from equation (1) for the top 100 municipalities and plot the adjusted predictions in
figure 5.

 22
 MARLAS 4(3), 2021, DOI: 10.23870/marlas.327
Leone – The Harmful Effects of Denial

Figure 5: Adjusted Predictions of Lockdown

Notes: The figure plots the predicted effects of political support for Bolsonaro on social distancing
using model 3 from table 1. Investigation is limited to the 100 municipalities with the greatest number
of COVID-19 cases on May 14, 2020. Social distancing represents the share of population that stayed
at home. Voting for Bolsonaro refers to the valid votes he obtained in the presidential election of
October 7, 2018. Solid points illustrate the linear prediction, with 95 percent confidence intervals, of
social distancing by changes in the percentage of votes for Bolsonaro given two different scenarios
(with and without lockdown measures). Data are not representative of the whole population.

 The resulting empirical evidence suggests that the impact of the lockdown is stronger in
locations with a lower share of Bolsonaro voters. Note that given lockdown measures, social distancing
decreases as political support for Bolsonaro rises (red line).

 23
 MARLAS 4(3), 2021, DOI: 10.23870/marlas.327
Middle Atlantic Review of Latin American Studies

Figure 6: Contrasts of Predictive Margins of Lockdown

Notes: The figure summarizes the differences in linear prediction margins between lockdown and no
lockdown presented in figure 5. Voting for Bolsonaro refers to the valid votes he obtained in the
presidential election of October 7, 2018. Data are not representative of the whole population.

Source: In Loco database; author’s own elaboration.

 Figure 6 summarizes the evolution of the difference between the two lines. In municipalities
with low political support for Bolsonaro social distancing increases by 21.2 points after lockdown
measures have been implemented, and in locations where Bolsonaro obtained the majority of the votes,
this percent is just 13.4.

Conclusion
 This work has presented the In Loco database to the academic community. Using geolocation
data from nearly 60 million smartphone users, the results show that in Brazil the coronavirus lockdown
measures applied by the state governors did not lead to the expected reduction in the circulation of
persons. Despite the promising increase in social distancing registered at the beginning of the
lockdown, the number of people staying home declined constantly in the subsequent weeks.

 24
 MARLAS 4(3), 2021, DOI: 10.23870/marlas.327
Leone – The Harmful Effects of Denial

 In addition, this paper set out to explore the determinants for the strong variation in social
distancing across Brazilian municipalities and integrated into the investigation the contradictory policy
responses to the COVID-19 pandemic on the part of the Brazilian public authorities. The key
assumption—that Bolsonaro’s supporters would follow his recommendations and undermine social
distancing guidelines—was confirmed. The impact of the state-run social distancing measures on the
circulation of people is lower at a statistically significant level in municipalities with a higher share of
Bolsonaro voters.

 Apart from the results for Brazil, an important contribution of this paper is the dissemination
of the technology behind the SDI to the research community. The case reported here—in which
geolocation data are compiled and analyzed to support public decisions concerning the confrontation
of the COVID-19 crisis—can serve as an example for other countries going through similar situations.
Given the low costs involved in the project, several other countries—including low-income developing
nations—will be able to incorporate this technology practically.

 Last but not least, the empirical findings presented in this study represent the state of the art
in science and technology when it comes to monitoring social distancing, and this technology can be
used in further research projects related to the coronavirus pandemic. Therefore, this work is only the
first step towards a more profound understanding of the health and economic burdens posed by
COVID-19. The in-depth insights into the lockdown and the opportunity to track SDI by geographic
region should make the database used in this paper attractive to the research community and
consequently support the development of numerous studies aiming to assess the economic
consequences of the lockdown measures related to COVID-19.

 Despite the compelling results presented in this paper, some limitations should be addressed
in future studies. The most obvious shortcoming of this work is the absence of controls for important
determinants of social distancing, such as the share of population employed in essential activities,
urban density, level of education and poverty, and access to and usage of media in any given
municipality. These factors might explain a substantial portion of differences in compliance among
the population and might be also correlated with voting preferences. If Bolsonaro’s supporters are
located in areas where social distancing is hard to maintain—because, for example, a high share of the
population is employed in essential activities—we may wrongly conclude that they are (intentionally)
following the president’s political guidelines to ignore the social distancing guidelines recommended
by the WHO. Therefore, the use of more accurate and complete data could contribute to improving
our understanding of the role of political views on determining physical distancing responses.

Acknowledgements
 Financial support for this research project was provided by a fellowship from the Friedrich
Ebert Foundation. The author is grateful to Merike Blofield, Alessa Durst, Barbara Fritz, Jan Priebe,
and Tevin Tafese for their valuable comments on an earlier version of this paper. Special thanks and
appreciation go to Luiza Botelho and Luciano Melo for technical support with the In Loco database.
All remaining errors are solely mine.

 25
 MARLAS 4(3), 2021, DOI: 10.23870/marlas.327
Middle Atlantic Review of Latin American Studies

Tharcisio Leone is an economist, research fellow at the German Institute of Global and Area Studies
(GIGA) and a PhD candidate in Economics at the Freie Universität Berlin (FU-Berlin). His research
mainly deals with education economics, intergeneration mobility, and income inequality in developing
countries. He has completed the Master’s degree in Public Economics (FU-Berlin) and Bachelor’s
degrees in Economics (Leibniz Universität Hannover) and Foreign Trade (Centro Universitário
Eurípides de Marília). In the course of his PhD, he has been a visiting researcher at the United Nations
Research Institute for Social Development (Switzerland), the University of São Paulo (Brazil), and the
University of Pretoria (South Africa).

References
Ajzenman, Nicolas, Tiago Cavalcanti, and Daniel Da Mata
2020 “More than words: Leaders’ speech and risky behavior during a pandemic.” Available at SSRN
 3582908. http://dx.doi.org/10.2139/ssrn.3582908

Allcott, Hunt, Levi Boxell, Jacob Conway, Billy Ferguson, Matthew Gentzkow, and Benny Goldman
2020 “Economic and health impacts of social distancing policies during the coronavirus pandemic.”
 Available at SSRN 3610422.

Briscese, Guglielmo, Nicola Lacetera, Mario Macis, and Mirco Tonin
2020 “Compliance with COVID-19 social-distancing measures in Italy: the role of expectations and
 duration.” Working Paper 26916, National Bureau of Economic Research.
 https://www.nber.org/papers/w26916.

Brzezinski, Adam, Valentin Kecht, David Van Dijcke, and Austin L. Wright
2020 “Belief in science influences physical distancing in response to COVID-19 lockdown policies.”
 University of Chicago, Becker Friedman Institute for Economics Working Paper, 2020-56.

Calvo, Ernesto, and Tiago Ventura
2020 “Will I get COVID-19? Partisanship, Social Media Frames, and Perceptions of Health Risk
 in Brazil.” Latin America Politics and Society, forthcoming.
 https://tiagoventura.rbind.io/publication/will_i_get_covid/.
 https://doi.org/10.1017/lap.2020.30.

Chan, Ho Fai, Ahmed Skali, David Savage, David Stadelmann, and Benno Torgler
2020 “Risk Attitudes and Human Mobility during the COVID-19 Pandemic.” arXiv preprint
 arXiv:2006.06078.

Chiou, Lesley, and Catherine Tucker
2020 “Social distancing, internet access and inequality.” (No. w26982). National Bureau of
 Economic Research.

 26
 MARLAS 4(3), 2021, DOI: 10.23870/marlas.327
Leone – The Harmful Effects of Denial

Cornelson, Kirsten, and Boriana Miloucheva
2020 “Political polarization, social fragmentation, and cooperation during a pandemic”. (No. tecipa-
 663). Working Paper 663, Department of Economics, University of Toronto.
 https://www.economics.utoronto.ca/public/workingPapers/tecipa-663.pdf.

Coven, Joshua, and Arpit Gupta
2020 “Disparities in mobility responses to COVID-19.” NYU Stern Working Paper. (May 15).
 https://arpitgupta.info/papers2.

Cucinotta, Domenico, and Maurizio Vanelli
2020 “WHO declares COVID-19 a pandemic.” Acta bio-medica: Atenei Parmensis, 91(1):157–160.
 https://www.mattioli1885journals.com/index.php/actabiomedica/article/view/9397.

Delen, Dursun, Enes Eryarsoy, and Behrooz Davazdahemami
2020 “No Place Like Home: Cross-National Data Analysis of the Efficacy of Social Distancing
 During the COVID-19 Pandemic.” JMIR Public Health and Surveillance 6 (2), e19862.

Farboodi, Maryam, Gregor Jarosch, and Robert Shimer
2020 “Internal and external effects of social distancing in a pandemic.” (No. w27059). National
 Bureau of Economic Research.

Ferguson, Neil, Daniel Laydon, Gemma Nedjati-Gilani, Natsuko Imai, Kylie Ainslie, Marc Baguelin,
 Sangeeta Bhatia, Adhiratha Boonyasiri, Zulma Cucunubá, Gina Cuomo-Dannenburg, Amy
 Dighe, Ilaria Dorigatti, Han Fu, Katy Gaythorpe, Will Green, Arran Hamlet, Wes Hinsley,
 Lucy C Okell, Sabine van Elsland, Hayley Thompson, Robert Verity, Erik Volz, Haowei
 Wang, Yuanrong Wang, Patrick GT Walker, Caroline Walters, Peter Winskill, Charles
 Whittaker, Christl A. Donnelly, Steven Riley, Azra C Ghani
2020 “Report 9: Impact of non-pharmaceutical interventions (npis) to reduce COVID19 mortality
 and healthcare demand.” Imperial College COVID-19 Response Team.

Fernandes, Ivan Filipe, Gustavo Andrey Fernandes, Guilherme Antônio Fernandes, and Pedro Ivo
 Salvador
2020 “Ideology, Isolation, and Death. An Analysis of the Effects of Bolsonarism in the COVID-19
 Pandemic.” (July 17, 2020). https://papers.ssrn.com/sol3/papers.cfm?abstract_id=3654538.

Gadarian, Shana Kushner, Sara Wallace Goodman, and Thomas B. Pepinsky
2020 “Partisanship, health behavior, and policy attitudes in the early stages of the COVID-19
 pandemic.” SSRN (preprint), posted March 27.

Ghader, Sepehr, Jun Zhao, Minha Lee, Weiyi Zhou, Guangchen Zhao, and Lei Zhang
2020 “Observed mobility behavior data reveal social distancing inertia.” arXiv preprint
 arXiv:2004.14748.

Grossman, Guy, Soojong Kim, Jonah M. Rexer, and Harsha Thirumurthy
2020 “Political partisanship influences behavioral responses to governors’ recommendations for
 COVID-19 prevention in the United States.” Available at SSRN 3578695.

 27
 MARLAS 4(3), 2021, DOI: 10.23870/marlas.327
Middle Atlantic Review of Latin American Studies

Hadjidemetriou, Georgios M., Manu Sasidharan, Georgia Kouyialisb, and Ajith K. Parlikad
2020 “The impact of government measures and human mobility trend on COVID-19 related deaths
 in the UK.” Transportation Research Interdisciplinary Perspectives 6, 100167.

Ioannidis, John P. A.
2020 “Coronavirus disease 2019: the harms of exaggerated information and non-evidence based
 measures.” European Journal of Clinical Investigation,50 (4): e13222.

Karim, Ridwan, and Jeff Chan
2020 “Mayoral Party Identity and Social Distancing Behaviors in Brazil.” Available at SSRN
 3642710.

Kissler, Stephen, Christine Tedijanto, Marc Lipsitch, and Yonatan H. Grad
2020 “Social distancing strategies for curbing the COVID-19 epidemic.” medRxiv.

Koo, Joel R., Alex R Cook, Minah Park, Yinxiaohe Sun, Haoyang Sun, Jue Tao Lim, Clarence Tam,
 and Borame L. Dickens
2020 “Interventions to mitigate early spread of SARS-CoV-2 in Singapore: a modelling study.” The
 Lancet Infectious Diseases 20 (6, June): 678–688.

Mariani, Lucas, Jessica Gagete-Miranda, and Paula Retti
2020 “Words can hurt: How political communication can change the pace of an epidemic.”
 https://doi.org/10.13140/RG.2.2.33366.88649

New York Times
2020 “Bolsonaro, isolated and defiant, dismisses coronavirus threat to Brazil.”
 https://www.nytimes.com/2020/04/01/world/americas/brazil-bolsonaro-
 coronavirus.html.

Painter, Marcus, and Tian Qiu
2020 “Political beliefs affect compliance with covid-19 social distancing orders.” Available at SSRN
 3569098.

Peixoto, Pedro S., Diego Marcondes, Cláudia Peixoto, Lucas Queiroz, Rafael Gouveia, Afonso
 Delgado, and Sérgio M. Oliva
2020 “Potential dissemination of epidemics based on Brazilian mobile geolocation data. Part I:
 Population dynamics and future spreading of infection in the states of Sao Paulo and Rio de
 Janeiro during the pandemic of COVID-19.” medRxiv.

Ricard, Julie, and Juliano Medeiros
2020 “Using misinformation as a political weapon: COVID-19 and Bolsonaro in Brazil.” The
 Harvard Kennedy School (HKS) Misinformation Review 1 (2). https://doi.org/10.37016/mr-2020-
 013.

Sansurooah, Krishnun, and Bradley Keane
2015 “The spy in your pocket: Smartphones and geo-location data.” Paper presented at Australian
 Digital Forensics Conference. Edith Cowan University.

 28
 MARLAS 4(3), 2021, DOI: 10.23870/marlas.327
Leone – The Harmful Effects of Denial

São Paulo
2020 “Sistema de monitoramento inteligente medirá a adesão à quarentena na capital.”
 http://www.capital.sp.gov.br/noticia/sistema-de-monitoramento-inteligente-medira-adesao-
 da-quarentena-na-capital.

Singh, Rajesh, and Ronojoy Adhikari
2020 “Age-structured impact of social distancing on the COVID-19 epidemic in India.” arXiv
 preprint arXiv:2003.12055.

The Conversation
2020 “Brazil: Jair Bolsonaro's strategy of chaos hinders coronavirus response.”
 https://theconversation.com/brazil-jair-bolsonaros-strategy-of-chaos-hinders-coronavirus-
 response-136590.

Villas-Boas, Sofia B., James Sears, and Miguel Villas-Boas
2020 “Are we #stayinghome to Flatten the Curve?” medRxiv.
 https://doi.org/10.1101/2020.05.23.20111211

Weiser, Mark
1999 “The computer for the 21st century.” ACM SIGMOBILE mobile computing and communications
 review 3 (3): 3–11.

Appendix: Tables

Table A1: Timeline of COVID-19 and policy responses

02/26/2020 First case is diagnosed. Patient lives in São Paulo and was in Italy.
02/28/2020 Federal government launches prevention campaign against COVID-19.
02/29/2020 Second case is diagnosed. Patient lives in São Paulo and was in Italy.
03/04/2020 Third case is diagnosed. Patient lives in São Paulo and was in Italy.
03/05/2020 First domestic transmission of COVID-19.
03/10/2020 Bolsonaro plays down the coronavirus outbreak and dismisses the disease as “fantasy.”
03/11/2020 World Health Organization declares COVID-19 a global pandemic.
03/13/2020 Ministry of Health recommends that agglomeration of people must be avoided and
 regulates the legal framework for COVID-19 isolation.
03/13/2020 State of São Paulo suspends events with more than 500 people.
03/13/2020 Rio de Janeiro is the first state to declare a state of emergency. Public events are
 suspended, while bars, restaurants and shopping centers remain open but with
 restrictions.
03/15/2020 Bolsonaro ignores coronavirus warnings from the health ministry and attends a street
 protest in defense of his own government.
03/16/2020 Bolsonaro urges the population to ignore the COVID-19 “hysteria” and get back to
 work.
03/17/2020 First COVID-19 death.
03/20/2020 Federal government declares a state of emergency.

 29
 MARLAS 4(3), 2021, DOI: 10.23870/marlas.327
Middle Atlantic Review of Latin American Studies

03/21/2020 Federal government determines the essential services that cannot be closed during the
 COVID-19 pandemic.
03/23/2020 Schools close in all Brazilian states.
03/23/2020 Federal government determines entry restrictions for foreign citizens.
03/24/2020 Lockdown in São Paulo. Only essential services can stay open.
03/24/2020 Bolsonaro plays down the coronavirus as “a little flu” and urges mayors and state
 governors to roll back lockdown measures.
03/28/2020 Ministry of Health calls on people to maintain the “the maximum degree of social
 isolation.”
03/29/2020 Bolsonaro undermines social distancing guidelines and mingles with political
 supporters on the streets of Brasília.
04/01/2020 Cases of COVID-19 are diagnosed in all 27 Brazilian states.
04/02/2020 Federal government recommends the use of a face mask.
04/10/2020 First death of an indigenous person due to COVID-19.
04/21/2020 Deaths due to COVID-19 are registered in all 27 Brazilian states.
04/30/2020 Brazil surpasses China in number of COVID-19 cases.
05/23/2020 Brazil surges to second place in COVID-19 cases worldwide.

Notes: Declaration of a state of emergency allows the government to free up budgetary resources for
 the coronavirus crisis. Lockdown is the technical term for restrictive measures that aim to
 reduce the movement of people and refers to executive decrees to close nonessential services
 and recommendations that individuals stay at home. Quarantine refers to more rigid rules to
 limit circulation and, among other things, entails a prohibition on leaving one’s residence or
 accessing certain areas.

Source: Government official gazette and media reports; author’s own elaboration.

Table A2: Descriptive Statistics

 Mean SD Min Max N n Tbar
Social Distancing Index 37.799 9.055 7.407 85.455 423,877 4,618 91.788
Voting for Bolsonaro 38.683 19.685 2.531 83.893 424,829 5,570 76.271
COVID-19 Cases 7.066 200.974 0 31,873 423,877 4,618 91.788
COVID-19 Deaths 0.475 16.493 0 2,596 423,877 4,618 91.788
GDP per capita 22,150 21,942 3,285 344,847 424,829 5,570 76.271
Population 49,764 257,812 1,833 12,252,023 424,829 5,570 76.271
Lockdown Measures 0.561 0.496 0 1 424,829 5,570 76.271
COVID-19 in Brazil 0.766 0.424 0 1 424,829 5,570 76.271
COVID-19 in Municipality 0.161 0.368 0 1 424,829 5,570 76.271

Notes: This table provides descriptive statistics for the panel data structure in which each of the 5,570
 Brazilian municipalities was accompanied during the 103 days (February 1, 2020 – May 14,
 2020). Data are not nested within municipalities.

Source: In Loco, TSE, IBGE and Ministry of Health databases; author’s own elaboration.

 30
 MARLAS 4(3), 2021, DOI: 10.23870/marlas.327
You can also read