The House That Wasn't Built - Housing Scarcity: The Inland Empire's 'Natural' Barrier To Economic Growth
←
→
Page content transcription
If your browser does not render page correctly, please read the page content below

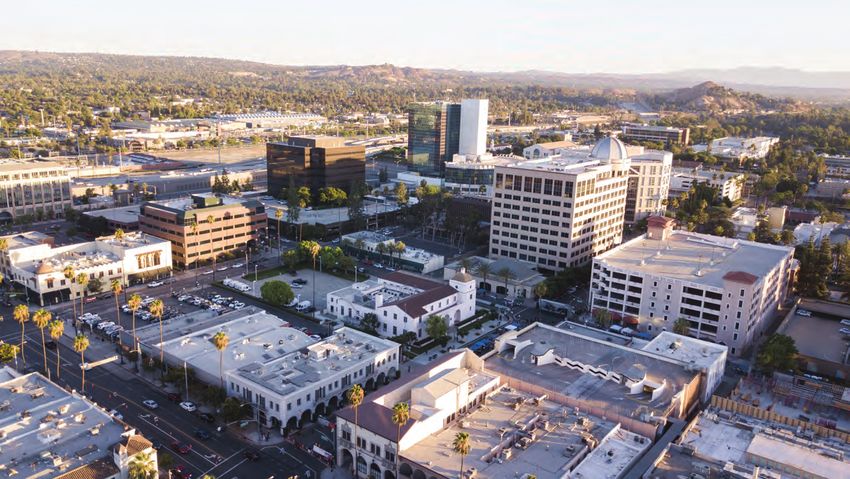
The House
That Wasn’t Built
Housing Scarcity:
The Inland Empire’s ‘Natural’ Barrier To Economic Growth

Life Powered By                 Innovation
   Premium Renewable
     Energy Systems                        Choose Technology You
                                             Can Depend On

                 SMX Solar Panels             U P TO
                                                       25
                                                       year
                                                                              25
                                                                              year
                           WARRANTY                     WARRANTY

                                      INVERTERS                 SOLAR PANELS

                                                                25
                   LED Lighting                                 year
                                                                  limited
                                                              WARRANTY

                   and Signage                                WORKMANSHIP


                                           Get a FREE, no-obligation
                 LG Home Battery               solar consultation

                               Call (951) 268-2614
                                      or visit
                                           www.SolarMaxTech.com

  Go with California’s Renewable Energy Leader
 SolarMax Technology offers premium quality solar energy systems,
that are designed, engineered and assembled right here in the USA.
Riverside County
      Moving Business Forward

  The Riverside County Economic Development
 Agency is ready to help companies participate in
 the remarkable opportunities available through
          many services and programs.

• Property Selection           • Workforce Development
    www.RivCoProspector.com
                               • Office of Foreign Trade
• Small Business Development
  Assistance                   • Incentive Zones

• Financing

                  RIVCOBIZ.ORG
The Top Ranked MBA in the Inland Empire
     UCR School of Business | TOP 100 Business School | UU.S.
                                                           S News & World Report

  Ranked top 100 “Best Business Schools” – U.S. News & World Report 2019
                               FULL-TIME MBA
                             PROFESSIONAL MBA
                    MASTER OF PROFESSIONAL ACCOUNTANCY
                             MASTER OF FINANCE
                               PHD PROGRAM
GENEROUS SCHOLARSHIPS ARE CONSIDERED FOR ALL ADMITTED APPLICANTS APPLYING
   BY DEADLINE. ACADEMIC AND MERIT-BASED SCHOLARSHIPS ARE ALSO AWARDED

         90%
        MBA’S EMPLOYED
                             Our students intern and work at Disney, PWC, Coach, Intel,
                             Kia Motors, Technicolor, KPMG, Monster Energy, Deloitte,
                             Target, Bank of America, and more.
        WITHIN 3 MONTHS

                                                                        School of
                                                                        Business
                A . G A RY A N D E R S O N G R A D U AT E S C H O O L O F M A N A G E M E NT

                AGSM.UCR.edu | (951) 827-6200 | ucr_agsm@ucr.edu
MBA INTERNSHIP PROGRAM
             GROW YOUR BUSINESS!
         Each year MBA students take internship opportunities
           to gain real world experience, develop leadership
             skills, and create value for host organizations.

                                   MBA
                            Master of Finance
                    Master of Professional Accountancy

                To learn more about the Internship Program
               contact the AGSM Career Development Center
                              (951) 827-3479

business.ucr.edu/cdc/employers       |   agsmcareercenter@ucr.edu
Enriching Lives &
 Empowering Dreams
 The Garcia Family
 Members Since 2003

 At Altura you are not a customer,
 you’re a Member.
 Altura Credit Union has been a part of the Inland Empire since 1957. As a not-for-profit financial institution, we are proud to serve the
 underserved and partner with our community to educate and enrich those around us.

 We have 14 locations in the Inland Empire and through CO-OP Financial Services our Members enjoy access to over 30,000 surcharge free
 ATMs and more than 5,600 shared branches across the nation.

AlturaCU.com                        l    888-883-7228                                                             Federally Insured by NCUA

You’re an inspiration to us all
UCR’s School of Business is making a difference in our neighborhood.

Helping the local economy thrive is just one of the many positive attributes you bring to our area. Extending
your abilities and resources to the community through service and other initiatives makes you a true leader.

We’re proud to work with UCR’s School of Business.

Visit us at bankofamerica.com/local.

©2019 Bank of America Corporation | AR64WX5V | ENT-225-AD

INNOVATIVE
    COUNSEL,
     WINNING
   STRATEGIES.
                                               Life is motion.
 ECG is proud to sponsor the
                                   In this rapidly changing world, we advise businesses and
 10 th Annual Inland Empire            individuals on how to prepare for the unexpected.

Economic Forecast Conference       When you partner with us, you’ll be at the center of a vast
                                    network of specialists who will use their expertise in risk
                                 services, claims management and compliance support to help
                                                     you reach your goals.

                                      un
                                  Our unrelenting  advocacy and tailored solutions put you in
                                   control, and give you the peace of mind that comes from
                                     knowing that the things that matter most to you are
                                                           protected.

                                                   hubinternational.com

   ecg.law | 949-833-8550            Advocacy | Tailored Insurance Solutions | Peace of Mind

                                                     www.moval.org

                               Amazon                                      Deckers Outdoor

                               Procter & Gamble                                  SKECHERS USA

                               Karma Automotive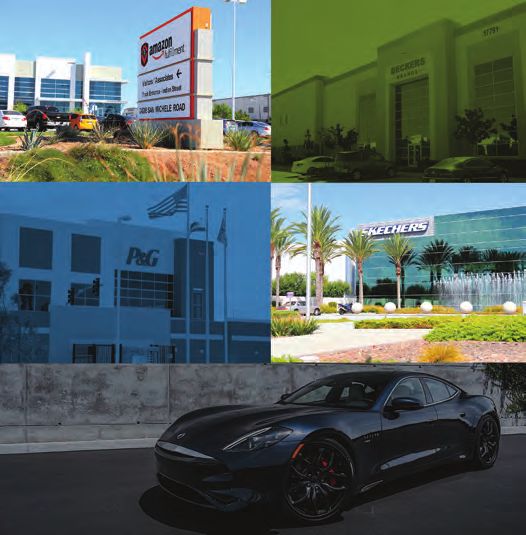
ONTARIO              THINKS              BUSINESS
 AS ONE OF THE LEADERS IN SOUTHERN
 CALIFORNIA, THE CITY OF ONTARIO CONTINUES
 TO ELEVATE INVESTMENT OPPORTUNITIES IN
 INFRASTRUCTURE TO BETTER SERVE THE NEEDS
 OF OUR BUSINESS COMMUNITY.

 WITH THREE MAJOR FREEWAYS, TWO RAILROADS
 AND THE ONTARIO INTERNATIONAL AIRPORT,
 ONTARIO IS THE PERFECT LOCATION FOR YOUR
 BUSINESS TO THRIVE.

       ONTARIOTHINKSBUSINESS.COM

          Mayor Paul S. Leon • Mayor pro Tem Ruben Valencia
Council Members Alan D. Wapner, Jim W. Bowman, and Debra Dorst-Porada
KEEP YOUR EYES
  ON THE ’PRISE
  FROM THE MARCH FIELD AIRFEST to hot air balloons in Temecula,
  there’s a lot to see in the skies above Riverside County. And there’s
  one great way to keep track of it all: The Press-Enterprise. With our
  steadfast commitment to local coverage, we’re your source for the in-
  formation and news that matters to you — in print, online, or on the go.

              Inland Southern California’s News Source
                              pe.com/subscribe

KUDOS TO
ANOTHER JOB
WELL DONE.
The Brandsmith would like to thank the Center for Economic
Forecasting & Development and the UCR School of Business
for another successful conference and providing us with the
opportunity to serve as your creative partner.

                                                                             BRANDING MARKETING DESIGN

                                                                                www.TheBrandsmith.agency
2019 Inland Empire Economic Forecast Conference
Agenda The House That Wasn’t Built
November 6, 2019 Housing Scarcity: The Inland Empire’s
Natural Barrier to Economic Growth
7:30 a.m. Registration Opens 10:30 a.m. Dr. Robert Kleinhenz,
Director of Economic Research
Center for Economic Forecasting and
8:30 a.m. Edward Ornelas, Publisher (Event Development
Emcee) School of Business, UC Riverside
Inland Empire Business Journal Inland Empire Regional Forecast
Welcome
National Anthem
11:10 a.m. Audience Q & A
Performed by Gisele Njoh Njoh
University of California, Riverside
Class of 2021
11:25 a.m. Adjourn and Closing Remarks
Beverly Bailey, Chief Executive Officer
Stronghold Engineering
Opening Remarks
Dr. Yunzeng Wang, Dean
School of Business, UC Riverside
Opening Remarks
8:45 a.m. Dr. Christopher Thornberg, Director
Center for Economic Forecasting and
Development
School of Business, UC Riverside
U.S. & California Forecast
9:30 a.m. The Case of the Missing Homes:
A Conversation Moderated by
Christopher Thornberg
Dr. Paavo Monkkonen, Associate
Professor of Urban Planning and
Public Policy
University of California, Los Angeles
Steve PonTell, Chief Executive Officer
and President
National CORE2019 Inland Empire Economic Forecast Conference
Speakers & Panelists
Edward Ornelas, Jr.,Publisher (Event Emcee)
Inland Empire Business Journal
Edward Ornelas, Jr. is a Los Angeles native, however he likes to tell people that the Inland
Empire ‘adopted him’ in 2012. He is the President and CEO of the Inland Empire Regional
Chamber of Commerce and Publisher of the Inland Empire Business Journal. Having worked
with many small businesses to enhance their brand, Edward has the experience, passion
and drive to succeed in any environment. A “think outside the box” attitude and unorthodox
approach has set him apart as a marketer and leader.
Formerly, as an outside sales representative for a large manufacturing company in the Los
Angeles market, Edward traveled to just about every state in the U.S. meeting with key clientele,
prospects, and attending trade shows.
Since moving from Los Angeles to Fontana in 2011, Edward has become deeply involved in the
local community and business community, regularly attending City Council meetings, County
meetings, and other key regional gatherings and events that allow him to stay connected to
what’s happening across the Inland Empire.
Edward has a gift for creating, envisioning, and executing marketing strategies for businesses
and nonprofit organizations. Working with clients across the private and public sector, he is
recognized as a person who ‘gets things done’ and his marketing services and expertise come
highly recommended.
Beverly Bailey, Chief Executive Officer
Stronghold Engineering, Inc.
Beverly Bailey is the president and CEO of Stronghold Engineering, Inc., a Riverside-based
general contracting firm with more than 200 employees in the design-build, electrical, general
and civil construction industry. She founded the company in 1991 with her husband, Scott A.
Bailey, out of their home. From 1995 to 2004, the firm grew to 185 employees, moved into a
25,000 square foot Riverside corporate headquarters and added branch offices in California,
Arizona, Hawaii and internationally. The company is now ranked one of the top 10 minority/
women-owned construction companies in the nation.
Ms. Bailey is also the CEO of Lamb Energy, a solar power construction company she founded
in 2009. In 2015, she became a Governance Fellow with The National Association of Corporate
Directors (NACD). This is the highest level of credentialing for corporate directors and corporate
governance professionals.
Ms. Bailey has served on the UCR Foundation Board of Trustees since July 2019. She served
as an Executive Fellow for UCR’s School of Business during the 2017-2018 academic year. Her
current committee memberships include serving as Chair of the School of Business Dean’s
Advisory Council and serving on the UCRF Board of Trustees.
Ms. Bailey is a managing member of Bailey California Properties, LLC, which purchased The
Farm House Motel off University Avenue in Riverside in August 2018. The motel is slated for
renovation as an indoor/outdoor center for retail shops, restaurants and entertainment.2019 Inland Empire Economic Forecast Conference
Yunzeng Wang, Dean
School of Business, UC Riverside
Yunzeng Wang was appointed permanent Dean of the UC Riverside School of Business in
January 2014, after serving as Interim Dean since October 2011. He joined the faculty in July
2008 as the Deans’ Distinguished Scholar in Supply Chain Management and Professor of Finance
and Management Science, and has served as Associate Dean of Academic Programs. Previously,
Dean Wang served as faculty at Weatherhead School of Management at Case Western Reserve
University and the School of Management at the University of Texas at Dallas. Dean Wang has a
PhD in operations management from the Wharton School at the University of Pennsylvania and
a master’s degree in management sciences from the University of Waterloo, Canada.
Christopher Thornberg, Director
Center for Economic Forecasting and Development
School of Business, UC Riverside
Christopher Thornberg is widely considered to be one of the nation’s leading economists.
An expert in economic forecasting, regional economics, labor markets, economic policy, and
real estate analysis, he was one of the earliest and most adamant predictors of the subprime
mortgage market crash that began in 2007, and of the global economic recession that followed.
In 2015, he was named to California State Treasurer John Chiang’s Council of Economic
Advisors. He also serves on the advisory board of Wall Street hedge fund, Paulson & Co. Inc. Dr.
Thornberg holds a PhD in Business Economics from the Anderson School at UCLA.
Dr. Paavo Monkkonen, , Associate Professor of
Urban Planning and Public Policy
University of California, Los Angeles
Paavo Monkkonen is Associate Professor of Urban Planning and Public Policy at the UCLA Luskin
School of Public Affairs, where he is also the Director of the Latin American Cities Initiative
(ciudades.luskin.ucla.edu). Professor Monkkonen researches, writes and teaches about the ways
housing policies and markets shape urban development and social segregation in cities around
the world. His scholarship ranges in scale from national housing finance programs to local land
use regulations, and includes comparative work on countries in the Americas (Argentina, Brazil,
Mexico, and the United States) and Asia (China, Hong Kong, India, Indonesia).
He continues to work as a consultant on national housing and urban policy in Mexico, where
he has longstanding research projects, and is active in local housing politics in California. He
is on the Southern California Association of Governments (SCAG) Regional Housing Needs
Assessment (RHNA) subcommittee. Professor Monkkonen completed a Master of Public Policy
at the School of Public Affairs at the University of California, Los Angeles in 2005, and a PhD in
City and Regional Planning at the University of California, Berkeley in 2009. He was Assistant
Professor of Urban Planning at the University of Hong Kong from 2009 to 2012.2019 Inland Empire Economic Forecast Conference Steve PonTell, CEO National CORE Steve PonTell is the Chief Executive Officer and President of National CORE. He has become a passionate advocate for the residents and communities we serve and today is one of the leading voices and public speakers on the topic of housing affordability and community transformation. Mr. PonTell has led several regional and national symposiums on our nation’s housing crisis. In addition, he has addressed the California Assembly on the challenges facing the affordable housing industry. During his career, Mr. PonTell has pursued a variety of entrepreneurial ventures and has held several public-private leadership positions. Active in his community and industry, he serves on several boards of directors, including the California Endowment, National Housing Conference, BizFed Institute and Southern California Leadership Council. He also is an active member of the Urban Land Institute and the American Planning Association. Mr. PonTell graduated from the California Polytechnic State University — San Luis Obispo with a Bachelor of Science in City and Regional Planning and the Claremont Graduate University’s Drucker School of Business with an Executive Master of Business Administration. Dr. Robert Kleinhenz, Director of Economic Research Center for Economic Forecasting and Development School of Business, UC Riverside Robert Kleinhenz is one of California’s leading economists, with nearly 30 years of experience analyzing the U.S. and California economies and the economies of California’s many diverse regions. He is a much sought-after specialist for his deep knowledge of industries across the state and in the counties of Southern California. Dr. Kleinhenz formerly served as Chief Economist of the Kyser Center for Economic Research at the Los Angeles County Economic Development Corporation and as Deputy Chief Economist at the California Association of Realtors. Dr. Kleinhenz holds a PhD from the University of Southern California.
Table of Contents

 1   United States Forecast

 9   California Forecast

15   Inland Empire Forecast

23   Inland Empire Employment

31   Inland Empire Business Activity

37   Inland Empire Residential Real Estate

49   Inland Empire Commercial Real Estate

65   Inland Empire Demographics
United    Since the start of this year, the news has been

                  flooded with almost continuous calls that a

         States   recession is on the way. The rhetoric has shifted

                  from suggesting that the United States ‘might’

      Forecast    have a recession in the near future to a tone of

                  almost complete certainty about an oncoming

           The    downturn and what it will mean for the election,

                  for millennials, for whatever. The reasons for

     Recession    these predictions vary—from the length of the

                  current expansion, to the trade war with China,

    That Wasn’t   to the ironic suggestion that the sheer bulk of

                  conversation about a coming recession will, by

                  itself, create the next recession.

1
Beacon Economics continues economy continues to expand average growth in 2018 and
to ignore these constant cries at a safe and steady pace, 2.8% in 2017. It is difficult to
of wolf (or perhaps ‘bear’ with few of the stressors or see turbulence here despite all
would be more appropriate). imbalances that could cause a the rhetoric to the contrary.
Our views have not changed major disruption. The longest
since the last edition of this expansion in U.S. economic Consumer spending has been
outlook and, if anything, history will continue for the steady, adding slightly less
we are more bullish on the foreseeable future. that 2% to growth for the
economy today than we were last 5 years. While business
at the start of the year. To us, When the second quarter U.S. investment slowed somewhat
the numbers don’t suggest GDP release came out, there in 2019, on the upside, there
that the United States has was a modest revision of the has been more than enough
successfully weathered a last two years of output data. of a surge in public spending
series of economic storms, The new history is almost to offset slower spending
but rather beg the question boring in its consistency. GDP from business. Residential
as to whether there has been growth in 2019 has averaged investment is still a drag on
a storm to navigate. The 2.55%, compared to 2.5% the economy, although less
2United States Forecast
of one than next year. And while exports 2017 2018 2019 H1
have fallen a bit, the effect on the economy GDP 2.80 2.50 2.55
has been very small and has been offset Final Demand 3.02 2.65 2.74
by modestly declining imports. In other Consumption 2.00 1.79 1.94
Goods 1.06 0.62 1.05
words—yawn. Not much to talk about here.
Services 0.94 1.17 0.89
Investment 0.86 0.61 0.18
Moreover, it isn’t just the output data that
Structures 0.05 0.08 -0.09
looks positive. While U.S. job growth has
Equipment 0.49 0.30 0.02
slowed modestly this year to about 160,000
IPP 0.17 0.40 0.33
jobs per month, with the nation’s low Residential 0.16 -0.18 -0.08
unemployment rate and slow growth in the Net exports -0.16 -0.43 0.01
labor force, this is not surprising. The job Exports 0.66 0.05 -0.11
openings rate in the United States is still Imports -0.82 -0.49 0.11
significantly higher than the unemployment Government 0.15 0.27 0.64
rate. Additionally, tight labor markets over Federal 0.11 0.17 0.33
the last two years have caused wages to State and local 0.04 0.09 0.31
rise at a faster pace. CONTRIBUTIONS TO U.S. GDP GROWTH
QUARTERLY AVERAGES
Source: U.S. Bureau of Economic Analysis, Analysis By
All this seems to stand in stark contrast to UCR Center for Forecasting
the most talked-about stress point in the
economy today—the trade war with China. China through the first half of 2019 were down
The rhetoric surrounding the economic 13% from the same period in 2018. Exports
impact of the current tariffs has reached an responded even more dramatically—down 19%
almost hysterical level. The stock market from the previous year. But trade is fungible.
leaps or collapses on the basis of a tweet Overall, the nominal value of imports and
from the President on the subject. Yet we exports is largely the same as last year at this
are hard pressed to find a shred of data time. Real trade flows, including services, are
that suggests these shifting trade flows also largely unchanged from 2018. One might
have had any broad, overall impact on the understandably wonder ‘what trade war’?
U.S. economy—and even struggle to find
evidence for a narrow, limited impact.
There is little doubt that the tariffs being
slapped onto products coming from
China have affected trade flows with that
nation. In nominal terms, imports from
3United States Forecast
Exports June. 2019 YTD YOY % Growth Imports June. 2019 YTD YOY % Growth
Total $823.6 -1.0% Total $1,235.8 0.3%
Canada $148.1 -3.1% China $219.0 -12.4%
Mexico $129.3 -1.7% Mexico $179.6 6.3%
China $52.0 -18.9% Canada $158.1 -1.1%
Japan $36.8 2.6% Japan $72.9 3.9%
UK $34.1 0.2% Germany $62.3 -0.1%
Germany $30.4 3.2% Korea $39.2 10.7%
Korea $28.3 4.4% UK $31.0 5.7%
Netherland $26.1 10.2% Vietnam $30.4 33.4%
Brazil $20.8 9.3% Ireland $29.9 6.2%
France $19.4 5.5% France $29.7 15.5%
U.S. TRADE - EXPORT AND IMPORT GROWTH
(IN $BILLIONS)
Source: WISERTrade, Analysis By UCR Center for Forecasting
Additionally, inflation has not heated up as 2019 H1
a result of tariffs on imports—it has actually Furniture and bedding 2.40
slowed to a modest 1.5%. Even for products Appliances 0.10
that are imported directly, we see little Dishes and flatware 8.00
Tools, hardware 2.30
difference in price growth as a result of the
Apparel 1.00
tariffs. Inflation rates over the last year were
Tires 2.20
1% for apparel, 2.4% for furniture, 2.2% for
Video and audio products -9.80
tires, and AV equipment was actually down
Sporting goods 0.00
by a whopping 9.8%. Dishes and flatware
CPI INFLATION RATE
did rise by 8%, but it seems unlikely that the AUGUST 2018 TO AUGUST 2019
higher cost of new tableware will push the U.S. Source: U.S. Bureau of Labor Statistics, Analysis By
UCR Center for Forecasting
consumer to the breaking point. Much of this is
being driven by the fact that the Chinese have
allowed their currency to depreciate sharply,
to over 7 yuan per dollar, meaning they have
picked up most of the cost of the tariffs. In
short, the only true macroeconomic effect of
the trade war has been in the news/media
business.
4United States Forecast
15%
10%
5%
0%
-5%
-10%
-15%
-20%
Jan-08
Jun-08
Nov-08
Apr-09
Sep-09
Feb-10
Jul-10
Dec-10
May-11
Oct-11
Mar-12
Aug-12
Jan-13
Jun-13
Nov-13
Apr-14
Sep-14
Feb-15
Jul-15
Dec-15
May-16
Mar-17
Nov-18
Aug-17
Apr-19
Oct-16
Jun-18
Jan-18
INDUSTRIAL PRODUCTION: MANUFACTURING
(YEAR-OVER-YEAR)
Source: Board of Governors of the Federal Reserve System, Analysis by UCR Center for Forecasting
While it’s true that As for why manufacturing is And countering this modest
manufacturing output has flat, a portion is indeed being negative is plenty of good
flattened, it isn’t much of a driven by flattening exports, news. On the upside, falling
stressor on the economy. In but another, perhaps even interest rates are already
2016, industrial production more significant portion, starting to create new
went negative in the midst of stems from weak business momentum in residential real
the global commodity bust. investment. The slowdown estate. Home sales are picking
Yet this was barely seen in in business investment is up and new home sales are
overall growth at the national not too surprising given the back to a 12-year high (albeit
level. A huge share of the U.S. strong numbers over the last still much lower than in 2006).
economy today is in services, two years, much of which Home price growth is also
making it far more immune to was driven by the accelerated stabilizing. Additionally, expect
manufacturing cycles. depreciation giveaway in the a wave of refinancing on
Tax Cuts and Jobs Act of 2017. homes (interest rates are back
to 3.5%!) as consumers move
5United States Forecast
20%
15%
10%
5%
0%
-5%
-10%
-15%
-20%
-25%
Jan-04
Aug-04
Mar-05
Oct-05
May-06
Dec-06
Jul-07
Feb-08
Sep-09
Apr-09
Nov-10
Jun-11
Jan-11
Aug-12
Mar-12
Oct-13
May-13
Dec-13
Jul-14
Feb-15
Sep-15
Apr-16
Nov-16
Jun-17
Jan-18
Aug-18
Mar-19
U.S. HOME PRICE GROWTH
(YEAR-OVER-YEAR)
Source: S&P Dow Jones Indices LLC, S&P/Case-Shiller 20-City Composite Home Price Index, Analysis by UCR Center
for Forecasting
7,000
6,000
5,000
4,000
3,000
2,000
1,000
0
Jan-04
Aug-04
Mar-05
Oct-05
May-06
Dec-06
Jul-07
Feb-08
Sep-09
Apr-09
Nov-10
Jun-11
Jan-11
Aug-12
Mar-12
Oct-13
May-13
Dec-13
Jul-14
Feb-15
Sep-15
Apr-16
Nov-16
Jun-17
Jan-18
Aug-18
Mar-19
U.S. SINGLE-FAMILY HOMES SOLD
(IN THOUSANDS)
Source: Board of Governors of the Federal Reserve System, Analysis by UCR Center for Forecasting
6United States Forecast
12%
10%
8%
6%
4%
2%
0
Jan-04
Aug-04
Mar-05
Oct-05
May-06
Dec-06
Jul-07
Feb-08
Sep-09
Apr-09
Nov-10
Jun-11
Jan-11
Aug-12
Mar-12
Oct-13
May-13
Dec-13
Jul-14
Feb-15
Sep-15
Apr-16
Nov-16
Jun-17
Jan-18
Aug-18
Mar-19
PERSONAL SAVINGS AS A PERCENTAGE OF DISPOSABLE PERSONAL INCOME
Source: U.S. Bureau of Economic Analysis, Analysis by UCR Center for Forecasting
to save even more on their upward revision in consumer low level. The U.S. consumer
interest payments. Beacon savings rates. The rate is sector hasn’t been this healthy
Economics expects real estate currently at 8%, the highest in two decades, and a healthy
to become a positive force for since the early 1990s (outside consumer sector can push
growth in the second half of of an odd surge prior to taxes the nation through any major
the year and even more so in going up in 2012). Americans issues in the global economy.
2020. are actually tucking money
away. Combined with low One of the big questions is
Speaking of consumers, there interest rates and a slow pace how we square our benign
were a number of pleasant of household debt growth, view of the economy with the
surprises in the revised the financial obligations ratio inverted yield curve, which
GDP data, including another continues along at a record historically is one of the best
7United States Forecast
predictors of an oncoming cool an overheating economy. Economics’ expects GDP
recession. The answer is to In other words, the inverted growth to continue at a steady
understand that correlation yield curve is like the skid 2.5% pace for the foreseeable
is not causation—short run marks at the top of a cliff. It future. Unemployment will
interest rates being higher is a sign of trying to avoid an remain low and wages will
than long run interest rates accident. continue to rise. Also, expect
has never, by itself, created a housing prices to accelerate.
recession. Rather, the strong The good news is that the As for when exactly the next
correlation in this data is United States is not currently recession might arrive
driven traditionally by the facing a cliff. The U.S. economy — we simply don’t know.
Federal Reserve raising short is stable and the expansion
run interest rates to try and will continue. Beacon
8California Forecast
Fact Versus Fiction
By Robert Kleinhenz, Executive Director of Research
While still savoring the fact that the U.S. economy is the midst of a record-breaking expansion,
attention has suddenly shifted to questions about when the next recession will begin. Admittedly, there
are a number of mounting concerns: U.S. trade conflicts, weaker global economic conditions, Brexit,
and the inverted yield curve. Still, despite the uncertainty that has fueled these concerns, and despite
chronic homegrown problems with respect to the labor force and housing, California’s economy has
performed solidly through the first half of the year, and will stay on track into 2020.
Just the Facts, Ma’am
Looking beyond the rhetoric and headline- expansion. And with a tight labor market and
catching hyperbole, data clearly show a steady job growth, wages continue to climb.
California economy that is humming along. The
state’s unemployment rate, having hit a record California added 311,800 jobs year-over-year as
low of 4.1% in July 2018, has been skating along of July, and has accounted for 16% of job gains
at that rate, or slightly above, in the months nationally through the first seven months of
since. Jobs grew statewide at a year-over-year 2019, essentially unchanged from the previous
rate of 1.8% in July 2019, comfortably above five years. Health Care, Professional Scientific
the long run growth rate (since 1991) of 1.2% and Technical Services, Leisure and Hospitality,
and a just a hair behind last year’s 1.9% rate of and Construction led the way in absolute terms,
9Industry July '19 YTY Change YTY % Change
Total Nonfarm 17,488,600 311,800 1.8%
accounting for roughly two- Health Care & Social Assistance 2,433,600 74,400 3.2%
thirds of the state’s total job Professional, Scientific & Technical 1,327,400 46,500 3.6%
Services
gains.
Leisure & Hospitality 2,025,700 40,900 2.1%
Construction 900,700 37,100 4.3%
Each of these industries is
Government 2,612,400 35,100 1.4%
driven by its own dynamic.
Administrative & Support & Waste 1,159,600 30,400 2.7%
Health Care has been on Services
a sustained growth path Transportation, Warehousing & Utilities 681,800 16,200 2.4%
for several years, while the Information 555,300 15,100 2.8%
advances in Professional Manufacturing 1,337,900 12,800 1.0%
Educational Services 382,700 8,400 2.2%
Scientific and Technical
Real Estate & Rental & Leasing 296,700 3,700 1.3%
Services show the strength
Other Services 576,500 2,000 0.3%
of the state’s tech sector.
Management of Companies & Enterprises 255,700 1,700 0.7%
Meanwhile, gains in Leisure
Mining 22,700 -200 -0.9%
and Hospitality employment Finance & Insurance 542,600 -600 -0.1%
are a reflection of spending Wholesale Trade 698,300 -700 -0.1%
from household and business Retail Trade 1,679,000 -11,000 -0.7%
discretionary income.
JOB GAINS ACROSS NEARLY ALL INDUSTRIES
Source: California Employment Development Department, Analysis by UCR
Construction, Professional Center for Forecasting
Scientific and Technical
10California Forecast
YTY YTY %
Services, and Health MSA July '19
Change Change
Care were also leaders in Los Angeles-Long Beach-Glendale Metro Div 4,568,600 59,400 1.3%
percentage terms, followed San Francisco-Redwood City-South San Francisco 1,186,500 41,100 3.6%
Metro Div
by Information. On the other
Riverside-San Bernardino-Ontario MSA 1,545,400 35,700 2.4%
hand, five of the state’s 17
San Jose-Sunnyvale-Santa Clara MSA 1,161,100 33,500 3.0%
major industries contracted,
San Diego-Carlsbad MSA 1,514,000 27,600 1.9%
losing a total of 13,600 jobs
Anaheim-Santa Ana-Irvine Metro Div 1,677,600 25,800 1.6%
from July 2018 to July 2019 Oakland-Hayward-Berkeley Metro Div 1,200,700 20,700 1.8%
(less than 0.1% of the state’s Sacramento--Roseville--Arden-Arcade MSA 1,020,900 19,700 2.0%
total payroll employment). Fresno MSA 363,700 12,100 3.4%
Bakersfield MSA 273,200 6,800 2.6%
Evidence of growth can also Santa Maria-Santa Barbara MSA 189,700 6,100 3.3%
be seen early in the year, Salinas MSA 148,100 5,300 3.7%
in real gross state product, San Rafael MD 119,900 3,400 2.9%
which was up 2.7% year-to- Visalia-Porterville MSA 128,400 3,200 2.6%
Santa Rosa MSA 212,000 3,100 1.5%
year in the first quarter, and
Modesto MSA 180,000 2,700 1.5%
in nominal personal income,
San Luis Obispo-Paso Robles-Arroyo Grande MSA 120,100 2,500 2.1%
which advanced by 3.1% over
Santa Cruz-Watsonville MSA 104,600 2,200 2.1%
the same period, slightly off
Merced MSA 70,100 1,600 2.3%
the national pace in both
Napa MSA 75,700 1,400 1.9%
cases. When viewed alongside Oxnard-Thousand Oaks-Ventura MSA 310,800 1,100 0.4%
the 8.1% increase in statewide Chico MSA 84,500 1,100 1.3%
taxable sales over this same Hanford-Corcoran MSA 41,300 1,000 2.5%
period, it appears that both Yuba City MSA 45,400 1,000 2.3%
household and business Redding MSA 68,000 1,000 1.5%
spending have the wherewithal Madera MSA 38,700 500 1.3%
to fuel continued spending. El Centro MSA 52,000 300 0.6%
Vallejo-Fairfield MSA 141,900 -200 -0.1%
Stockton-Lodi MSA 240,800 -200 -0.1%
Regionally, Los Angeles County
led the state in job growth in CALIFORNIA REGIONAL GROWTH CONTINUES
Source: California Employment Development Department, Analysis by UCR
July 2019 with an increase of Center for Forecasting
59,400 positions, followed by
San Francisco MD (41,100),
the Inland Empire (35,700),
and San Jose (33,500). All but
two metro areas in the state
11California Forecast
$500,000
$450,000
$400,000
$350,000
$300,000
$250,000
$200,000
$150,000
$100,000
$50,000
$0
Q1-10 Q1-11 Q1-12 Q1-13 Q1-14 Q1-15 Q1-16 Q1-17 Q1-18 Q1-19
Quarterly Sales Annualized Quarterly Home Price
SLOWER PRICE GAINS, SALES TURNING AROUND
Source: Corelogic/DQ News, Analysis by UCR Center for Forecasting
added jobs in yearly terms in July. While every Median home prices are a mixed bag, up
region in California is on track to experience job across most of the state but flat or decreasing
growth for the year as a whole, performance in others. Home sales declined steadily last
varies across the state depending on underlying year in response to rising mortgage rates.
fundamentals and the leading industries in each However, with rates turning down since late
region: steady tech growth in the Bay Area; the 2018, sales improved modestly in the first half
energy sector in Bakersfield; tourism, retail, and of 2019, and sales in the second half of the year
professional services in Orange County; and should improve over the first. Meanwhile, rents
logistics in the Inland Empire. have continued to rise over the year against a
backdrop of stable or declining vacancy rates,
To be sure, California is not without problems. and statewide residential construction has
Retail Trade lost 11,000 jobs year-over-year declined compared to last year’s levels, making
in July, wage and job gains are stronger in an already chronic housing shortfall even worse.
some parts of the state than in others, and the
housing market is struggling in many regions.
12California Forecast
California Continues Growing Despite Trade Wars
Beginning with the U.S. Partly because of sustained Shifting to the first half of
withdrawal from the Trans- strength in the economies this year, both California
Pacific Partnership upon of the United States and exports and imports are
entering the White House, its trading partners, but down in year-to-date terms.
the Trump Administration also because of efforts to However, in light of the fact
has aggressively challenged stay ahead of forthcoming that the state labor market
U.S. trading partners and has tariffs and trade restrictions, remains tight, that job gains
sought to reshape U.S. trade California exports and continue on a sustained basis,
policy. As home to the largest imports advanced to new and that many of the state’s
port complex in the Western record high levels in 2017 key industries continue to
Hemisphere and significant and 2018 despite the advance, it is clear that the
cross-border and trans-Pacific Trump Administration’s California economy has been
trade activity, California’s machinations. Of course, bruised, but not broken, by
trade-related and trade- some industries and ongoing trade conflicts.
dependent industries have a commodities experienced
lot at stake. declines over this period in
contrast to the overall gains.
13California Forecast
$250,000,000,000
$200,000,000,000
$150,000,000,000
$100,000,000,000
$50,000,000,000
$0
2003
2004
2005
2006
2007
2008
2009
2010
2011
2012
2013
2014
2015
2016
2017
2018
2018
2019
YTD
YTD
TOTAL EXPORTS, CALIFORNIA ($ BILLION)
Source: WISERTrade, Analysis by UCR Center for Forecasting
$600,000,000,000
$500,000,000,000
$400,000,000,000
$300,000,000,000
$200,000,000,000
$100,000,000,000
$0
2003
2004
2005
2006
2007
2008
2009
2010
2011
2012
2013
2014
2015
2016
2017
2018
2018
2019
YTD
YTD
TOTAL IMPORTS, CALIFORNIA ($ BILLION)
Source: WISERTrade, Analysis by UCR Center for Forecasting
14Inland Empire
Forecast
The Inland Empire’s economy continued to grow throughout Of course, the region still
faces a major challenge
2019, although, as forecast by the UCR Center for Forecasting,
with housing. The supply
at a considerably slower pace than last year. However, there of new housing has been
are still reasons to be optimistic about the outlook over the next inadequate and, in turn,
home prices and rents have
year or more. Of all the industrial and business developments
both increased substantially.
in the Inland Empire, the growing importance of Ontario Sales of existing single-family
International Airport showcases the region’s vital importance to homes declined throughout
the first half of 2019, despite
the Southern California economy. The Inland Empire’s logistics
the recent decrease in
sector, a powerhouse for Southern California, continues to be interest rates. Construction
a catalyst for growth. At 4.0% as of August 2019, the region’s has also been weak. The
lack of new construction is
unemployment rate held steady over the last year, just above the
particularly pronounced in the
all-time low of 3.9% and just below the statewide rate of 4.1%. single-family segment, while
15Inland Empire Forecast
5%
4%
3%
2%
1%
0%
Jan-18 Jul-18 Jan-19 Jul-19
CES QCEW
YEAR TO YEAR PRIVATE EMPLOYMENT GROWTH: INLAND EMPIRE
Source: Bureau of Labor Statistics, California Employment Development Department, Analysis by UCR Center for
Forecasting
multifamily permits have been slower growth for the by the Bureau of Labor
strong during the first half Inland Empire and the Statistics and the California
of the year, with significant broader national and state Employment Development
growth in both Riverside and economies, the slowdown in Department, and quarterly
San Bernardino counties. the monthly survey-based figures from the Bureau’s
The rental market continues estimates is more extreme Quarterly Census of
to see increased demand, than anticipated. But there’s Employment and Wages
as evidenced by the large more to this than meets the (QCEW). While the CES series
uptick in multifamily permits. eye. One noteworthy concern is current through August
However, vacancy rates is the disparity between two 2019, the figures are survey-
remain low, especially in areas measures of employment in based and therefore subject
closer to Los Angeles, meaning the Inland Empire: monthly to measurement problems
supply is still not meeting survey-based employment inherent in all survey data.
demand. figures from the Current The QCEW data are more
Employment Statistics (CES) complete, but are reported
While the Center expected program, operated jointly with a lag, the most recent
16Inland Empire Forecast
Los Angeles County Orange County Riverside County
4%
2%
YTY % Household Employment
0%
-2%
San Bernardino County San Diego County Ventura County
4%
2%
0%
-2%
Jul-17
Jan-18
Jul-18
Jan-19
Jul-19
Jul-17
Jan-18
Jul-18
Jan-19
Jul-19
Jul-17
Jan-18
Jul-18
Jan-19
Jul-19
YEAR TO YEAR HOUSEHOLD EMPLOYMENT GROWTH: INLAND EMPIRE
JUL-17 TO JUL-19
Source: California Employment Development Department , Analysis by UCR Center for Forecasting
available data being for underestimating current estimates will underestimate
March 2019. Comparing these employment growth trends, the region’s employment
sources for March 2019, the so the region may be growing picture over the next few
latest period for which data is more quickly than the official months.
available from both sources, figures suggest. Moreover,
the CES shows that total because the survey-based CES It should also be noted that
private employment in the estimates are benchmarked data on unemployment rates
Inland Empire increased 1.3%, each year to the QCEW, there and household employment
while the QCEW shows a more is a good chance that the CES are also derived from a survey,
robust gain of 2.6%, twice as data will be revised up when the so-called Household
fast as CES estimates suggest. the annual benchmarking Survey, which is different from
process takes place. However, the CES program described
The upshot of this is that because that process will above. The chart above
monthly figures for the occur in March of next year, displays year-to-year changes
Inland Empire may be it’s highly likely that official in household employment
17Inland Empire Forecast
20 -5.0
10 -4.5
Y-o-Y (%)
Y-o-Y (%)
0 -4.0
-10 -3.5
-20 -3.0
Q1-05 Q1-11 Q1-20
EXISTING HOME SALES YEAR TO YEAR GROWTH
INLAND EMPIRE, Q1-10 TO Q2-19
Source: Freddie Mac, DataQuick, Analysis By UCR Center for Forecasting
(employment on the basis of Despite concerns over the in taxable sales also reflect
where residents live) across data, one thing is clear: the continued spending by
Southern California’s major Inland Empire economy has households and businesses
counties. The figures suggest a gained momentum as the as the regional economy has
slowdown across all counties year has progressed, and the expanded in conjunction with
beginning at roughly the same labor market is essentially at growth at the national and
time. Such a synchronized full employment. Moreover, state levels.
trend is unusual and is at odds while Health Care, Logistics,
with declines in the regional and Government have led Despite the solid performance
unemployment rate which, the region in job gains, the of the Inland Empire economy,
for the most part, is trending expansion continues to be the region’s housing market
at or near record lows. The broad-based, with job losses is a matter for concern. This
Center anticipates that these in a few sectors that are small is not unique to the Inland
estimates will also be revised in relation to the region’s job Empire – housing has lagged
at a later date. base of 1.55 million. Increases both locally and nationally
18Inland Empire Forecast
for quite some time, with in household balance sheets, were down 6.4% in the first
real private residential fixed we expect housing to continue half of 2019 compared to 7.2%
investment in the national to improve, but substantial in the state. What are the
economy reaching a post- improvements in the broader reasons for this weakness?
recession high in the fourth housing markets remain to be Some of the pull-back in
quarter of 2017. Since then, seen. housing can be traced to
residential investment has the lingering effects of last
declined for six consecutive Weakness in the local real year’s sharp rise in interest
quarters. And at the state estate market is most rates. Rising mortgage rates
level, construction has pulled apparent in sales activity throughout 2018 probably
back sharply, with residential for existing single-family had an impact on overall
permits in the first half of homes, which account for sales, but the increase in rates
2019 down 17.4% compared the lion’s share of residential over the course of 2018 has
to the same period last year. transactions. Year-to-date largely been erased, with rates
Given current economic sales of existing single-family now at their lowest point in
conditions and improvements homes in the Inland Empire over a year. The reduction in
19Inland Empire Forecast
mortgage rates has resulted to recover, one thing is clear: changes to the standard
in a spike in mortgage home sales experienced deduction, the new $10,000
refinancing, which, broadly spells of positive and negative cap on the deductibility of
speaking, bodes well for growth despite broader state and local taxes, and the
household finances as owner economic conditions. Indeed, lower limit on the amount
households will now have the chart on page 18 plots of mortgage debt on which
extra disposable income to year-over-year changes in interest is deductible, can all
spend elsewhere in the local seasonally adjusted sales of profoundly affect areas with
economy. existing single-family homes, higher-priced homes and high-
a visualization of the ebb and tax jurisdictions by increasing
It’s also worth noting that flow of the housing market. the cost of home ownership.
declining sales in the Inland Researchers at the New York
Empire are not necessarily Recent tax policy could also be Federal Reserve have found
abnormal. Taking home holding the housing market evidence to suggest that
sales data beginning in 2010, back. Under the provisions changes in federal tax laws
when the economy started of the Tax Cuts and Jobs Act, enacted in December 2017
20Inland Empire Forecast
have contributed to the slowdown of the The last thing to consider for the region’s
housing market throughout 20181. outlook is the impact of the ongoing trade
war with China. While the Inland Empire has
The Center believes that the housing market become an important conduit for goods
will improve marginally in the near future. movement in Southern California, it’s our view
Outside of a major recession, home prices that concerns over the trade war’s impact
tend to stay positive. And, broadly speaking, on the region are unfounded. The trade
the drop in interest rates should stimulate war has caused a minor disruption in trade
the housing market in the coming quarters. flow between the US and China, but from
The relationship is not instantaneous – there a macroeconomic perspective, the overall
is a lag in response time – but we remain impact has been negligible. There has been
cautiously optimistic that the housing market a noticeable shift in imports from China to
will improve. In fact, according to the California Vietnam, and the depreciation in the yuan has
Association of Realtors, there are signs that offset the sting from the tariffs that have been
lower rates and soft prices will push sales up imposed so far.
in the second half of the year, with monthly
sales increasing year-over-year in both July and It should also be borne in mind that although
August. Sales of existing homes are likely to the trade war has been underway since March
trend close to 57,000-59,000 next year, while of last year, employment in the logistics sector
the annual home price will likely stay below has been growing at a robust pace. The pace
$400,000 for the next few years. of growth may have slowed recently, but that
was to be expected, as double-digit rates
1
Richard Peach and Casey McQuillan, ‘Is the Recent Tax Reform Playing a Role in the Decline of Home Sales?’ Federal Reserve Bank of New York
Liberty Street Economics (blog), April 15, 2019, https://libertystreeteconomics.newyorkfed.org/2019/04/is-the-recent-tax-reform-playing-a-role-in-
the-decline-of-home-sales.html.
21Inland Empire Forecast
of employment growth are regionally and nationally. remain a key challenge both
hardly sustainable. In sum, While the trade war has regionally and locally. We are
Logistics will continue to be caused disruptions to certain currently seeing a new wave of
a leading sector in the Inland industries and companies, affordable housing measures
Empire. Despite a minor there is little chance of it crop up in municipalities
hiccup in trade flow at the causing a recession since US across California, but
state level, a sizable increase exports to China represent these local ordinances are
in e-commerce spending both less than one percent of GDP. addressing the symptoms
locally and abroad will keep The recent inversion of of a much larger problem:
air cargo and ground transit the yield curve has caused California simply does not
stable in the near term. considerable consternation. have enough housing,
But the Federal Reserve has affordable or otherwise. The
Despite continued calls for a indicated that monetary Inland Empire is no exception.
recession in near term, the policy will be accommodative, It must continue to add to
Center expects the Inland and markets now expect its housing stock in order to
Empire economy to grow the Federal Reserve to cut manage the cost of housing
in the coming years. The rates in late 2019 and in in the state that makes it
pace of growth is slow, but the first quarter of 2020, more difficult and costly for
that is to be expected when which should ease fears businesses to recruit and
the economy is operating of a recession (the Federal retain the talent they need to
at full employment and Reserve has indicated it will succeed in today’s economy.
the unemployment rate is “do what it takes” to sustain
trending at record lows both the expansion). Housing will
22Inland Empire
Employment
The Inland Empire’s economy continues to expand at a healthy pace, despite headline-grabbing
predictions that a recession is just around the corner. Led by Health Care, Government, and
Logistics, nonfarm employment in the Inland Empire increased 2.1% from August 2018 to
August 2019, surpassing both the state’s 1.8% and the nation’s 1.4% increases over the same
period. Still, growth has slowed over the last year, as it has in many parts of the state, trailing
the 3.3% growth in nonfarm employment last year (August 2017 to August 2018).
The rate of growth in nonfarm employment in the Inland Empire also continues to
outpace that of household employment. Nonfarm employment grew by 31,000 from
August 2018 to August 2019, while household employment increased by 21,900 over
the same period. Household employment growth is now half that of last year, shrinking
from 2.2% to 1.1% according to the latest figures. This implies that local businesses are
hiring workers faster than local residents are finding work.
23140
130
120
110
100
90
80
May-10
Sep-10
Jan-11
May-11
Sep-11
Jan-12
May-12
Sep-12
Jan-13
May-13
Sep-13
Jan-14
May-14
Sep-14
Jan-15
May-15
Sep-15
Jan-16
May-16
Sep-16
Jan-17
May-17
Sep-17
Jan-18
May-18
Sep-18
Jan-19
May-19
Jan-10
Payroll Household
INLAND EMPIRE PAYROLL VS. HOUSEHOLD EMPLOYMENT
JAN-10 TO AUG-19
Source: California Employment Development Department, Analysis By UCR Center for Forecasting
Along with rising levels of nonfarm and additional housing units will be necessary to
household employment, the Inland Empire’s ensure further growth. High housing costs
labor force has also expanded. From August continue to hamper the efforts of many state
2018 to August 2019, it expanded 0.9%, employers to attract the talent they need, and
down from the 1.2% increase of last year, the Inland Empire is facing challenges to future
but outpacing the -0.2% decline in the state economic growth because of escalating home
overall. Although the relative affordability of prices and rents relative to incomes.
the Inland Empire has insulated it from the flat
labor force growth in many parts of the state,
24Inland Empire | Employment
2,100 9.0
8.0
2,050
7.0
2,000 6.0
5.0
1,950
4.0
1,900 3.0
2.0
1,850
1.0
1,800 0.0
Aug-14
Nov-14
Feb-15
May-15
Aug-15
Nov-15
Feb-16
May-16
Aug-16
Nov-16
Feb-17
May-17
Aug-17
Nov-17
Feb-18
May-18
Aug-18
Nov-18
Feb-19
May-19
Aug-19
Labor Force Unemployment Rate
INLAND EMPIRE LABOR FORCE AND UNEMPLOYMENT RATE
AUG-14 TO AUG-19
Source: California Employment Development Department, Analysis by UCR Center for Forecasting
Despite growth in the labor force, the region’s unemployment rate remained steady over the last
year, standing at 4.0% as of August 2019, just above the all-time low of 3.9% and just below the
state’s unemployment rate. This is somewhat higher than nearby Orange County (2.7%) and San
Diego County (3.1%), but slightly lower than Los Angeles County, where the rate was 4.4%.
25Inland Empire | Employment
Current Industry Trends
Economic expansion in the Inland MSA Aug. '19
YTY % YTY
Change Change
Empire continues to create
Health Care 234.4 5.4% 12.1
opportunities for local residents across
Government 263.1 2.2% 5.7
a spectrum of skill sets. Over the last
Leisure and Hospitality 174.7 2.4% 4.0
year, employment has expanded Transport,Warehouse,Util. 137.7 3.0% 4.0
over a broad range of sectors, and Admin Support 104.0 2.8% 2.9
with nonfarm employment growth Prof Sci and Tech 44.3 4.8% 2.0
outpacing household employment Manufacturing 102.8 1.2% 1.2
growth, many of these opportunities Educational Services 20.7 3.3% 0.7
are going to local residents. This has Financial Activities 44.1 1.4% 0.6
the potential to reduce commute Management 8.4 0.8% 0.1
times and enhance quality of life. NR/Mining 1.2 -0.4% 0.0
Information 11.2 -0.6% -0.1
Retail Trade 181.4 -0.1% -0.1
Construction 104.8 -0.5% -0.5
Wholesale Trade 64.4 -1.2% -0.8
Other Services 44.9 -1.8% -0.8
INLAND EMPIRE - EMPLOYMENT BY INDUSTRY
Source: California Employment Development
Department, Analysis by UCR Center for Forecasting
The region’s health care sector added the most jobs last year, increasing payrolls by
5.4% (12,100 positions). This year’s gains and are well ahead of the 2.8% growth in the
state over the same period, but trailed last year’s increase of 6.5%
With more revenue flowing into local coffers, government payrolls are also increasing.
This is a welcome sign, because the government sector is the largest source of
nonfarm jobs in the region. From August 2018 to August 2019, government payrolls
increased 2.2% (5,700 positions) in the Inland Empire, outpacing the 1.6% statewide
rate of growth over the same period and increasing from the 1.9% growth rate the
previous year. Local government (3,800 positions) was responsible for the most jobs
added over the last year, while state government (5.1%) led in terms of growth rate.
26Inland Empire | Employment
Transportation, Warehouse and Utilities had a strong year as well. From August 2018
to August 2019, payrolls grew 3.0% (4,000 positions), outpacing the 1.9% growth in the
state overall. This sector is also poised for continued growth with 5.7 million square
feet of warehouse space completed during the first half of 2019, a 1.4% increase over
levels at the end of 2018. The sector is a significantly larger source of jobs in the Inland
Empire than it is in other parts of the state, accounting for 8.8% of total nonfarm jobs
compared with 3.9% in the state overall. Major players like Amazon continue to fuel
these gains; the company announced plans to expands its air delivery operations at
March Air Force Base in Riverside, operating six flights per day at the end of 20182.
FedEx is also expanding at Ontario Airport, building a 51-acre facility that almost triples
its capacity for cargo storage and sorting, and equipment maintenance3.
Leisure and Hospitality also continues to grow in response to growth in jobs and
discretionary household income. From August 2018 to August 2019, the sector grew
2.4%, adding 4,000 positions. This marks a slight increase from last year’s growth of
2.3% and puts the Inland Empire just behind the 2.5% rate in the state over the same
period. Food Services and Drinking Places were responsible for most of the gains in
Leisure and Hospitality payrolls, with restaurants and limited-service eating places
adding 3,300 positions each over the last year.
Administrative Support also posted sizeable gains last year, boosting payrolls by 2.8%
(2,900 positions) from August 2018 to August 2019. This trails the state’s 2.6% growth over
the same period and marks a slight increase from the 2.7% growth in the region last year.
Professional, Scientific, and Technical Services posted a sizeable gain, increasing payrolls
by 4.8% (2,000 positions). This outshines the 3.6% growth in the state over the same
period but was somewhat slower than the 5.3% growth rate in the region last year.
Although most of the region’s industries continued to grow steadily over the year, a
handful lost jobs. Notably, Other Services fell by 0.8% (-1,800 positions) and Wholesale
Trade fell by 0.8% (-1,200 positions). In addition, after posting robust gains last year,
Construction payrolls have seen little change so far this year, falling by 0.5% (-500
positions) year-over-year in August.
2
McMillan, R., & Kabc. (2018, October 11). Amazon Air to start operations at March Air Reserve Base. Retrieved from https://abc7.com/business/
amazon-air-to-start-operations-at-march-air-reserve-base/4456840/
3
Scauzillo, S. (2019, September 24). FedEx expanding operations at Ontario airport but old military buildings are roadblocks to future projects.
27 Retrieved from https://www.dailybulletin.com/2019/09/24/fedex-building-new-cargo-sorting-facility-at-ontario-airport-but-many-old-military-
buildings-stand-as-roadblocks-to-future-projects/Inland Empire | Employment
Establishment Growth
Along with growing employment levels, business formation in the Inland Empire continued
across a broad range of industries in 2018. The number of establishments increased 4.8% from
2017 to 2018, outpacing the state (2.5%) and nation (1.8%). This is partly due to key industries in
the region growing faster than the overall economy, but is also because the region’s faster rate
of population growth spurs new business opportunities. The number of establishments grew
5.4% in Riverside County, and 4.2% in San Bernardino County.
2018 1-Year 2-Year Growth was spread across all
Industry Establish- Change Change
ments (%) (%) industries in the Inland Empire.
Riverside County, California 65,889 5.4 11.5 Transportation, Warehouse and
San Bernardino County, California 60,303 4.2 9.0 Utilities led, growing 15.2% from 2017
Total 126,192 4.8 10.3 to 2018.
Transport,Warehouse,Util. 3,412 16.9 27.0
Educational Services 792 13.7 18.7 Establishments increased in Educational
NR/Construction 9,174 12.7 19.2 Services (13.0%), NR/Construction
Real Estate 3,827 12.6 17.5
(12.9%), and Real Estate (12.0%).
Admin Support 4,412 9.2 15.2
Other Services 6,145 8.8 11.5
Prof Sci and Tech 6,764 8.6 12.6 Professional, Scientific, and Technical
Wholesale Trade 4,656 8.4 12.0 Services, and Administrative Support
Leisure and Hospitality 8,381 7.8 12.6
expanded at a healthy pace over the
Health Care 57,068 7.4 17.0
last year, growing by 8.8% and 8.6%
Finance and Insurance 3,317 6.2 10.0
respectively.
Manufacturing 3,691 5.9 7.8
Retail Trade 9,984 4.4 6.5
Management 264 3.8 9.7 Leisure and Hospitality also had an
Information 767 3.1 10.4 increase in establishments over the last
Government 2,901 0.6 1.1 year, growing 7.5% from 2017 to 2018.
INLAND EMPIRE - ESTABLISHMENTS BY INDUSTRY
Source: U.S. Bureau of Labor Statistics, Analysis by
UCR Center for Forecasting Establishment growth was more
modest for Information (2.3%), and
Government (0.8%).
28You can also read