The Long View: The Peak in Peaks - ClearBridge Investments
←
→
Page content transcription
If your browser does not render page correctly, please read the page content below

MARKET COMMENTARY
Third Quarter 2021
The Long View: The Peak in Peaks
Key Takeaways
Headline risks around peak everything overlook rolling
stock corrections in large swaths of the market and
bearish investor sentiment, factors likely to soften the
current drawdown.
Jeffrey Schulze, CFA
Director, Investment Strategist The future for equities may not be as gloomy as peak
monetary policy suggests due to a change in how the Fed
approaches inflation and the likelihood of new leadership
that could make the central bank even more dovish.
Despite a near-term drag on growth from the Delta
variant, the ClearBridge Recession Risk Dashboard
remains firmly in expansionary territory and the economy
appears poised to accelerate into the fourth quarter and
early 2022.
Market Drawdown May Have Run Most of Its Course
As we enter the weaker seasonal period of the calendar for equity
markets, something several friends said last summer comes to
mind: they were waiting for a pullback to deploy cash. This
mindset can be fraught with peril, as no one can time the market.
Although some may be lucky enough to catch an occasional top
or bottom, few can consistently outperform with this strategy.
Even with perfect foresight, a market timer may not do so well.
As we enter the final quarter of 2021, the din of market skeptics
continues, fueled by a volatile September. The S&P 500 Index
experienced its first 5% drawdown in almost a year, ending the
seventh-longest streak in its history. A drawdown was bound to
occur eventually as readers of last quarter’s Long View may recall.
Specifically, we highlighted how new bull markets often
experience a period of consolidation at this point in the cycle as
the early gains are digested amid peaking economic momentum
and earnings growth. The narrative has now broadened beyond
peak economic and earnings growth, however, to include peak
everything from Fed/fiscal support to investor euphoria, which
has some investors questioning just how far the current selloff
may progress. While it’s possible this consolidation has more
downside ahead, we continue to believe there’s more to the story;
many of these peak moments are not quite as worrisome as they
may at first appear.
One peak that remains distant for many individual stocks is their
all-time high. Although major U.S. indexes are only down mid-
620 Eighth Avenue, New York, NY 10018 | 800 691 6960 | ClearBridge.com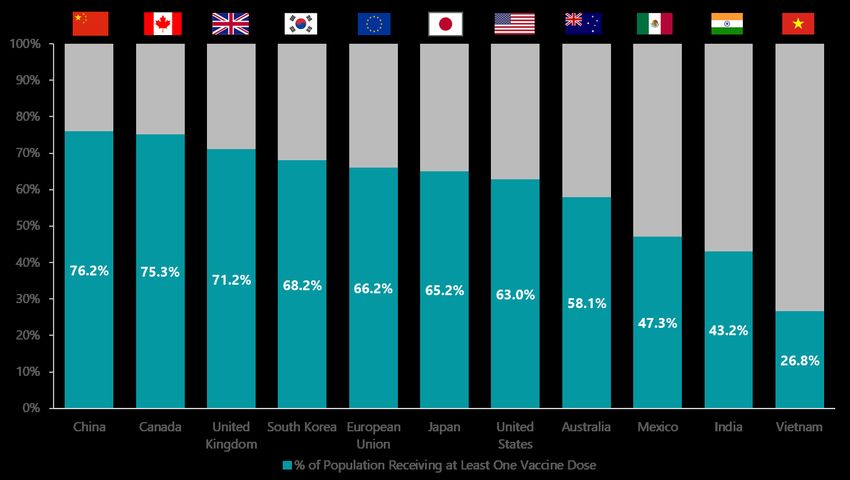
THE LONG VIEW

                single digits from their records, the average stock has experienced
                a much larger price decline from peak, with smaller companies
                bearing the brunt of the selling pressure. In fact, 71.5% of S&P
                500 companies have experienced a 10% drawdown from peak,
                while 75.4% of small cap stocks in the Russell 2000 Index have
                suffered a bear market decline of -20% or greater. The fact that
                these rolling corrections have already played out could prove a
                cushion for the headline indexes and lessen the chances of
                substantially worse declines from current levels.

                Exhibit 1: Average Stock Has Already Corrected

                                                   Index Decline from High
                                     S&P 500                      Nasdaq 100                     Russell 2000
                    0%
                                       -5.1%                          -6.6%                         -6.3%
                   -5%
                  -10%
                  -15%
                  -20%
                  -25%
                  -30%
                  -35%
                  -40%
                  -45%

                                            Average Stock Decline from High
                                      S&P 500                       Nasdaq 100                     Russell 2000
                     0%
                    -5%
                  -10%                 -20.7%                          -17.9%

                  -15%
                  -20%
                                                                                                      -44.1%
                  -25%
                  -30%
                  -35%
                  -40%
                  -45%

                High for S&P 500 – Sept. 2, 2021; Nasdaq 100 – Sept. 7, 2021; Russell 2000 – March 15, 2021. Stock
                declines are an average of the individual declines from each stock’s all-time high. Data as of Sept. 30,
                2021. Source: FactSet.

                Another peak that may be misperceived centers around investor
                euphoria, which typically coincides with a sizable correction once
                there is no one left to buy (and drive markets higher) because
                everyone is already fully invested. Despite the strongest post-
                recession bull market return to this point in the post-World War II
                era, retail investor sentiment has turned decidedly bearish in
                recent weeks. One metric we use to gauge this is the American
                Association of Individual Investors (AAII) Sentiment Survey, which
                has been tracked since 1987. This data nosedived to a -12%
                spread between bullish and bearish readings last week, a level
                comparable with the 2020 recessionary drop and its aftermath.
                However, this metric tends to be more of a contra indicator at
PORTFOLIO MANAGER COMMENTARY
extremes in that when it moves too deep toward bullish or
bearish readings, the market tends to then move in the opposite
direction. While a further decline may be needed to reach truly
extreme levels, this metric has already seen a substantial decline,
meaning much of the damage may have already occurred.
Exhibit 2: Retail Sentiment Reset
3
More Bearish
2.5
2
1.5
More Bullish
1
0.5
0
Jan. May Sept. Jan. May Sept. Feb. June
2019 2019 2019 2020 2020 2020 2021 2021
Recession Bull/Bear Ratio
Data as of Sept. 24, 2021. Source: American Association of Individual Investors.
Policy is also at peak, which explains much of the peaks achieved
in economic momentum and earnings growth we mentioned last
quarter. Both fiscal and monetary support have likely reached a
pinnacle, meaning things might not be as good for financial
markets going forward as they were earlier in 2021. However, the
future may not be as gloomy as policy trajectory suggests. While
the Federal Reserve appears to be setting the stage for tapering
its QE purchases, monetary policy will remain incredibly
supportive even when the program has been fully wound down.
The Fed’s move to an “average inflation targeting” approach has
changed its reaction function from pre-emptively fighting
inflation to more passively and accommodatively allowing the
economy to run hotter than usual.
Meet the New Hands-Off Fed
To that end, the Fed would have likely already started tightening
policy by this point in past cycles. For example, the
underemployment rate (U-6) that includes part-time and
marginally attached workers along with unemployed persons
currently stands at 8.8% today, down from 22.9% in April 2020.
When the Fed began tapering QE purchases last cycle at the very
end of 2013, it stood at 13.1% (from a peak of 17.2% in April
2010). Going back even further, this measure stood at 11.4% in
1994 and 9.6% in 2004 when the Fed began raising interest rates.
Put differently, the Fed has allowed the labor market to improve
to a greater degree today as compared to past tightening cycles.
Further, the Fed is still arguably the most dovish central bank onTHE LONG VIEW
the planet, given ultra-accommodative policy toward the only
economy in the world that has already recovered to its pre-
COVID-19 growth trend. This isn’t your father’s Federal Reserve!
While the prospect of a less accommodative Fed may be top of
mind today, the traditionally dovish central bank may become
The traditionally even more so following the recent departures of two more
dovish central bank hawkish Fed governors, Eric Rosengren and Robert Kaplan,
although neither was a voting FOMC member. Additionally, the
may become even terms of the three key Federal Reserve Board positions (Chair,
more so following the Vice Chair, and Vice Chair for Supervision) all expire in the next
recent departures of five months. Even though two of these three leaders could stay on
the board even if not re-nominated to their current positions
two more hawkish
(Vice Chair for Supervision Randal Quarles’s board term ends in
Fed governors. 2032 and Jay Powell’s in 2028), the leadership of the Fed along
with a meaningful portion of the FOMC membership could be
newer, more dovish appointees. Although the FOMC is not truly a
democracy, the odds appear to favor a continuation of the
currently loose monetary stance in the coming months.
Fiscal support has also likely peaked, with the Federal pandemic
unemployment programs expiring at the start of September. Over
8.5 million workers lost all benefits and many more lost $300
supplemental payments. While there are many factors
contributing to the present labor market tightness, expiration of
these benefits should help encourage some workers to seek jobs,
a welcome development given the 10.9 million job openings
across the country. This should also contribute to easing wage
pressures in the coming months; for example, data from Gridwise
Analytics shows that wages for ride-hailing service drivers have
been on the decline over the past three weeks. This is particularly
the case in states where the pandemic unemployment programs
recently expired (where driver wages were down -5.3%) versus
states that elected to end them earlier (-0.3%).
Exhibit 3: Labor Supply Coming
18 Federal UI Benefits
16
Number of Claims (Millions)
14
12 PUA and PEUC
10 Expiration: 9/6
8
6
4
2
0
Mar. 2020 Jun. 2020 Sep. 2020 Dec. 2020 Mar. 2021 Jun. 2021 Sep. 2021
Pandemic Unemployment Assistance (PUA)
Pandemic Emergency Unemployment Compensation (PEUC)
Data as of Sept. 11, 2021, latest available as of Sept. 30, 2021. Source: Bloomberg.PORTFOLIO MANAGER COMMENTARY An easing of the labor supply shortage could have positive ripple effects into the broader supply chain where bottlenecks remain a challenge for many companies. In fact, several S&P 500 companies have already pre-announced results and “kitchen- sinked” the quarter, blaming issues including labor shortages and supply chain problems for negative results. However, with U.S. and global COVID-19 cases on the decline and vaccination rates rising such that herd immunity is on the horizon in many countries, the current moment may represent the peak bottleneck for supply chain challenges as normalization in labor, shipping and COVID-19 occurs in the coming quarters. Exhibit 4: Herd Immunity Within Reach Data as of Sept. 15, 2021. Source: Our World in Data. With Delta having peaked in the U.S., the economy appears poised to re-accelerate from a late summer downdraft. While it could take another month or two for this to become apparent in hard data, survey or “soft” data such as the ISM Manufacturing PMI showed improvement more recently with the new orders component — which the ClearBridge Recession Risk Dashboard focuses on — remaining at a very healthy 66.7 versus July’s 64.9 reading. These prints, combined with continued recent strength in housing and the consumer, have helped the Citi Economic Surprise Index move higher in recent weeks from levels consistent with prior troughs.
THE LONG VIEW

                Exhibit 5: Economic Surprises on the Rebound
                                               300

                                               250

                                               200

                Citi Economic Surprise Index
                                               150

                                               100

                                                50

                                                 0

                                               -50

                                         -100

                                         -150

                                         -200
                                             2011 2012 2013 2014 2015 2016 2017 2018 2019 2020 2021

                The Citi Economic Surprise Index is United States based. Data as of Sept., 30, 2021. Source: FactSet.

                Even though the Delta wave weighed on third-quarter economic
                activity, the ClearBridge Recession Risk Dashboard has
                remained buoyant with all 12 indicators and the overall signal
                firmly in green or expansionary territory. We continue to
                believe that recessionary risks are well below normal, and the
                economy appears poised to accelerate into the fourth quarter
                and early 2022.

                Exhibit 6: ClearBridge Recession Risk Dashboard

                Data as of Sept. 30, 2021. Source: BLS, Federal Reserve, Census Bureau, ISM, BEA, American Chemistry
                Council, American Trucking Association, Conference Board, and Bloomberg. The ClearBridge
                Recession Risk Dashboard was created in January 2016. References to the signals it would have sent in
                the years prior to January 2016 are based on how the underlying data was reflected in the component
                indicators at the time.

                Importantly, the U.S. appears to be moving into the final stage of
                the reopening process from the pandemic. This stage includes a
                return to in-person learning, a return to offices, a pickup in
                business travel and a more persistent rebound in services
PORTFOLIO MANAGER COMMENTARY
spending. On the back of growing demand, businesses will
continue to replenish depleted inventories and capex trends
should remain strong. Globally, consumers have over $5 trillion in
excess savings to draw upon when ready to spend or invest. The
primary risk to financial markets remains the emergence of a
vaccine-resistant mutation; however, much of the world appears
to be learning to live with the virus. Particularly encouraging was
the recent announcement of positive clinical trials for a
therapeutic treatment administered orally, which could be a game
changer for the treatment of COVID-19 patients.
Exhibit 7: Global Consumers Flush
Global Excess Savings
$5 Trillion Global
$6 Excess Savings
Accumulated
$5
$4
Trillions
$3
$2
$1
$0
Q1 Q2 Q3 Q4 Q1 Q2
2020 2021
U.S. Euro Area Japan U.K.
China India Other Total
Note: Other includes Canada, Australia, Sweden, Norway, and South Africa.
Source: Goldman Sachs.
As the global economy continues to normalize, U.S. economic
growth should weather the peak in peaks and remain above-
trend for the next 12 to 18 months. While it may not be a
perfectly smooth path, supportive market internals, contrarian
retail sentiment, a still-dovish Fed, potentially easing labor market
and supply chain bottlenecks, and a re-accelerating economy
buoying earnings should lead to continued upside in equity
markets. Considering all of these dynamics, rather than focusing
solely on the above-average valuations reached in the recent bull
market, it appears that the peak in peaks may already be
somewhat priced in. In fact, a quote comes to mind from the late
market researcher Richard Russell: “A bull market is a bull. It
constantly tries to throw off its riders.” The challenge equity
investors may be facing could be simply holding on at the
present moment.
Past performance is not a guarantee of future results. Investors cannot invest directly in an index,
and unmanaged index returns do not reflect any fees, expenses or sales charges. Copyright © 2021
ClearBridge Investments.
All opinions and data included in this commentary are as of the publication date and are subject to
change. The opinions and views expressed herein are of the portfolio management team named above
and may differ from other managers, or the firm as a whole, and are not intended to be a forecast of
future events, a guarantee of future results or investment advice. This information should not be used as
the sole basis to make any investment decision. The statistics have been obtained from sources
believed to be reliable, but the accuracy and completeness of this information cannot be guaranteed.THE LONG VIEW
Performance source: Internal. Benchmark source: Russell Investments. Frank Russell Company
(“Russell”) is the source and owner of the trademarks, service marks and copyrights related to the
Russell Indexes. Russell® is a trademark of Frank Russell Company. Neither Russell nor its licensors
accept any liability for any errors or omissions in the Russell Indexes and/or Russell ratings or
underlying data and no party may rely on any Russell Indexes and/or Russell ratings and/or
underlying data contained in this communication. No further distribution of Russell Data is permitted
without Russell’s express written consent. Russell does not promote, sponsor or endorse the content
of this communication.You can also read