The Maltese Falcoin On cryptocurrencies and blockchains - JP Morgan Private Bank

Page created by Darrell Sparks
 
CONTINUE READING
The Maltese Falcoin On cryptocurrencies and blockchains - JP Morgan Private Bank
EYE ON THE MARKET

The Maltese Falcoin
On cryptocurrencies and blockchains
In this piece, we examine the adoption trends, capital flows and use
cases for cryptocurrencies and blockchains. Use cases include crypto
as a store of value, cross border remittances, decentralized finance,
non-fungible tokens and blockchain adoption in financial services.

By Michael Cembalest
Chairman of Market and Investment Strategy for J.P. Morgan Asset & Wealth Management
The Maltese Falcoin On cryptocurrencies and blockchains - JP Morgan Private Bank
EYE ON THE MARKET • MICHAEL CEMBALEST • J.P. MORGAN
Ac c e s s o u r f u l l c o r o n a v i r u s a n a l y s i s w e b p o r t a l h e r e                                          Fe b r u a r y 3 , 2 0 2 2

The Maltese Falcoin: on cryptocurrencies and blockchains
First let me try and anticipate some of your questions.
      Yes, I am turning 60 this May. This obviously renders me too old to comment on this topic
      Yes, I understand creative destruction. Hundreds of companies have been removed from the S&P 500 since
       1980 due to distress, mostly inflicted by more innovative competitors. We maintain a lot of creative
       destruction trackers; see Appendix B
      Yes, I follow the changes taking place that break down barriers. We track the plummeting cost of
       information storage, improvements in CPU processing speeds, increases in 5G download speeds and gains
       in artificial intelligence and machine learning. These factors have lowered barriers of entry for new
       companies to challenge incumbents in a variety of sectors, particularly financial services. See Appendix C
      Yes, I showed this piece to crypto and blockchain professionals. Their rebuttals appear in Section 8
      Yes, I know this is 28 pages but it’s a quick read since there are a lot of charts
      No, I did not anticipate the increase in crypto values from $25 billion to $250 billion to $2.5 trillion (and
       now $1.5 trillion), and I recognize that I am late to this
      No, I am not going to extensively cover the technical jargon involved. If you would like to read up on
       mempools, cryptographic hash puzzles and Merkle roots, there are two advanced primers in Appendix A
      No, I am not going to address issues other than the investment rationale for crypto and blockchain use
       cases. Others have written on mining energy intensity, on whether crypto is “good or “bad” for society, on
       illicit crypto transactions and on crypto’s impact on Central Banks trying to retain control over broad money,
       inflation and employment. Such topics are beyond the scope of this piece
      No, I don’t speak for anyone at JP Morgan other than myself. If you disagree with the opinions and data
       expressed here, don’t hold anyone else accountable for them
OK, let’s begin.
Cryptocurrency market cap                                                                  Table of contents
US$, trillions
$3.0                                                                                       1. Venture capital flows into crypto/blockchain
                                                                                           2. Investor crypto adoption trends
$2.5
                                                                                           3. Bitcoin and the store of value
$2.0
                                                                                           4. Crypto and cross border remittances
$1.5                                                                                       5. Decentralized finance
                                                                                           6. Non-fungible tokens and the art world
$1.0
                                                                                           7. Financial services and the blockchain
$0.5
                                                                                           8. Rebuttals to this paper
$0.0                                                                                       9. Conclusions: the Maltese Falcoin
    2016      2017     2018     2019      2020                      2021         2022
Source: TradingView, JPMAM. February 2, 2022.
                                                                                           10. Appendices

                        INVESTMENT PRODUCTS ARE: ● NOT FDIC INSURED ● NOT A DEPOSIT OR OTHER OBLIGATION OF,
                         OR GUARANTEED BY, JPMORGAN CHASE BANK, N.A. OR ANY OF ITS AFFILIATES ● SUBJECT TO                                                     1
                            INVESTMENT RISKS, INCLUDING POSSIBLE LOSS OF THE PRINCIPAL AMOUNT INVESTED
EYE ON THE MARKET • MICHAEL CEMBALEST • J.P. MORGAN
Ac c e s s o u r f u l l c o r o n a v i r u s a n a l y s i s w e b p o r t a l h e r e                                                        Fe b r u a r y 3 , 2 0 2 2

[1] One thing’s for sure: there’s a ton of money pouring into crypto and blockchain investments
If you believe that mobilization of capital is a can’t-miss way of assessing the future, you can stop reading here
and conclude that crypto-related investments are bound to succeed. As shown below, venture capitalists have
been plowing money into crypto at an accelerating pace, rivaling other innovation categories. The year 2021
was a particularly strong year for capital raising; average pre-IPO valuations for crypto and blockchain
investments are now much higher than for VC investments overall. I’m often told that some of the most
successful, brilliant minds in Silicon Valley are working on crypto and blockchain solutions, and many of them
have impressive track records of delivering returns to institutional and individual investors. Even so, I’m more
interested in what happens to the capital and its long-run returns than on its mobilization.
A breakdown of VC investments in crypto shows ~40% in trading, investing and lending businesses; ~20% in Web
3.0 applications and NFTs; ~10% in custody; and the remainder in a variety of businesses focused on compliance,
mining and data security.
Venture capital investments by sector                                                      Venture capital investments in crypto and blockchain
US$, billions                                                                              US$, billions                                               Number of deals
$120                                                                                       $12                                                                        600
           Crypto                                                                                       Venture capital money invested (lhs)
$100       Quantum                                                                                      Deal count (rhs)
                                                                                           $10                                                                        500
           CloudTech/Devops
 $80       Robotics & Drones                                                                $8                                                                        400
           AI / machine learning
 $60                                                                                        $6                                                                        300
           Fintech

 $40                                                                                        $4                                                                        200

 $20                                                                                        $2                                                                        100

   $0                                                                                       $0                                                                        0
           2017         2018           2019          2020                          2021       2016       2017       2018        2019      2020       2021
Source: Pitchbook, Galaxy Digital Research. January 2022.                                  Source: Pitchbook, Galaxy Digital Research. January 2022.

VC money invested in crypto & blockchain by stage                                          Crypto/blockchain vs all VC pre-money valuation
US$, billions                                                                              US$, millions
$12                                                                                        $80
            Later Stages                                                                                   Crypto & blockchain          All venture capital
                                                                                           $70
$10         Series A
                                                                                           $60
            Seed
 $8
            Pre-seed                                                                       $50

 $6                                                                                        $40

                                                                                           $30
 $4
                                                                                           $20
 $2
                                                                                           $10

 $0                                                                                         $0
    2016        2017       2018        2019       2020                      2021               2016        2017       2018        2019       2020         2021
Source: Pitchbook, Galaxy Digital Research. January 2022.                                  Source: Pitchbook, Galaxy Digital Research. January 2022.

                                                                                                                                                                          2
EYE ON THE MARKET • MICHAEL CEMBALEST • J.P. MORGAN
Ac c e s s o u r f u l l c o r o n a v i r u s a n a l y s i s w e b p o r t a l h e r e                                                            Fe b r u a r y 3 , 2 0 2 2

[2] Crypto adoption trends and attitudes
As shown below, crypto adoption is rising across investor types and regions. While institutional ownership has
been low to-date, it is now growing. Bridgewater estimated that ~1 million Bitcoin (around 5% of total issued
supply) are now held by institutional investors via custodial intermediaries1. The last chart shows purchase
intent in the future, which continues to rise. Note: missing bars are not zero, they represent data that was not
published as part of the Fidelity study.
Some crypto adoption anecdotes: Square and Tesla combined invested nearly $2 billion USD in Bitcoin, and
Square and PayPal retail customers reportedly buy an amount equivalent to a majority of the new supply of
Bitcoin entering the market each day2.
Crypto adoption by region                                                                    Crypto adoption by investor type
% of investors with digital asset allocations                                                % of investors that own digital assets
80%                                                                                          100%
                                                                                                                                                    US      Europe     Asia
             US      Europe        Asia                                                       90%
70%                                                                                           80%
60%                                                                                           70%
                                                                                              60%
50%
                                                                                              50%
40%                                                                                           40%
                                                                                              30%
30%
                                                                                              20%
20%                                                                                           10%
10%                                                                                            0%
                                                                                                       Financial         High net Family offices Pensions Endowments
    0%                                                                                                 advisors            worth                               / foundations
                 2019                      2020                  2021                                                   individuals
Source: Fidelity Institutional Digital Assets Survey. September 2021.                        Source: Fidelity Institutional Digital Assets Survey. September 2021.

Crypto ownership by digital asset                                                            Future purchase intent of digital assets
% of investors by region                                                                     % of investors
50%                                                                                          90%
                                                               US       Europe        Asia              US      Europe     Asia
45%                                                                                          80%
40%
                                                                                             70%
35%
                                                                                             60%
30%
25%                                                                                          50%
20%                                                                                          40%
15%                                                                                          30%
10%                                                                                          20%
    5%
                                                                                             10%
    0%
           Bitcoin     Ethereum        Litecoin        XRP Bitcoin    Binance                 0%
                                                            cash        coin                                  2019                      2020                  2021
Source: Fidelity Institutional Digital Assets Survey. September 2021.                        Source: Fidelity Institutional Digital Assets Survey. September 2021.

1
  “Evolution of Institutional Investors’ Exposure to Cryptocurrencies and Blockchain Technologies”, Bridgewater
Daily Observations, January 14, 2022
2
  “Feeling the heat from employees, Wall Street banks get closer to adopting bitcoin”, CNBC, Feb 12, 2021 and
“Square and PayPal may be the new whales in the crypto market as clients flock to bitcoin”, CNBC, Nov 24, 2020
                                                                                                                                                                            3
EYE ON THE MARKET • MICHAEL CEMBALEST • J.P. MORGAN
Ac c e s s o u r f u l l c o r o n a v i r u s a n a l y s i s w e b p o r t a l h e r e                                                                                                                                                                                                             Fe b r u a r y 3 , 2 0 2 2

[3] Bitcoin and the “store of value” thesis
Let’s start with the most widely cited use case for digital currency: as a store of value, and let’s use Bitcoin as a
proxy for it given its dominant market cap among all cryptocurrencies.
Top 20 cryptocurrencies market cap by segment
US$, billions
$700                                                                                                                                                                                 Currency
                                                                                                                                                                                     Platform                                                Currency: digital medium of exchange or store of value
$600                                                                                                                                                                                 Stablecoin
                                                                                                                                                                                     DeFi                                                    Platform: blockchain ecosystem for DeFi applications
                                                                                                                                                                                     Remittance
$500                                                                                                                                                                                 Exchange                                                Stablecoin: cryptocurrency with fixed value
                                                                                                                                                                                     Other                                                   DeFi: allows peer to peer lending and exchanges without a
$400
                                                                                                                                                                                                                                             centralized institution

                                                                                                                                                                                                                 Crypto.com Coin
                                                                                                                                                                                               Wrapped Bitcoin
$300                                                                                                                                                                                                                                         Remittance: cryptoassets for cross border transfers
                                        Binance Coin

                                                                                                                                      Binance USD
                                                                                                                                                                                                                                             Exchange: cryptoassets facilitating cheaper transactions
                                                                                                                         Avalanche

$200
                                                       USD Coin
                    Ethereum

                                                                                                                                                                TerraUSD
                                                                                                   Dogecoin

                                                                                                                                                    Shiba Inu
                                                                                                              Polkadot
                                                                  Cardano

                                                                                                                                                                                      Cosmos
                                                                                                                                                                           Polygon
          Bitcoin

                                                                            Solana
                               Tether

                                                                                           Terra

$100
                                                                                     XRP

                                                                                                                                                                                                                                    Dai
  $0
Source: CoinMarketCap, CoinMetrics, JPMAM. January 25, 2022.

I understand why people are interested in cryptocurrencies with a fixed supply as a store of value. The
developed world has drowned itself in debt and fiat money, and at a pace that dwarfs anything seen in the wake
of the financial crisis in 2008. These are the kind of economic degradations that accompanied the end of prior
world reserve currencies during the last millennia, and which accompanied the end of reserve currency status
during ancient times as well. Central Banks and Treasuries have created a massive confidence void, and it would
have been strange if some alternative to fiat money didn’t appear on the scene.
Dev world government debt & central bank balance sheets                                                                                                                                                                                   Faster growth in the US money supply this time around
% of GDP                                                                                                                                                                             US$, trillions M2 money supply + institutional money market fund balances, index
140%                                                                                                                                                                                                                               $30     145
                                                                                                                                                                                                                                           140                            Global Coronavirus Crisis
130%                                                                                                          Government debt
                                                                                                                                                                                                                                   $25     135
120%                                                                                                                                                                                                                                       130
                                                                                                                                                                                                                                   $20
                                                                                                                                                                                                                                           125
110%
                                                                                                                                                                                                                                           120
                                                                                                                                                                                                                                   $15
100%                                                                                                                                                                                                                                       115                                           Global Financial Crisis
                                                                                                                                      Central bank                                                                                         110                                           (Aug 2008-Sept 2010)
                                                                                                                                     balance sheets                                                                                $10
 90%
                                                                                                                                                                                                                                           105

 80%                                                                                                                                                                                                                               $5      100
     2009     2011    2013     2015     2017     2019                                                                                                                                 2021                                                  Jan-2020           Jul-2020      Jan-2021          Jul-2021     Jan-2022
Source: JP Morgan Economic Research. November 2021.                                                                                                                                                                                       Source: St Louis Fed, ICI, J.P. Morgan Asset Management. Dec 2021.

Global debt                                                                                                                                                                                                                               Major reserve currencies since 1250 AD
% of GDP
 300%                                                                                                                                                                                                                                     Florentine Florin
                      Public debt
                      Household debt                                                                                                                                                                                                       Venetian Ducat
 250%                 Non-financial corporate debt
                                                                                                                                                                                                                                          Portuguese Real
 200%                                                                                                                                                                                                                                        Spanish Real
                                                                                                                                                                                                                                             Dutch Guilder
 150%
                                                                                                                                                                                                                                              French Livre
 100%
                                                                                                                                                                                                                                            British Sterling

  50%                                                                                                                                                                                                                                            US Dollar
                                                                                                                                                                                                                                                 Eurodollar
    0%
         1970                                 1980                                   1990                                2000                                         2010                                           2020                                  1200            1400         1600         1800         2000
 Source: IMF. 2020.                                                                                                                                                                                                                       Source: BTCM Research. 2020.

                                                                                                                                                                                                                                                                                                                             4
EYE ON THE MARKET • MICHAEL CEMBALEST • J.P. MORGAN
Ac c e s s o u r f u l l c o r o n a v i r u s a n a l y s i s w e b p o r t a l h e r e                                                             Fe b r u a r y 3 , 2 0 2 2

A fiat currency reckoning may be drawing closer: by the year 2030, US Federal tax revenues will be exceeded
by mandatory outlays on entitlements and interest. In other words, there will be no money left for non-defense
discretionary spending which drives growth and productivity over the long run, other than through deficit
spending. Irrespective of your opinion on Bitcoin, this is a bad sign and may create hard-to-anticipate upheavals
in the economy and financial assets when its consequences are clearer.
As for the universe of potential Bitcoin buyers, think about it this way; what countries have not defaulted on
their debts at some point, imposed exchange controls or confiscated assets? The non-defaulter list is a short
one3: just the countries in the table, and many have very high levels of Federal debt.
Crossover point is coming in the next decade                                                                              Country               National debt to GDP
% of GDP                                                                                                                  Singapore                             150%
24%                                                                                                                       United States                         128%
22%                                                                                                                       Canada                                114%
                           Revenues                              Entitlements, other
20%                                                              mandatory outlays &                                      Belgium                               113%
18%                                                              interest                                                 Finland                                83%
                                                                  Entitlements & other                                    Netherlands                            76%
16%                                                               mandatory outlays
14%                                                                                                                       Australia                              66%
                                                                                                                          Malaysia                               62%
12%
                                                                                                                          Norway                                 61%
10%
                                                                                                                          South Korea                            49%
 8%                                  Budget Control Act of 2011                                                           Denmark                                48%
 6%
                                                                                                                          Hong Kong                              46%
 4%                                                             Non-defense discretionary
                                                                                                                          Thailand                               45%
 2%                                                             spending
                                                                                                                          New Zealand                            43%
     '70 '75 '80 '85 '90 '95 '00 '05 '10 '15 '20 '25 '30                                                                  Taiwan                                 37%
Source: CBO, Budget and Econ Outlook, JPMAM. July 2021.                                                                   Source: Central government sources. 2020.

So, what about Bitcoin as a store of value complement to gold?
Some are skeptical about the ability of digital currencies to emerge as a viable store of value in just a few years
since it took thousands of years for gold to do so, and only after gold had been used for its intrinsic value for
centuries before that. I don’t agree; such logic is too rooted in the past and does not account for rapid
behavioral changes common in the post-war era. I accept the notion that a digital store of value could exist;
the proof statements I need are the following: (a) more and more people use it as such; (b) its volatility settles
into a range consistent with store of value investing; and (c) it goes up or remains stable when systemic risks
and/or inflation are rising. On (a), Bitcoin is beginning to capture a larger subset of store-of-value investments
when compared to the value of gold; that’s consistent with the crypto adoption trends cited on page 3.
Bitcoin vs gold market capitalization                                                            Bitcoin price
US$, trillions                                                                                   US$, thousands
$7.0                                                                                             $80
                                Bitcoin          Gold ex-jewelry
$6.0                                                                                             $70

                                                                                                 $60
$5.0
                                                                                                 $50
$4.0
                                                                                                 $40
$3.0
                                                                                                 $30
$2.0
                                                                                                 $20
$1.0                                                                                             $10

$0.0                                                                                              $0
       '10 '11 '12 '13 '14 '15 '16 '17 '18 '19                              '20    '21     '22      2017       2018      2019         2020           2021         2022
Source: TradingView, World Gold Council. February 2, 2022.                                       Source: Bloomberg, JPMAM. February 2, 2022.

3
    “This time is different: eight centuries of financial folly”, Carmen Reinhart and Ken Rogoff, 2009
                                                                                                                                                                             5
EYE ON THE MARKET • MICHAEL CEMBALEST • J.P. MORGAN
Ac c e s s o u r f u l l c o r o n a v i r u s a n a l y s i s w e b p o r t a l h e r e                                                                    Fe b r u a r y 3 , 2 0 2 2

The problem is that (b) and (c) do not support the Bitcoin “store of value” thesis, as illustrated below. Bitcoin’s
volatility continues to be ridiculously high, and its volatility often rises when equity market volatility is rising too.
Just as importantly, I don’t have a valuation model to apply to Bitcoin or other cryptocurrencies and I’m
unconvinced by ones I have seen so far. Metcalfe’s Law, for example, states that the value of a network
increases with the square of the number of users or nodes. This has proven to be a useful tool in assessing
valuation differences across crypto-currencies at a point in time, but less useful in assessing or predicting
absolute price levels (i.e., is Bitcoin cheap or expensive at $50k)? For investors other than crypto hedge funds,
crypto price levels are usually more important than relative crypto prices. Goldman Sachs has done interesting
work on Metcalfe’s law and relative crypto valuations, shown below in the fourth chart4.
Bitcoin volatility vs S&P 500, gold and US dollar                                                 Gold vs Bitcoin drawdowns
Rolling 3-month daily volatility, annualized                                                      %, decline from prior peak
150%                                                                                                    0%
                    Bitcoin
                    S&P 500 Index                                                                     -10%
125%                Gold                                                                              -20%
                    US dollar
100%                                                                                                  -30%
                                                                                                      -40%
                                                                                                                                                 Gold
    75%                                                                                               -50%
                                                                                                      -60%
    50%
                                                                                                      -70%
    25%                                                                                               -80%
                                                                                                      -90%
    0%                                                                                                                                                      Bitcoin
                                                                                                  -100%
      2015       2016       2017      2018       2019       2020       2021      2022
                                                                                                       1960      1970     1980      1990      2000               2010       2020
Source: Bloomberg, JPMAM. January 25, 2022.                                                       Source: Bloomberg, JPMAM. January 24, 2022.

S&P 500 vs Bitcoin drawdowns                                                                          Metcalfe's Law: Valuation vs network size
%, decline from prior peak                                                                            US$, billions, crypto market cap (log)
     0%                                                                                               $1,000                                                          Bitcoin
                                                                                           Billions

    -10%                                                                                                                                                                Ethereum
    -20%                            S&P 500                                                             $100
    -30%                                                                                                                                         Ripple
                                                                                                                                    Cardano
    -40%
                                                                                                         $10               Ethereum
    -50%
                                                                                     Bitcoin                                Classic         Litecoin      Bitcoin Cash
    -60%
    -70%                                                                                                  $1                        Dash
                                                                                                                          Zcash
    -80%
    -90%                                                                                                  $0
-100%                                                                                                     100,000               1,000,000               10,000,000
     2011            2013          2015          2017         2019          2021                                              Active addresses (log)
Source: Bloomberg, JPMAM. January 25, 2022.                                                           Source: GS. July 2021. Excludes addresses w/ small balances as % of supply.

A prior version of this report indicated a very high level of bitcoin ownership concentration. The updated data
below from Glassnode show a less concentrated distribution:
Bitcoin ownership concentration
    Miners    Exchanges       >5k BTC                                         1k-5k BTC                 500-1k BTC
     10%          13%           13%                                              18%                        7%
100-500 BTC 50-100 BTC       10-50 BTC                                         1-10 BTC
EYE ON THE MARKET • MICHAEL CEMBALEST • J.P. MORGAN
Ac c e s s o u r f u l l c o r o n a v i r u s a n a l y s i s w e b p o r t a l h e r e                                                                Fe b r u a r y 3 , 2 0 2 2

Another partial driver of crypto volatility: the existence of “pump and dump” schemes, as identified in a 2021
paper from the University of Technology in Sydney and the Stockholm School of Economics5.
Main findings appear below. Such schemes and other activities that would be prohibited in regular securities
markets are by definition not illegal on decentralized blockchains.
       The authors identified 355 cases of pump and dump schemes within a six month period in 2018, generating
        trading volumes that were 10x-15x higher than normal
       The pump and dump schemes generated an average peak return of 65% (i.e., returns to the first seller after
        the distorted buying is completed)
       These schemes involved 23 million people across 2 exchanges and 197 different cryptocurrencies
  The frequency of pump and dump schemes in crypto dwarf the occurrence of such events in equity markets;
   a prior study found just 142 events across 11 years in equities
The charts below illustrate the connection between pump and dump schemes and Bitcoin’s price at the time,
and the average cumulative return experienced during a typical scheme over a 45 minute period.
Bitcoin pumps vs price                                                                             Pump returns vs bitcoin price
Number of pumps per day                                                 US$, thousands             Pump returns                                                US$, thousands
    7                                                                                    $11.5       110%                                                                   $11.5
                                          Number of pumps
                                                                                         $11.0   Thousands
                                                                                                     100%                                                                   $11.0
    6
                                                                                         $10.5           90%                                                                $10.5
    5                                                              Bitcoin price                                                                    Bitcoin price
                                                                                         $10.0           80%                                                                $10.0
    4                                                                                    $9.5            70%                                                                $9.5

                                                                                         $9.0            60%                                                                $9.0
    3
                                                                                         $8.5            50%                                                                $8.5
    2                                                                                                    40%                                                                $8.0
                                                                                         $8.0
                                                                                                                       Pump returns
    1                                                                                                    30%                                                                $7.5
                                                                                         $7.5
                                                                                                         20%                                                                $7.0
  0                                                                                      $7.0
 Feb '18           Mar '18           Apr '18                              May '18
                                                                                                             Feb '18      Mar '18         Apr '18             May '18
Source: Dhawan and Putnins (UTS). November 2021.                                                     Source: Dhawan and Putnins (UTS). November 2021.

Cumulative return by time, synchronized by pump signal
Percent
    50%

    40%

    30%

    20%

    10%

    0%

-10%
          -15   -10   -5    0      5     10     15     20     25     30     35      40     45
                             Minutes from pump signal
 Source: Dhawan and Putnins (UTS). November 2021.

5
  “A new wolf in town? Pump-and-dump manipulation in cryptocurrency markets”, Anirudh Dhawan (Sydney)
and Talis Putniņs (Stockholm), November 2021
                                                                                                                                                                                7
EYE ON THE MARKET • MICHAEL CEMBALEST • J.P. MORGAN
Ac c e s s o u r f u l l c o r o n a v i r u s a n a l y s i s w e b p o r t a l h e r e                                               Fe b r u a r y 3 , 2 0 2 2

In addition to pump and dump schemes, there are other issues that can also affect crypto price volatility6:
      Miners attacking exchanges. Smaller blockchains can be attacked by their own miners in what is known as
      reorganization attacks or “51 percent attacks” and if they are not paid, they can roll back prior transactions
      (2021 Verge example in which 200 days of transactions were invalidated). Ethereum Classic and Bitcoin
      Gold have been attacked as well
      Front-running by miners (“miner-extracted value”, or MEV) in which value is essentially confiscated from
      other blockchain participants. Most MEV has reportedly occurred on the Ethereum network, and is
      considered by researchers to be endemic to blockchains
      Cartel risks. Proof-of-Stake protocols, which is what Ethereum will be switching to (more on that later), can
      be subject to “validator cartels” in which consolidation of power allows validators to decide what
      transactions will be confirmed or not
      Frequent inflation bugs which mint new coins before they’re supposed to (Bitcoin, Bitcoin Private, Stellar)
      Regulatory risks affecting prices. Uniswap, Synthetix and Compound are effectively pseudo-equities since
      they provide token holders with claims on future cash flows generated on DeFi protocols. These are not
      registered as securities even though they sure act like them (see box below). Stay tuned…
      News stories on hacking/theft. Bitcoin cannot be destroyed and will survive as long as the network does.
      But that doesn’t mean that your Bitcoin cannot be stolen. The techniques used include “cryptocurrency
      account takeovers”, SIM swapping, an SMS relay service, malware that stores keystokes, etc. Just last night,
      a blockchain bridge between Ethereum and Solana was hacked with $326 million in Ethereum stolen
      according to Bloomberg and CNBC reports
However, these might be considered “first world problems” by citizens in emerging countries with poor
governance. As shown below, the world governance curve is a steep one: very large shares of the world’s
population live in countries rife with corruption, capital controls and/or compromised rule of law, and where
cryptocurrency might be appealing either as a store of value or as a medium of exchange (a topic we address
next) given conditions they’re faced with.
Most of the world's population lives in countries with poor                                  On pseudo-equity tokens
governance, Governance composite score (100 = strongest)                                     “As the time of writing, the aggregate market cap of
90                                                                                           tokens in the decentralized finance space is $85 billion,
       Governance composite:
80     Corruption, capital controls and                                                      with Uniswap, Synthetix, and Compound the largest
70     rule of law                                                                           pseudo-equity tokens. Many of these DeFi tokens endow
                                                                                             token holders with some rudimentary governance rights
60
                                                                                             as well as either implicit or direct claims on cash flows
50                                                                                           generated through DeFi protocols. None of these
40                                                                                           pseudo-equity tokens backstopping DeFi are registered
30                                                                                           as securities, circulating instead on decentralized
                                                                                             financial infrastructure like Uniswap (and in some cases,
20
     0%            20%              40%              60%              80%             100%   on centralized crypto exchanges). If securities regulators
                      Cumulative share of world population                                   deemed such pseudo-equity tokens to be unregistered
Source: World Economic Forum, Cato, Fraser Institute, JPMAM. 2020.                           securities and pursued not only their issuers and
                                                                                             promoters but also the venues upon which they trade,
                                                                                             the financing and governance model of these DeFi
                                                                                             projects would be significantly impaired”. Source: Jeng
                                                                                             (footnote 8), page 30

6
    “DeFi Protocol Risks: the Paradox of DeFi”, Linda Jeng, Georgetown University Law Center, August 6, 2021
                                                                                                                                                               8
EYE ON THE MARKET • MICHAEL CEMBALEST • J.P. MORGAN
Ac c e s s o u r f u l l c o r o n a v i r u s a n a l y s i s w e b p o r t a l h e r e                                                       Fe b r u a r y 3 , 2 0 2 2

What about Bitcoin as a medium of exchange?
Bitcoin is currently not a medium of exchange other than in a few niche cases. The declining number of Bitcoin
transactions per day and the spikes in execution costs bear no resemblance to any functioning fiat currency. As
a result, a Bitcoin valuation thesis based on it being used as a medium of exchange makes little sense, at least
as Bitcoin exists right now. In a forthcoming article in Quantitative Finance, Nassim Taleb at NYU argues that
transactions in Bitcoin can be more expensive to execute than those done using African mobile phones7. Some
analysts also note that Bitcoin uses a “secure hash” algorithm which is more than twenty years old, one which
the US Department of Defense and firms like Microsoft found to be too weak for cyber-protection,
decommissioning its use in the early 2010s8.
It has been twelve years since Bitcoin was created, and Taleb states that there are few prices fixed in Bitcoin
other than the 3 Bitcoin cost of a permanent residence in El Salvador. “Prices fixed in Bitcoin” means
something different than “merchants who accept Bitcoin”. While the latter is rising, the merchant’s Bitcoin
price simply adjusts to reflect the price of the goods or services in fiat currency terms, and most merchants
quickly hedge their Bitcoin exposure. As a result, merchant acceptance tells us nothing about the viability of an
ecosystem whose wages, prices and assets are denominated in Bitcoin. The only items that appear to be priced
in Bitcoin or linked directly to it are….other cryptocurrencies.
One last point. Layer-2 improvements refer to upgrades and applications which reduce cost and latency on
blockchains. Even if such improvements occurred on the Bitcoin blockchain, unless Bitcoin’s volatility collapses,
its medium of exchange usage will continue to be very low.
Bitcoin transactions per day                                                                Bitcoin transaction volume vs fees
Confirmed transactions, thousands                                                           Thousands                                                               US$
450                                                                                         450                                                                       $60
400                                                                                         400
                                                                                                                                                                      $50
350                                                                                         350
300                                                                                         300                                                                       $40
                                                                                                         Confirmed
250                                                                                         250         transactions
                                                                                                                                                                      $30
200                                                                                         200
150                                                                                         150                                            Avg fee per                $20
100                                                                                         100                                            transaction
                                                                                                                                                                      $10
    50                                                                                       50
     0                                                                                        0                                                                       $0
      2010       2012          2014          2016         2018          2020         2022      2010      2012      2014      2016       2018       2020        2022
 Source: Blockchain.com. January 22, 2022.                                                  Source: Blockchain.com. January 22, 2022.

7
  “Bitcoin, Currencies, and Fragility”, Nassim Nicholas Taleb (NYU), July 4, 2021
8
  “Bitcoin’s social cost and regulatory responses”, Bindseil et al, ECB, January 2022
                                                                                                                                                                       9
EYE ON THE MARKET • MICHAEL CEMBALEST • J.P. MORGAN
Ac c e s s o u r f u l l c o r o n a v i r u s a n a l y s i s w e b p o r t a l h e r e                                                       Fe b r u a r y 3 , 2 0 2 2

Some comments on gold as an inflation hedge, or as some other hedge
While we’re talking about Bitcoin and gold, remember that gold hasn’t been a reliable inflation hedge either for
over a century. As shown in the first chart, from the year 1790 to 1900 gold worked very well as an inflation
hedge: the real price of gold (i.e., gold prices adjusted for inflation) was very stable. However, since the year
1900 and in particular after the end of the gold standard, real gold prices have gyrated all over the place,
indicating that it was a poor inflation hedge. Gold doesn’t work well as a currency hedge either; changes in
Emerging Market Central Bank gold reserves may actually be a better determinant of gold prices9. If gold
appears to be a hedge for anything, it’s the fear of inflation, or the fear of financial instability as proxied by
changes in government deficits (see third chart).
Real price of gold since 1790                                                                    Real price of gold since the advent of US futures trading
Ratio, Gold price / US Consumer Price Index                                                      Ratio, Gold price / US Consumer Price Index
9x                                                                                               9x

8x                                                                                               8x

7x                                                                                               7x

6x                                                                                               6x

5x                                                                                               5x

4x                                                                                               4x

3x                                                                                               3x

2x                                                                                               2x

1x                                                                                               1x
 1790 1815 1840 1865 1890 1915 1940 1965                                   1990     2015          1970 1975 1980 1985 1990 1995 2000 2005 2010 2015 2020
Source: Bloomberg, NBER, JPMAM. December 2021.                                                   Source: Bloomberg, JPMAM. December 2021.

Gold prices vs developed markets deficit
$/oz                                         % of GDP, trailing 4-quarter average
$2,500                                                                                     14%
                                                             G10 countries
                                                              fiscal deficit               12%
$2,000
                                                                                           10%
$1,500                                                                                     8%

$1,000                                                                                     6%
                                    Gold spot price
                                                                                           4%
    $500
                                                                                           2%

       $0                                                                                  0%
        1970          1980          1990          2000           2010          2020
Source: Bloomberg, central government sources, JPMAM. February 2, 2022.

9
    “The Golden Dilemma”, Claude Erb and Campbell Harvey (Duke/NBER), May 2013.
                                                                                                                                                                     10
EYE ON THE MARKET • MICHAEL CEMBALEST • J.P. MORGAN
Ac c e s s o u r f u l l c o r o n a v i r u s a n a l y s i s w e b p o r t a l h e r e                                                        Fe b r u a r y 3 , 2 0 2 2

[4] Cross-border remittances
Cross-border remittances have ranged from $500 to $600 billion per year over the last decade. The largest
recipient countries appear below. Currently, most remittances are made via wire transfer or bank transfer. The
CEO of Moneygram estimates that only 1% of remittances are now sent via crypto10, although other estimates
are higher. The third chart shows the declining cost of cross border remittances through traditional networks,
where remittance-weighted costs have fallen to around 5%.
Will families sending remittances start using crypto instead to save money? Perhaps, but recipients would
need bank accounts in the destination country to be able to convert from crypto to cash. The second chart also
shows the share of people with bank accounts, last estimated by the World Bank in 2017 (they are likely higher
now). For people with bank accounts, off-ramp costs from crypto to fiat are equal to the cost of converting from
dollar-based stablecoins (see next page) to local currency, and then any cost of withdrawing that fiat. The table
below shows rough estimates of these costs from industry sources for a few high remittance countries. Even if
these estimates are low, current remittance costs appear to be much higher.
Bottom line: the use of stablecoins for cross-border remittances is negligible now but seems set to rise (in
countries that allow them) by those with bank accounts given frequently higher costs of traditional channels.
This view is augmented by the fact that remittance senders tend to own crypto at a higher rate than the general
population11. To be clear, this would be deflationary for remittance companies like Western Union12, and not
much a driver of rising crypto valuations given the use of stablecoins in this use case (see box on page 13).
World personal remittances received                                                        Personal remittances and bank account ownership
US$, billions                                                                              US$, billions (with share of people with bank accounts)
$700                                                                                       $90

$650                                                                                       $80

                                                                                                   DOMINICAN REPUBLIC, 56%
                                                                                           $70
$600
                                                                                           $60

                                                                                                   SOUTH KOREA, 95%
$550
                                                                                                   BANGLADESH, 50%

                                                                                           $50

                                                                                                   UZBEKISTAN, 37%
                                                                                                   GUATEMALA, 44%
                                                                                                   PHILIPPINES, 35%

                                                                                                   INDONESIA, 49%

                                                                                                   SRI LANKA, 74%
                                                                                                   MOROCCO, 29%
                                                                                                   GERMANY, 99%
                                                                                                   PAKISTAN, 21%

                                                                                                   THAILAND, 82%
$500

                                                                                                   ROMANIA, 58%
                                                                                           $40
                                                                                                   BELGIUM, 99%
                                                                                                   UKRAINE, 63%
                                                                                                   VIETNAM, 31%
                                                                                                   NIGERIA, 40%
                                                                                                   FRANCE, 94%
                                                                                                   MEXICO, 37%

                                                                                                   RUSSIA, 76%
                                                                                                   EGYPT, 33%

                                                                                                   NEPAL, 45%
                                                                                                   CHINA, 80%

                                                                                                   ITALY, 94%
                                                                                           $30
                                                                                                   INDIA, 80%

$450
                                                                                           $20
$400
                                                                                           $10
$350
    2008      2010     2012              2014        2016        2018        2020           $0
Source: World Bank. 2020.                                                                  Source: World Bank, JPMAM. 2020.

Global remittance costs
% of remittance amount
10%
                                                                                           Select stablecoin off-ramp costs to fiat
 9%                                                                                                      Transaction Withdrawal Total
                                                                                                                                      Source
 8%
                                                                                                             fee         fee     fee
                                                                 Global average            India             0.2%             0.0%        0.2% CoinDCX
 7%
                                                                                           S Africa          0.2%             0.0%        0.2% Luno
 6%
                                                                                           Mexico            0.1%             0.0%        0.1% Bitso
 5%                         Global weighted average
                      (weighted by size of remittance flows)                               Brazil            0.7%             0.0%        0.7% Mercado Bitcoin
 4%
   2009          2011        2013        2015        2017        2019        2021
                                                                                           Philippines       0.5%             1.6%        2.1% PDAX
Source: World Bank. Q2 2021.                                                               Source: JPMAM. February 2022.

10
   “Great Expectations of Crypto for Cross-Border Payments”, Alex Holmes (MoneyGram), September 14, 2021
11
   PYMNTS Cross Border Remittance Report, September 2021
12
   See Atlanta Federal Reserve Bank payments risk analyst comments in “A Mexican Crypto Startup Wants to
Make Cash Remittances Cheaper”, Bloomberg Business Week, November 30, 2021
                                                                                                                                                                      11
EYE ON THE MARKET • MICHAEL CEMBALEST • J.P. MORGAN
Ac c e s s o u r f u l l c o r o n a v i r u s a n a l y s i s w e b p o r t a l h e r e                                                     Fe b r u a r y 3 , 2 0 2 2

For remittance receivers without bank accounts, crypto execution costs can be much higher even when they
are possible at all via Bitcoin->fiat ATMs. According to Coin ATM Radar, there are only 2 such ATMs in all of
India, 11 in Mexico and 13 in the Philippines. Most Bitcoin->fiat ATMs charge around 5% to convert Bitcoin into
fiat currency (and around 10% to convert fiat into Bitcoin). As a result, the current remittance use case for
crypto relies on bank account ownership, which in many EM countries is rising.
What might change? Moneygram announced that it’s working on a project with Bitcoin ATM operators to offer
Bitcoin->fiat conversions at 4% which could be used by those without bank accounts, and a partnership with the
Stellar Development Foundation to allow users to convert from stablecoins to cash and back.
Understanding Stablecoins
Stablecoins are a way to gain access to blockchain protocols without taking on crypto price risk. Stablecoins are
linked to a reserve of external assets, and in most cases, the entity developing the stablecoin owns reserves
equal to the number of stablecoins in circulation. As a result, they should generally be redeemable close to par.
There are questions about the reliability of certain stablecoin reserves; some remind me of SIVs from 200813.
But if stablecoin risks can be controlled, they could be used for cross-border remittances and reduce volatility
that recipients are exposed to with traditional crypto. To reiterate, there are few implications in this use case
for most crypto prices (see box on next page). USD coin and Tether stablecoin prices are shown below. Note
that their price volatility has declined with higher participation.
Select stablecoin market capitalization                                                    USD Coin vs Tether stablecoin prices
US$, billions                                                                              Price
$180                                                                                       $1.08                                                   Tether
              Paxos
$160                                                                                       $1.06                                                   USD coin
              HUSD
$140          Binance USD                                                                  $1.04
$120          Dai                                                                          $1.02
              USD coin
$100                                                                                       $1.00
              Tether
 $80                                                                                       $0.98

 $60                                                                                       $0.96

 $40                                                                                       $0.94

 $20                                                                                       $0.92

  $0                                                                                       $0.90
   Jan '20        Jul '20       Jan '21       Jul '21                          Jan '22          2016      2017      2018      2019    2020       2021        2022
Source: CoinDesk, CoinMarketCap, JPMAM. February 3, 2022.                                  Source: CoinMarketCap. February 2, 2022.

Update: the US Federal Reserve issued a report in January 2022 on digital money and payment systems. The
Fed is debating the risks and benefits of creating a Fed-backed US$ stablecoin which would not entail any
liquidity or reserve risks, and which would provide a firmer foundation for innnovation in the digital payments
space than private stablecoins.

13
   Stablecoins are often described as being backed by “reserve assets.” However, there are no standards
regarding composition of stablecoin reserve assets, and information made publicly available is not consistent as
to content or frequency. Stablecoins differ in the riskiness of their reserve assets; some hold all reserve assets
in deposits at insured depository institutions or in US T-bills, and others holding riskier reserve assets such as
commercial paper, corporate and municipal bonds and other digital assets.
Example: Tether’s first published reserve breakdown showed 49% backing by “unspecified commercial paper”.
When Wells Fargo withdrew support for Tether in the spring of 2017 and its convertibility was temporarily
suspended, Tether traded as low as 92 cents on the dollar.
                                                                                                                                                                    12
EYE ON THE MARKET • MICHAEL CEMBALEST • J.P. MORGAN
Ac c e s s o u r f u l l c o r o n a v i r u s a n a l y s i s w e b p o r t a l h e r e                Fe b r u a r y 3 , 2 0 2 2

     Will stablecoin access fees be a material source of income for Ethereum and other token holders?
     As stated above, stablecoins are generally backed 100% by liquid reserves and therefore do not result in
     any speculation on their prices. The larger centralized stablecoins such as USDC are not their own
     blockchains but instead are tokens that are created on multiple chains. Stablecoin users have to pay for
     blockchain ledger verification via “gas” access fees (see page 17) paid to that network. Some argue that
     such gas fees will be a material part of the value proposition for host network cryptos like Ethereum
     when/if such fees are distributed to token holders. However, stablecoin users are likely to migrate to the
     cheapest blockchain protocols such as Solana or Polygon. Gas fees are also dependent on computational
     complexity; stablecoin transfers are very low complexity compared to swaps, NFTs and DeFi. As a result,
     stablecoin use looks like a rather weak valuation pillar for cryptocurrency.

Some unanswered remittance questions
The Ripple effect. Ripple reported fivefold growth in remittance transactions between 2019 and 2020. But if
that’s the case, why is Ripple still trading so closely with Bitcoin, as shown below? Wouldn’t Ripple’s separate
and distinct use case result in a separate and distinct return profile from Bitcoin? It hasn’t so far. From what
we can tell, Ripple has been working with banks to help them build infrastructure to make cross-border
payments but few are using Ripple’s actual cryptocurrency to execute them.
Bitcoin vs Ripple price
US$, thousands                                                                             US$
$70                                                                                        $2.0
                                                                                           $1.8
$60
                                                                                           $1.6
$50                                                                                        $1.4
                               Bitcoin
$40                                                                                        $1.2
                                                                                           $1.0
$30                                                                                        $0.8
$20                                                                                        $0.6
                                                                         Ripple            $0.4
$10
                                                                                           $0.2
 $0                                                                                        $0.0
  Jan '20       Jul '20      Jan '21                       Jul '21            Jan '22
Source: Bloomberg, JPMAM. February 2, 2022.

Government regulations. There are increasing calls for stablecoin regulations in the US according to the Bank
Policy Institute. And while the Mexican crypto company Bitso reports handling 2.5% of all remittances sent from
the US to Mexico, Mexican authorities have stated that crypto assets are not legal tender and are not considered
currencies under current laws, and that financial institutions operating with them are subject to sanctions14.
There’s a good chance that crypto remittances will eventually be subject to “travel rule” regulations that require
identification of sources and destinations of funds to ensure monitoring for money laundering and sanctions.
See Appendix A for the latest on government crypto regulations.
The Silvergate nexus. What systemic risks are posed by Silvergate, a San Diego bank with $5.5 billion in assets
and $5.0 billion in crypto deposits (Q4 2020)? Silvergate has emerged as a key nexus connecting traditional
banks and the digital currency industry. While a small number of mature crypto firms have relationships with
the largest banks, most crypto firms rely on Silvergate and other small community banks to settle the US$ fiat
leg of crypto-fiat trades15.

14
   “Mexico says cryptocurrencies are not money, warns of risk”, Reuters, June 28, 2021
15
   “DeFi Protocol Risks: the Paradox of DeFi”, Linda Jeng, Georgetown University Law Center, August 6, 2021
                                                                                                                              13
EYE ON THE MARKET • MICHAEL CEMBALEST • J.P. MORGAN
Ac c e s s o u r f u l l c o r o n a v i r u s a n a l y s i s w e b p o r t a l h e r e                                                Fe b r u a r y 3 , 2 0 2 2

[5] Decentralized Finance
Decentralized Finance (DeFi) refers to activities that disintermediate financial services by migrating them to
permission-less blockchains. Its advocates typically see the financial system as rife with inefficiencies, bloated
costs and structural inequalities that DeFi can exploit. To be clear, disintermediation of banks is happening on
multiple fronts. The non-bank share of US mortgage originations continues to rise, and as shown in the second
chart, payment firms and fintech firms continue to take market share away from banks. Paypal’s market cap is
greater than Goldman Sachs, Morgan Stanley, Citigroup and Amex, and Stripe’s latest pre-IPO valuation is over
$100 billion. But the ability of crypto-based blockchains to displace banking activities is a little more
complicated, as this section will review.
Nonbank share of mortgage originations                                                     Top 500 global banks, payment and fintech firms
70%                                                                                        % of market cap
                                                                                           100%
                                                                                                                                               Fintechs
60%                                                                                         90%                                            Payment firms
                                                                                            80%
50%
                                                                                            70%                                                  Banks
40%                                                                                         60%
                                                                                            50%
30%
                                                                                            40%
20%                                                                                         30%
                                                                                            20%
10%
                                                                                            10%
 0%                                                                                          0%
   2005 2007 2009 2011 2013 2015 2017                                  2019     2021           2010 2011 2012 2013 2014 2015 2016 2017 2018 2019 2020
Source: Inside Mortgage Finance, WSJ. June 2021.                                           Source: The Economist. October 7, 2020.

Around two thirds of DeFi activity currently takes place on the Ethereum network given its ability to host “smart
contracts” which encode terms and conditions that are executed on it (the next chart shows the number of
smart contracts executed). Ethereum trades not only as a store of value, but also as a token whose value is
influenced by the number of people using that blockchain. This highlights an important difference vs Bitcoin:
once Ethereum completes the migration from Proof of Work to Proof of Stake (see box and page 17), Ethereum
token holders will have the opportunity to participate in “staking” (ledger verification) activities which could
provide them with a yield on their tokens, as well as possibly sharing in network access “gas” fees. This income
component is the key investment thesis behind many investments in crypto projects on programmable public
blockchains using Proof of Stake ledger verification. Such projects often involve efforts to perform instant
settlement, freeing up working capital and reducing back office costs.
Ethereum daily verified contracts
Total verified contracts per day, 7 day avg                                                  Proof of Work vs Proof of Stake
350                                                                                          Blockchains require ledger verification by “validators” who
300                                                                                          are paid in that blockchain’s native token to do so. Proof
                                                                                             of Work involves crypto miners competing to perform
250
                                                                                             ledger verification using energy-intensive computers to
200                                                                                          solve complex mathematical puzzles.         Proof of Stake
150
                                                                                             involves validators simply being selected to perform ledger
                                                                                             verification. On the Ethereum blockchain, the selection
100                                                                                          process will be random but also influenced by the number
 50                                                                                          of tokens owned, leading to centralization of ledger
                                                                                             verification activity. Proof of Stake is considered both
   0
    2016        2017         2018         2019         2020         2021        2022         faster and more scalable than Proof of Work.
Source: Etherscan, JPMAM. February 1, 2022.

                                                                                                                                                              14
EYE ON THE MARKET • MICHAEL CEMBALEST • J.P. MORGAN
Ac c e s s o u r f u l l c o r o n a v i r u s a n a l y s i s w e b p o r t a l h e r e                                                     Fe b r u a r y 3 , 2 0 2 2

Currently there’s around $100 billion “locked up” in DeFi activities. This refers to the amount of crypto
collateral deposited in DeFi applications; this measure is imperfect due to double-counting and leverage. While
some high yields have been offered by some DeFi lending platforms with temporary incentives16, CryptoVantage
and Coinbase quote current unleveraged DeFi lending yields at 4%-5%. Analysts at Goldman Sachs were able to
dig through some complex online data and derive similar borrowing and lending rates for stablecoins on the
Aave platform17. Once more participants joined in the summer of 2021, Aave’s rates declined. The largest DeFi
protocols (Aave, Uniswap, SushiSwap and Compound) earned over $2 billion in user fees and spreads in 2021.
Aave DeFi protocol lending and borrowing rates for
                                                                                                 DeFi in the News: $100 mm proposed fine on
stablecoins, Rate weighted by total value locked
35%                                                                                              blockchain lender BlockFi (February 2022)
                                                          Borrowing rate
30%
                                                                                                 BlockFi is reportedly set to pay a $100 million fine to
                                                          Lending rate
                                                                                                 settle SEC allegations that the crypto lending firm
25%                                                                                              illegally offered products to crypto owners promising
20%                                                                                              high interest rates. The SEC is probing whether such
                                                                                                 accounts are securities that should be registered with
15%
                                                                                                 regulators. SEC Chair Gensler has argued that some
10%                                                                                              crypto firms are offering financial services without
                                                                                                 adhering to investor-protection rules that banks,
 5%
                                                                                                 brokers and other entities have to comply with.
 0%
  Dec '20     Feb '21     Apr '21    Jun '21                   Aug '21        Oct '21
Source: Aave, The Graph, GS. October 22, 2021.

Yes, but what kind of lending is actually taking place here? From what we can tell, most DeFi lending is simply
over-collateralized crypto loans to other holders of crypto so that the latter can either (a) buy more crypto, or
(b) obtain liquidity against appreciated crypto holdings without incurring capital gains taxes. Either way, it does
not appear to be the kind of lending activity that could survive a large sustained decline in crypto prices
themselves. As shown below, there’s a close connection between the total value of DeFi lending and
Ethereum’s price. Like Ripple vs Bitcoin, so many things in the crypto world are correlated to each other.
Total value locked in DeFi vs Ethereum prices
US$, billions                                                                              US$
$120                                                                                  $5,000
                      Total value locked in DeFi (lhs)
                                                                                      $4,500
$100                  Ethereum price (rhs)
                                                                                      $4,000
                                                                                      $3,500
 $80
                                                                                      $3,000
 $60                                                                                  $2,500
                                                                                      $2,000
 $40
                                                                                      $1,500
                                                                                      $1,000
 $20
                                                                                      $500
  $0                                                                                  $0
    2018          2019           2020                      2021             2022
Source: DeFi Pulse. January 25, 2022.

16
   DeFi protocols can become an overnight success by offering temporary incentives that are way above market.
One example is SushiSwap, whose lending balances rose from a few thousand dollars to one billion dollars
almost overnight in September 2020.
17
   “Opportunities and Risks in Decentralized Finance”, Zach Pandl and Isabella Rosenberg, Goldman Sachs
Economics Resarch, October 22, 2021
                                                                                                                                                                   15
EYE ON THE MARKET • MICHAEL CEMBALEST • J.P. MORGAN
Ac c e s s o u r f u l l c o r o n a v i r u s a n a l y s i s w e b p o r t a l h e r e                     Fe b r u a r y 3 , 2 0 2 2

Collateralized lending on blockchains cannot eliminate the presence of bad actors or bad data. Some of its
characteristics might terrify participants in traditional collateralized lending pools:
        Crypto collateral may not be dedicated and assigned solely to the activity against which it is posted. In
         other words, crypto collateral can be “rehypothecated” to back multiple activities18. If you don’t remember
         what that word means, type “rehypothecation” into Google along with the words “financial crisis”
        Unreliable valuations of crypto assets posted as collateral. Some protocols do not restrict the kind of crypto
         assets that can be used as collateral. While a lot of collateral is stablecoins, some is not. There were 50,000
         distinct crypto assets accepted as collateral in DeFi applications last July. Coin Metrics concedes that pricing
         data in DeFi liquidity pools on certain assets can be “manipulated and ultimately undermine value
         measurements”, and that “it is possible to use on-chain exchanges to estimate their current price, but
         there’s no guarantee that they are traded with enough frequency to give accurate prices”19
        DeFi markets are NOT trustless. Participants in DeFi markets inherently trust the programmers of the
         protocols they engage with, and other protocols linked to those protocols. In other words, seemingly
         distant protocols can cause problems such as fraud. DeFi fraud exceeded $10.5 billion in 2021, up
         from $1.5 billion in 2020 20. Main DeFi vulnerabilities are (a) programming design errors that hackers
         exploit, and (b) theft from DeFi founders and developers who turned out to be crypto -criminals. As
         much as you might try, you cannot prevent humans from defrauding and stealing from each other,
         even on the blockchain. There’s also no DeFi-FDIC.
Distinct assets used as collateral in DeFi
Thousands of assets
50
45
40
35
30
25
20
15
                                                             Includes data from
10                                                        Uniswap, Sushiswap,
     5                                                 Curve, Aave, Compound,
                                                                     and Maker
    0
    Jan '20    Apr '20      Jul '20      Oct '20      Jan '21       Apr '21      Jul '21
Source: Coinmetrics. July 2021.

Smart contracts may eliminate the need for lawyers, banks, brokers and exchanges involved in traditional
finance. However, some smart contracts will still depend on external data sources to function. For example: if
a smart contract is a derivative that depends on the price of an underlying asset, the smart contract might have
to pull that from a Bloomberg feed or some other live source. This has led to “oracle attacks” in which bad
actors attempt to influence a reference price to create riskless arbitrage or trigger liquidations.

18
     “Rehypothecation: the myth of locked collateral”, Coin Metrics, July 2, 2021
19
  “Collateral type variety: the myth of Value”, Coin Metrics, July 27, 2021
20
  “Decentralized Finance Fraud in 2021 Is Up 600% Over 2020, Topping $10.5 Billion, Research Finds”, The
Ascent.com, November 25, 2021
                                                                                                                                   16
EYE ON THE MARKET • MICHAEL CEMBALEST • J.P. MORGAN
Ac c e s s o u r f u l l c o r o n a v i r u s a n a l y s i s w e b p o r t a l h e r e                                                     Fe b r u a r y 3 , 2 0 2 2

What’s next for Ethereum and other programmable public blockchains?
The Ethereum network can be an expensive place to transact, and Ethereum doesn’t communicate well with
other blockchains. The first chart below shows the transaction “gas” fees that users pay to access the network.
Since the beginning of 2021, Ethereum’s competitors have been gaining ground as shown in the second chart.
Ethereum average daily transaction costs                                                   Ethereum vs Ethereum competitors market cap
Gwei (1 ETH token = 1 billion gwei)                                                        US$, billions
400                                                                                        $500
                                              Transaction costs (known as "gas"                      Ethereum      Ethereum competitors
                                                                                           $450
350                                           fees) are paid when an ETH token
                                            is purchased or sold to compensate             $400
300                                              miners for computational power            $350
250                                                                                        $300
200                                                                                        $250
                                                                                           $200
150
                                                                                           $150
100                                                                                        $100
 50                                                                                         $50

     0                                                                                       $0
     Feb '21   Apr '21      Jun '21      Aug '21      Oct '21     Dec '21      Feb '22            Q1 2020Q2 2020Q3 2020Q4 2020Q1 2021Q2 2021Q3 2021Q4 2021

Source: ycharts.com. February 1, 2022.                                                     Source: CoinMarketCap.com, J.P. Morgan. January 7, 2022.

Why might some Ethereum competitors be thriving21? Financial ledger applications and related protocols are
slow; see transaction processing speeds in the table. Some of Ethereum’s competitors aim to improve upon it,
such as Solana whose developers claim 50,000 transactions per second. Other competitors like Cardano aim to
be more scalable, while Pokadot aims to be more interoperable. There’s an endless list of others, including
Avalanche, Hedera and Algorand. Like anything else in the venture capital world, only a few will survive; figuring
out the likely winners early on could be a very rewarding endeavor.
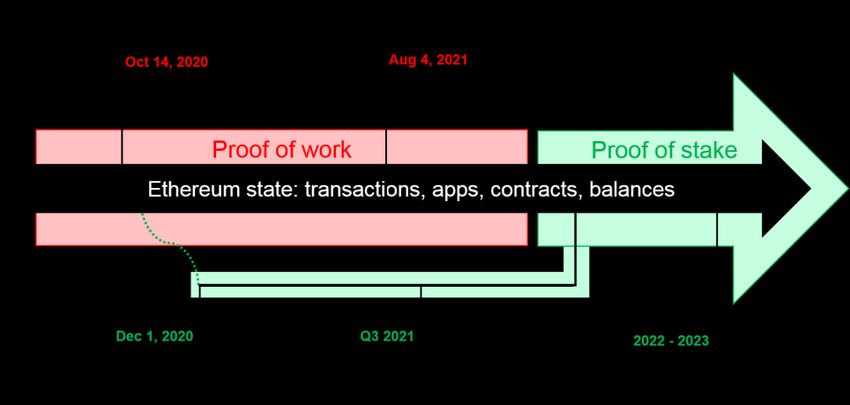
The Ethereum upgrade scheduled for 2022 entails a shift from Proof-of-Work to Proof-of-Stake and should
improve its scalability, speed, cost and energy efficiency. The image below illustrates how this transition may
occur. Some contacts tell us they are already experiencing 100x-1000x improvements in transaction costs and
latency from something called “zero knowledge proof” Layer-2 offerings on the Ethereum blockchain. One
apparent pre-requisite for blockchain professionals: use as much obtuse jargon as possible.
Processing speeds of financial
infrastructures
              Transactions per
Currency
                  second
Bitcoin               7
Ethereum             15
Paypal             56,000
VISA               45,000
Ripple             1,500
EOS                8,000
Source: Zorba et al (Hacettepe
University). November 2020.

21
  For more on Ethereum competitors see pages 24-30 in “Cryptocurrency Markets: Crypto-101 and the State of
the Crypto Markets”, JP Morgan North America Equity Research, Ken Worthington, January 7, 2022
                                                                                                                                                                   17
EYE ON THE MARKET • MICHAEL CEMBALEST • J.P. MORGAN
Ac c e s s o u r f u l l c o r o n a v i r u s a n a l y s i s w e b p o r t a l h e r e                                                     Fe b r u a r y 3 , 2 0 2 2

Many DeFi advocates anticipate a future world of peer-to-peer uncollateralized lending on blockchains,
allowing crypto holders to lend and cut out fees charged by banks for credit scoring, monitoring and payment.
Good luck with that. Fintech lending holds some clues since the industry uses AI tools to make uncollateralized
lending decisions, and that’s how peer-to-peer crypto lending applications might work as well. Recent data on
Fintech shows higher loan delinquency rates than traditional bank loans, mostly a function of weaker
underwriting standards. See Lending Club, whose stock has declined by 65% from its recent peak despite the
use of AI and machine learning credit models derived from 150 billion cells of data.
Remember: Fintech lenders have primarily been operating at a time of rising household incomes, lots of gov’t
stimulus and very low household delinquency rates. The real test will occur next time there’s a recession that
is unaccompanied by supplemental income payments, foreclosure moratoria and PPP loans. For an industry
whose primary competitive advantage is speed22 rather than access or cost, that’s the real test.
Fintech vs bank loan delinquency rate                                                      US 90+ days loan delinquency transition rates
4.0%                                                                                       6%                                                                       10%

                                                                                                                                                                          Hundreds
                                                                         Fintech loans                                                Auto loans (lhs)
3.5%
                                                                                           5%                                         Second mortgage (lhs)
3.0%                                                                                                                                                                8%
                                                                                                                                      First mortgage (lhs)
2.5%                                                                                       4%                                         Credit cards (rhs)
                                                                                                                                                                    6%
2.0%
                                                                                           3%
1.5%
                                                                            Bank loans                                                                              4%
1.0%                                                                                       2%
0.5%
                                                                                                                                                                    2%
0.0%                                                                                       1%
        0         2         4  6       8        10    12      14      16
                          Months since origination                                         0%                                                                       0%
Source: "Fintech Borrowers: Lax-Screening or Cream-Skimming", Di Maggio                      2004 2006 2008 2010 2012 2014 2016 2018 2020                    2022
(HBS) & Yao. 2020.                                                                         Source: S&P Dow Jones Indices, Experian. December 2021.

US home foreclosures                                                                       Operating Chinese peer-to-peer lending platforms
Thousands                                                                                  Number of operating platforms
600                                                                                        3,500

                                                                                           3,000
500
                                                                                           2,500
400
                                                                                           2,000
300                                                                                        1,500

200                                                                                        1,000

                                                                                             500
100
                                                                                               0
  0                                                                                             2010 2011 2012 2013 2014 2015 2016 2017 2018 2019 2020
   2003 2005 2007 2009 2011 2013 2015 2017 2019 2021                                       Source: "The Fall of Online P2P Lending in China", Huang and Wang (CUHK).
Source: Bloomberg, Federal Reserve. Q3 2021.                                               January 2021.

China is a reminder of how peer-to-peer lending manias can go off the rails. Chinese P2P lenders promised
returns of 8%-12% to depositors compared to 2.75% on 3 year bank deposits. High default rates and increased
regulation led to the demise of Chinese P2P lending platforms, which at their peak in 2017 were extending 2.8
trillion RMB in credit. Some platforms ended up absconding with the cash, and many had difficulty returning
money to lenders. By August 2020, Chinese retail investors had lost $115 billion on their P2P activities.

22
  Speed kills? In a survey by “buy now pay later” lender Klarna, 50% of users said that it’s too much trouble to
type in a bank account number or social security number to qualify for a loan (!!). Firms active on Alibaba’s
platform can fill out a credit application in 3 minutes, the approval takes 1 second and the process involves zero
human interaction. And from Square: “You’ll usually know if you’re approved right away!”
                                                                                                                                                                    18
EYE ON THE MARKET • MICHAEL CEMBALEST • J.P. MORGAN
Ac c e s s o u r f u l l c o r o n a v i r u s a n a l y s i s w e b p o r t a l h e r e                                                               Fe b r u a r y 3 , 2 0 2 2

[6] Non-fungible tokens and the art market
DeFi uses tokens that are fungible and divisible across users. Non-fungible, indivisible tokens (NFTs) are a type
of unique digital certificate that is registered on a blockchain to record ownership of any asset. They’re best
known for digital collectibles in art23 and music, and also in gaming. The appeal of NFTs include the ability of
artists to sell their work to buyers in a global market, and the ability to retain ownership rights over their own
works as well as resale and royalty rights. As you are all aware by now, the NFT art market exploded in 2021:
transaction volumes were reported to have hit $20 billion last year. That compares with a global art market
whose sales have fluctuated from $50 to $70 billion per year over the last decade.
2021 cumulative NFT art sales                                                                     Global art market sales
US$, billions                                                                                     US$, billions
$20                                                                                               $70
$18
                                                                                                  $60
$16
$14                                                                                               $50

$12                                                                                               $40
$10
                                                                                                  $30
 $8
 $6                                                                                               $20
 $4                                                                                               $10
 $2
                                                                                                   $0
 $0                                                                                                     2009 2010 2011 2012 2013 2014 2015 2016 2017 2018 2019 2020
  Jan-21      Mar-21    May-21    Jul-21                  Sep-21        Nov-21
Source: cointelegraph.com. November 2021.                                                         Source: Arts Economics. 2021.

Many of you will be tempted to dismiss the NFT market as a place of rampant and misguided speculation.
You may also look at works from top NFT sellers such as Mad Dog Jones, Pak and Beeple (now the third most
expensive living artist behind Koons and Hockney) and conclude that they barely qualify as art at all. Oddly
enough, I wouldn’t dismiss the NFT art phenomenon that quickly. For many centuries Romanesque, Gothic and
Baroque styles dominated the art scene among collectors. But look what happened in the twentieth century:
new art movements rose to prominence much more frequently, and many of these works retained substantial
value for decades after that. In other words, tastes and cultural preferences evolve more quickly now.
Art period timeline
                               Romanesque (100 - 1150)
                    Gothic
                                                                          Renaissance
                                                                               Mannerism
                                                                                                   Baroque
                                                                                                                    Rococo
                                                                                                                    Neoclassicism
                                                                                                                         Romanticism
                                                                                                                                    Realism
                                                                                                                               Pre-Raphaelite
                                                                                                                                  Impressionism
                                                                                                                                       Naturalism
                                                                                                                              Post-Impressionism
                                                                                                                                       Symbolism
                                                                                                                                     Expressionism
                                                                                                                                         Art Noveau
                                                                                                                                               Cubism
                                                                                                                                              Futurism
                                                                                                                                               Dadaism
                                                                                                                                        New Objectivity
                                                                                                                                           Precisionism
                                                                                                                                                Art Deco
                                                                                                                                                Bauhaus
                                                                                                                                              Surrealism
                                                                                                                                    Abstract Expressionism
                                                                                                                                                       Pop-Art
                                                                                                                                                   Arte Povera
                                                                                                                                                    Minimalism
                                                                                                                                                   Photorealism
                                                                                                                                      Lowbrow Pop Surrealism
                                                                                                                                                Contemporary Art
 1000             1100           1200                1300              1400                1500          1600          1700          1800          1900            2000
Source: Art in Context. September 2021.

23
  An NFT is only a marker to digital art. Given the limited capacity of a token on most public blockchains, an
NFT points to a location on the cloud where the actual art sits. If that cloud service failed, the NFT’s value could
be compromised.
                                                                                                                                                                             19
EYE ON THE MARKET • MICHAEL CEMBALEST • J.P. MORGAN
Ac c e s s o u r f u l l c o r o n a v i r u s a n a l y s i s w e b p o r t a l h e r e                                       Fe b r u a r y 3 , 2 0 2 2

I don’t really understand the appeal of digital art. Am I supposed to pester friends and family into looking at it
on my phone? However, I don’t get some of the most expensive physical art of the last half century either; I
find works by Cindy Sherman, Damien Hirst and Christopher Wool to be inaccessible and boring. And that’s the
point; just because you might not appreciate the artistic merit of Bored Ape Yacht Club NFTs, that doesn’t mean
others won’t. Between Feb 2020 and April 2021, the curated NFT art platform Nifty Gateway offered 145,000
works for sale, and sold 95% of them at an average price of $1,200.
The greater the interest in NFTs that reside on the Ethereum network, the more Ethereum tokens that NFT
purchasers have to acquire to own them. As a result, the NFT art and collectible market is a use case driving
some investors to accumulate Ethereum tokens. I’m just not sure how they get comfortable that the preferred
domicile for NFTs won’t change to some other blockchain venue in the future. There’s also the fact that NFTs
can now be bought and sold on normal payment rails via credit cards, which separates the notion of “on-
chain” data and digital assets (i.e., no need for Ethereum). OpenSea, which has 97% NFT market share, is
reportedly close to accepting fiat on their platform24.
One Achilles heel of the NFT market: just as Bitcoin ownership is highly concentrated, the same is true for the
NFT art market. A study of the SuperRare NFT art platform revealed that just four collectors owned most of its
works with only three degrees of separation between them and the 16,000 works of art they collected25. This
is a very high degree of insularity, even for standards of the art market. The study also found that the secondary
market was even more concentrated than the primary market. More evidence of NFT art concentration: an
analysis of transactions between April and September 2021 found that the top 17% of NFT art owners controlled
81% of them26. In the long run, concentration is rarely a good thing for investors.
To be clear, art is just a subset of the broader NFT market. The largest segment by value is a category called
“collectibles” which mostly refers to personal avatars, some of which are algorithmically generated. Examples
include CryptoPunks and Meebits that can be used in virtual reality environments. While it might seem strange
that young people are willing to invest so much money in virtual status symbols, prior generations certainly
spend a lot of money on physical status symbols of their own. The cost of women’s high-end handbags (i.e.,
Hermes Birkin bags27) is more disturbing to me than the price of a scarce virtual avatar. Gaming is described by
some as an important use case for NFTs, but I am frankly too exhausted at this point to go into more detail.
NFT market segmentation by value                                                           NFT sales by category                            Metaverse
                                                                                           Number of sales per week                         Game
                                                                                           50,000
                                                                                                                                            Art
                                                                                           45,000                                           Utility
                                                            Art                            40,000                                           Sports
                                                           14%
                                                                                           35,000                                           Collectible
                                                                  Sports                   30,000
                              Collectible                          7%                      25,000
                                 66%
                                                             Metaverse                     20,000
                                                                7%                         15,000
                                                                                           10,000
                                                                        Game                5,000
                                                                          5%
                                                                  Utility                       0
                                                                   1%                           Apr-21                May-21       Jun-21
Source: NonFungible.com. Q2 2021.                                                          Source: NonFungible.com. Q2 2021.

24
   “OpenSea confirms acquisition of Dharma, sets sights on fiat onramps”, Frank Chaparro, The Block, January
18, 2022; “How OpenSea Captured 97% Of The NFT Market”, Tim Fries, The Tokenist, November 11, 2021.
25
   “The art market often works in in secret. Here’s a look inside”, Albert-Laszlo Barabasi, NYT, May 7, 2021
26
   “An analysis of 7,020,950 NFT transactions on the Ethereum blockchain”, Moonstream, October 22, 2021
27
   Birkin bags can cost $40,000 or more, although some can be found on the resale market for between $12,000
and $18,000. A study released in 2017 found that these bags appreciated by 14% per year over the last 35 years
(Business Insider, June 30, 2021). Birkin bag supply is limited and controlled…just like many digital avatars.
                                                                                                                                                     20
You can also read