INFORMATION MEMORANDUM - CANE FARMS ACN 616 385 945
←
→
Page content transcription
If your browser does not render page correctly, please read the page content below

INFORMATION
MEMORANDUM

  AUSTRALIAN
  CANE FARMS
  LIMITED
  ACN 616 385 945

  A$10MILLION
  PRE-IPO
  CAPITAL RAISE

FEBRUARY 2017       Corporate Advisor :
                    Bridge Street Capital Partners
Table of Contents
Important Notice and Disclaimer ........................................................................................................... 4
Executive Summary ............................................................................................................................... 6
1.     Introduction ................................................................................................................................... 7
     1.1 Investment Opportunity .......................................................................................................................... 7
     1.2 Offer ......................................................................................................................................................... 7
     1.3 About Australian Cane Farms .................................................................................................................. 8
     1.4. Investment Highlights ............................................................................................................................. 8
2.     Australian Cane Farms Limited ..................................................................................................... 12
     2.1 Growth of ACF........................................................................................................................................ 12
     2.2 Investment Strategy............................................................................................................................... 12
     2.3 Farming Operations ............................................................................................................................... 13
     2.4 Commercial Arrangements .................................................................................................................... 14
     2.5 Operational strategy .............................................................................................................................. 15
     2.6 Acquisition strategy ............................................................................................................................... 15
     2.7 Operational performance ...................................................................................................................... 16
     2.8 Historic and target returns .................................................................................................................... 17
3. Board and Management .................................................................................................................. 19
   3.1 Board composition................................................................................................................................. 19
   3.2 Board of Directors .................................................................................................................................. 19
   3.3 Advisory Board ....................................................................................................................................... 19
   3.4 Management ......................................................................................................................................... 20
4. Financial Information ...................................................................................................................... 22
  4.1 Historic Performance ............................................................................................................................. 22
  4.2 Price Protection ..................................................................................................................................... 23
  4.3 Balance Sheet ........................................................................................................................................ 23
  4.4 Pro-forma Impact of Seed Capital Raising and IPO................................................................................ 24
  4.5 Target Returns ....................................................................................................................................... 25
5. Global Sugar Market ....................................................................................................................... 27
  5.1 Demand.................................................................................................................................................. 27
  5.2 Supply .................................................................................................................................................... 28
  5.3 Price and the supply response ............................................................................................................... 29
  5.4 Brazil ...................................................................................................................................................... 30
  5.5 Conclusion.............................................................................................................................................. 31
6. Australian Sugar Industry ................................................................................................................ 32
  6.1 Overview ................................................................................................................................................ 32
  6.2 Burdekin Valley Irrigation Region .......................................................................................................... 34
  6.3 Raw Sugar Marketing: contractual and legislative situation ................................................................. 37
7. Terms of the Offer ........................................................................................................................... 38
   7.1 The Offer ................................................................................................................................................ 38

2
7.2 Pro-forma Capital Structure................................................................................................................... 38
    7.3 Rights Attaching to Securities ................................................................................................................ 39
    7.4 Use of Proceeds ..................................................................................................................................... 40
8. ASX Listing and Timetable ............................................................................................................... 41
9. Applying for Shares .......................................................................................................................... 41
   9.1 Governing Law ....................................................................................................................................... 42
   9.2 Directors Authorisation ......................................................................................................................... 42
   9.3 Contact Details ....................................................................................................................................... 42
Glossary .............................................................................................................................................. 43
APPENDIX 1 ......................................................................................................................................... 45
  CZARNIKOW REPORT ................................................................................................................................... 46
APPENDIX 2 ......................................................................................................................................... 53
  RISK FACTORS .............................................................................................................................................. 53
Application Form ................................................................................................................................. 59

3
Important Notice and Disclaimer

This Information Memorandum (IM) is issued by Australian Cane Farms Limited ACN 616 385 945 (ACF) for
the offer to investors of new fully paid ordinary shares (Shares) in ACF (Offer).

The antecedent structure to ACF was initially formed in 2005 as a stapled security (a land owning trust and
associated operating company) with an external manager. In preparation for this Offer and subsequent IPO
these entities have been restructured into a single corporate entity that is internally managed. For the
purposes of this IM, references to ACF and its historical financial performance also refer to its antecedent
entities. Details of the antecedent entities are available to investors upon request.

This IM is not a disclosure document pursuant to Chapter 6D of the Corporations Act 2001 (Act) as the
Offer is only to be made to persons to whom disclosure is not required under s. 708 of the Act including
Sophisticated Investors and Professional Investors as defined in the Act. Consequently, it is not subject to
the disclosure requirements affecting disclosure documents under Chapter 6D of the Act and does not
contain all the information that an investor would find in a prospectus or other disclosure statement.

Accordingly, before making a decision to subscribe for Shares, applicants should undertake their own due
diligence and seek the independent professional investment advice having regard to their particular
knowledge and circumstances.

An investment in the Shares pursuant to this IM should be considered speculative and high risk. The
Appendix to this IM contains a description of the risk factors an investor should be aware of when
considering an investment under this Offer.

The contents of this IM are confidential and must not be passed on or copied by you to any other person.
This IM should not be regarded by the recipient as a substitute for the exercise of their own judgment and
the recipient is expected to rely on their own due diligence if they wish to proceed further.

The Company has taken reasonable steps to ensure that the information in this IM is not false or
misleading. However neither ACF nor its founders, promoters, directors, officers, managers, employees,
agents, advisers, consultants or contractors makes or gives any representation, warranty or undertaking
(whether contractual or non-contractual and whether express or implied) in relation to, or assumes any
responsibility whatsoever for the authenticity, origin, validity, accuracy or completeness of, or accepts any
liability whatsoever for any damages, losses or expenses resulting from any errors in or omissions from, the
information, statements, comments, forecasts, projections, assumptions, estimates, opinions or other
contents set out in this IM or otherwise provided to recipients of this IM or their advisers.

The information contained in this IM is not intended to provide, and should not be taken as, the basis for
any credit or investment decision or constitute a recommendation by ACF that any recipient should
participate in the sale or purchase of any interest in ACF or the provision of funds to any person for that
purpose.

Each recipient of this IM must make (and will be deemed to have made) his/her or its own independent
assessment of the transaction and of the relevance and adequacy of the information contained in the IM ,
and such investigations and enquiries as he/she or it deems necessary to determine his/her or its interest
in ACF.
4
Neither this IM nor the information contained in it, or any other information or representation supplied or
made in connection herewith shall form the basis of any contract, arrangement or understanding.

The delivery of this IM at any time does not imply that the information contained herein is correct or
complete at that time or that there has been no change in the operations, financial condition, prospects,
creditworthiness, status or affairs of ACF or any other person associated with ACF since the date shown on
this Information Memorandum.

Without limiting the above, certain statements contained in this IM (including without limitation,
statements containing the wording anticipates, estimates, and words of a similar import), constitute
forward looking statements. Such forward looking statements involve known and unknown risks,
uncertainty and other factors that may cause the actual returns from the investment to be materially
different from any future results, performance or achievements expressed or implied by such forward
looking statements. The inclusion of the forward-looking statements set out in the Information
Memorandum should not be regarded as a representation or warranty with respect to their accuracy or the
accuracy of the underlying assumptions or that ACF will achieve or is likely to achieve any particular results.
Any proposed investors should make their own assessment and valuation as to the reasonableness of the
assumptions, expectations and estimates provided in relation to any forward looking statement and rely
upon their own independent legal, financial, accounting and taxation advice.

To the maximum extent permitted by law, ACF, Bridge Street Capital Partners Pty Ltd (Bridge Street
Capital), and their respective directors, officers and agents, expressly disclaim any and all liability for loss or
damage (whether direct, indirect or consequential) suffered or incurred by any person relying on this IM or
in connection with the information contained in this IM, including, without limitation, loss or damage as a
result of any omission, inadequacy, insufficiency or inaccuracy of any information contained in this IM,
whether by way of negligence or otherwise.

The recipient agrees that it irrevocably releases ACF and Bridge Street Capital in relation to any claims,
actions, damages, judgments, losses, remedies or other matters whether in contract, negligence, tort,
under statute, equitable relief or otherwise, in connection with the provision or contents of this IM or the
purported reliance on this IM by the recipient. The information in this IM remains subject to change by ACF
and Bridge Street Capital without notice.

This IM is current at 14 February 2017.

5
Executive Summary
Proven & profitable      Australian Cane Farms Limited (ACF) has been operating sugar cane
                         farms in the 100% irrigated Burdekin Valley of Tropical North
                         Queensland since 2005.

                         ACF has grown to become one of the largest sugar cane farm
                         aggregations in Australia.

Attractive entry price   ACF is raising $10m in fresh equity prior to a planned IPO and ASX
                         listing later in 2017. The new equity is offered at 70c/share
                         representing a 30c/share discount to the proposed IPO price of
                         $1.00/share.

Real estate assets       New equity will be used to acquire additional farms in the Burdekin
                         where land values have shown long term CAGR of around 4%.

Strong returns           ACF has achieved high and reliable cane yields plus economies of
                         scale to deliver strong operating returns.

Premier location         ACF operates in one of the best places in the world to grow sugar
                         cane. The Burdekin is fully irrigated, with quality processing,
                         logistics and handling infrastructure in place.

Growth potential         ACF has the potential to grow significantly beyond the size of the
                         proposed IPO. At completion of the acquisition program ACF will
                         own 5,000 hectares of sugar cane farms. This represents less than
                         6% of the Burdekin's 85,000 hectares of sugar cane farms.

Capital protection       Prime rural real estate and standing crops with attaching secure
                         water rights represents 91% of total assets. Land is suited to many
                         alternate crops if sugar cane ceases to be the highest and best use.

Price upside             Supply and demand dynamics for the global sugar market are
                         supportive and world raw sugar prices are forecast to remain at or
                         above current levels.

Expertise & alignment    Board and management are highly qualified with significant
                         personal investment in ACF.

6
1. Introduction

This Information Memorandum (IM) has been issued by Australian Cane Farms Limited (ACF) for the
purposes of raising up to A$10 million through the offer of 14,285,714 new fully paid ordinary shares
(Shares) at $0.70 (seventy cents) per share (Offer) to persons to whom disclosure is not required under s.
708 of the Act including sophisticated and professional investors (as defined by the Act). The Offer will
raise sufficient capital to achieve two objectives:

    1. Fund the acquisition of additional sugar cane farms;
    2. Fund the costs of launching a public IPO and subsequent listing on the ASX as more fully described
       in Section 7 of this IM.

1.1 Investment Opportunity
ACF owns and operates 3,940 acres (1,595 hectares) of highly productive, 100% irrigated sugar cane farms.
The farms are located in the Burdekin River Irrigation Area (Burdekin), south-west of Townsville in tropical
north Queensland.

ACF was established in 2005 and it has grown to become one of the largest cane farm aggregations in
Australia.

ACF is seeking additional equity of up to $10 million to be subscribed prior to commencement of a public
capital raising of $50 million (IPO) and a consequent listing on the ASX. The capital subscribed under this
Offer, if fully subscribed, plus the capital subscribed under the IPO (if fully subscribed) will be used primarily
for the acquisition of additional sugar cane farms. The objective is to complete the IPO and listing of ACF
on the ASX by the fourth quarter of 2017. Although the intention is for ACF to list on the ASX, no warranty
or guarantee is given that ACF will IPO or be admitted to quotation on the ASX. This cannot occur without
the issue of a prospectus that is lodged with ASIC and a listing application to the ASX.

The additional capital from the Offer and the IPO will fund a 3-year acquisition program to expand and
consolidate sugar cane farms in the Burdekin region to increase profitability through operational
economies of scale and expertise within ACF. At the completion of the acquisition program ACF expects to
own over 12,500 acres (5,060 hectares) of cane farms and be by far the largest cane farm aggregation in
Australia.

1.2 Offer
Pursuant to this IM, ACF offers investors the opportunity to apply for 14.3m new fully paid ordinary shares
at $0.70 (seventy cents) per share to raise up to $10 million of new capital prior to commencement of the
IPO. The issue price of the Shares reflects the current net asset value (NAV) of ACF. Following completion
of the Offer ACF will have a total of 33.9 million Shares on issue, implying a valuation of $23.8 million.

Upon completion of the IPO, ACF will have 93.9 million ordinary shares on issue, implying a market
capitalisation of over $90 million at the proposed issue price of $1.00 (one dollar) per share.

The minimum investment amount sought from individual investors under this Offer is $100,000.

7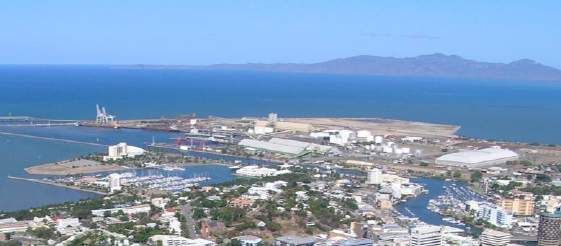
1.3 About Australian Cane Farms
ACF was initially formed in 2005 as a stapled security (a land owning trust and associated operating
company) with an external manager. In preparation for this Offer and the subsequent IPO these entities
have been restructured into a single corporate entity that is internally managed. For the purposes of this
IM, references to ACF and its historical financial performance also refer to its antecedent entities. Details
of the antecedent entities are available to investors upon request.
ACF was formed in 2005 by the same team who run the business today - Steve Kirby, Leigh Opit, Rick Lee,
Hank Tuten and Rick Holliday-Smith (collectively, the Founders). This group has been in business together
for over 12 years, and they have worked together and known each other for many years prior to that.
ACF purchased its first sugar cane farm in early 2006 with a personal investment of $4.0m by the Founders.
The Founders have continued to contribute significant personal equity to fund growth since then. ACF has
also accepted investment from a small group of high net worth individuals to enable its continued growth.
As at December 2016, the Founders held 51% of the equity in ACF.
ACF currently has aggregate assets of A$36 million, 90% of which comprise land and sugar cane crop values.
ACF employs 5 full time staff on the farms - a manager, agronomist, mechanic and general hands. ACF also
retains a one-on-one exclusive relationship with its harvest contractor (5 permanent contract staff) and up
to 3 casual staff utilised at peak periods as necessary.
The 3,940 acres of farms owned by ACF make it one of the largest cane farmers in the Burdekin and
Australia. The farms owned by ACF make up less than 2% of the total sugar cane farm area in the Burdekin.
There is therefore a significant opportunity for expansion by acquiring nearby cane farms improving their
on-farm productivity and capturing further economies of scale.
1.4. Investment Highlights
The benefits of investing in ACF include the following attributes and competitive advantages:
Substantial Australian Agricultural Enterprise
ACF is one of the largest cane farm aggregations in Australia and following the planned three-year
investment program, is expected to be by far the largest cane farm aggregation in Australia. As such,
ACF is positioned to benefit substantially from long term macro themes, including rising global
population levels, increasing prosperity driving a change in dietary patterns and pressure on arable
land as a result of encroaching urbanisation and industrialisation. These trends have resulted in a
steady appreciation of agricultural land values in Australia over a long period of time.
Operates in the Burdekin
ACF operates exclusively in the Burdekin and will continue to do so for the foreseeable future. The
Burdekin is the premier sugar cane growing region in Australia, collectively delivering 24% of the
annual Australian sugar cane crush. The Burdekin is one of the best places in the world to grow sugar
cane. Because it is 100% irrigated, the Burdekin is a globally competitive, high-yield, low cost sugar
production area with ideal agronomic conditions. The Burdekin has a favourable seasonal rainfall /
8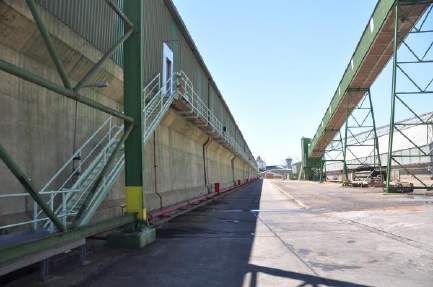
sunshine pattern for sugar cane growing and is linked by existing world-class infrastructure to the
world market. The Burdekin dam operated by Sunwater, holds 3 times the annual allocation for the
entire region and has been consistently reliable. The risk of drought which, typically, is a significant
factor in assessing agricultural investments in Australia is broadly mitigated by these factors.
Attractive Industry Structure
Australia is the world’s 3rd largest exporter of raw sugar, generating more than A$1.5 billion of export
revenue for the Australian economy. Australian sugar exports are cost competitive globally with the
industry focused on innovation and mechanisation. As a major sugar grower, ACF benefits from the
significant production and export infrastructure that exists to ensure that growers have an efficient,
seamless and commercially attractive route to export markets. This includes dedicated cane transport
rail lines to deliver harvested cane to sugar mills, a comprehensive system of sealed roads, cost
efficient sugar mills with transparent contracts with growers, bulk storage and export shipping
terminals (Sugar Terminals Limited) and an industry-operated marketing and logistics arm
(Queensland Sugar Limited).
Exposure to Favourable Sugar Price Environment
ACF’s revenue is directly linked to the global US dollar sugar price via medium term rolling Commercial
Agreements with the sugar mill. The sugar price environment is considered very attractive due to
continuing long term demand growth and constraints on supply growth. Rising global population and
increasing per-capita consumption in the developing world are driving growth in global sugar demand.
Sugar consumption is highly correlated with income levels - rising living standards are historically
highly correlated with rising sugar consumption until GDP reaches the highest OECD levels when per-
capita consumption then drops back marginally.
There are also significant constraints on production due to climatic limitations on new cane production
areas and the significant infrastructure investment necessary to process cane into sugar that will not
take place unless the price environment is supportive. Over the last 12 months the NY ICE #11 prompt
contract for raw sugar has risen by over 45% from US$14.0c/lb to US$20.5c/lb.
ACF has retained the C. Czarnikow Group (Czarnikow) to assist with forecasts for future raw sugar
prices. Notwithstanding inevitable short term fluctuations, it is Czarnikow's house view that the NY
ICE #11 "market equilibrium in the medium to longer term will be US$20c/lb or higher" (refer to
Appendix 1 to this IM).
Strong Financial Returns
ACF expects to generate returns to investors through dividends and long term capital growth of its
underlying assets. ACF has prepared forecasts for cash earnings and dividends per share, following
completion of the Offer and the IPO upon the terms contained herein and implementation of the cane
farm acquisition program.
These forecasts show EPS for FYE March 2019 at 7.4 cents per share. At the issue price of $0.70 per
Share under the Offer this is a PE ratio of 9.5 times. These forecasts support ACF's target for the Gross
9
Dividend in FYE March 2019 - including franking credit - of 8.0 cents per share. This represents a (pre-
tax) Dividend Yield of 11.4% pa on the share price under this Offer.
However these forecasts are subject to the risks disclosed in this IM including agricultural, marketing
and currency risks and although ACF has a reasonable basis for making these forecasts no warranty or
guarantee is given that such future returns will be achieved.
In addition, sugar cane farms (and land generally) in the Burdekin have appreciated at an average of
approximately 4.0% pa over the long term, with periods of stronger growth followed by a cyclical
consolidation. It is ACF's view that this capital appreciation will support an underlying long-term
capital appreciation target of 4% pa.
Growth Through Acquisition
ACF has already successfully achieved economies of scale by aggregating a substantial volume of sugar
cane production. This has delivered lower per hectare operating costs from larger block sizes, larger
equipment, standardised row widths, simplified cane age/variety mix, reduced per unit input costs and
other benefits.
ACF’s strategy is continue to grow its business through acquiring new farms and applying the same
practices to reduce unit costs and increase sugar yields, thereby increasing earnings per share. ACF is
confident that it can continue to grow its business through aggregation of farms in the Burdekin at
attractive prices. This confidence is based on the size of the Burdekin (the Burdekin contains
approximately 90,000ha under cane so the 3,500ha acquisition target represents less than 5% of the
total), the age of the existing grower population (average age is over 65) and fragmentation of the
existing farms (with an estimated 900 small growers each owning an average of 100ha).
Investment in Tangible Assets
ACF directly owns prime agricultural land and secure irrigation rights in the Burdekin. These assets are
expected to represent over 90% of the Company’s assets following completion of the farm acquisition
program. This level of direct ownership of tangible assets provides investors with a high degree of
capital protection for their investment.
Highly Experienced Board and Management
ACF's management team has operated ACF since its inception in 2005 and is highly experienced and
uniquely positioned to implement the growth strategy to deliver strong returns to investors. The
Board of ACF consists of highly experienced company directors who have the requisite governance
skills and experience. In addition, ACF has an Advisory Board comprising senior professionals and
consultants with deep knowledge and networks in the global sugar industry. This Advisory Board will
be available to assist and guide the Board and management in the establishment and execution of
ACF’s growth strategy. All members of the advisory board are investors in ACF.
Positioned to IPO in 2017
For the reasons noted above, ACF is well-positioned to launch and complete the proposed IPO by the
fourth quarter of 2017. Initial market soundings indicate an IPO price of $1/share is achievable in
10current market conditions. If achieved, this would deliver an uplift in the value of the shares issued
under this Offer of more than 40% in less than 9 months.
There is no guarantee that an IPO and ASX listing will be achieved, or of the timing and terms of any such
IPO. This will depend on economic and financial market conditions closer to the time of the IPO. An
investment in ACF via this IM involves significant risks, which are outlined in Appendix 2 to this IM.
For further information on ACF, the Offer or any aspect of this IM, please contact:
Steve Kirby Alexander Sundich
Managing Director Executive Director
Australian Cane Farms Limited Bridge Street Capital Partners
Level 23, 56 Pitt Street Level 14, 234 George Street
Sydney NSW 2000 Sydney NSW 2000
Ph: +61 2 9247 4111 Ph: +61 2 9002 5418
Mob: +61 432 332 220 Mob: +61 409 842 171
Email: steve@sisl.com.au Email: sundich@bridgestreetcapital.com.au
112. Australian Cane Farms Limited
2.1 Growth of ACF
Since its formation in 2005, ACF has acquired cane farms as shown in the chart below:
The equity in ACF is held by the Founders and a small number of high-net-worth investors personally
known to the Founders. In order to make the next step in its growth strategy, ACF requires a significant
increase in funding to more than triple its area under management from 1,595 hectares (3,940 acres) to
5,060 hectares (12,500 acres).
2.2 Investment Strategy
ACF applies a disciplined investment strategy driven by the fundamental investment principles of the
Founders. The "macro" decision of the Founders to invest in sugar cane farms was made because sugar
cane farming exhibited all three of the key principles set out below:
1. Capital protection: Investing in prime rural real estate has a favourable return profile over the long
term but also limits the "downside risk" of capital loss. The 100% irrigated Burdekin region meets
all the criteria for prime rural land.
2. Upside potential: Adopt a position to benefit from changes to the price paradigm arising from
global population and income growth with exposure to multiple possible upside scenarios. Sugar
consumption is strongly correlated with income growth whilst new sources of supply are not
evident.
3. Running yield: In a low interest rate environment, running yield is ever more important. ACF
generates an attractive yield.
12The same investment discipline is also applied to the analysis from a "micro" perspective. The decision to
invest in sugar cane farming was made because sugar cane has four key advantages over other agricultural
commodities:
1. Industrial: Sugar cane and raw sugar are both industrial bulk commodities. The sugar cane grown
by ACF is processed into raw sugar by a third-party mill. This raw sugar is a standard export-grade
bulk product.
2. Transparent pricing: The supply contract for cane to the mill is priced based on the world market
for raw sugar as reflected by the NY ICE #11. This market is traded out to 4 years forward and
enables ACF to "lock in" the price for its sugar cane for delivery in the current season and also up to
3 seasons in the future.
3. Prudent pricing policy: ACF has a formal forward-looking sugar pricing policy. This policy sets out
prudent guidelines for the volume and price levels under which ACF should lock in the NY ICE #11
and AUD:USD exchange rate that form the basis of its sugar cane price.
4. Infrastructure: The sugar industry in Queensland has world-class processing and logistics
infrastructure, with a proven track record of delivering on-time, in-spec product to its customers.
All participants in the industry benefit from this.
2.3 Farming Operations
Sugar cane is a giant tropical grass. Uniquely, and unlike grain crops that store carbohydrates in seeds,
sugar cane stores carbohydrate - in the form of a sucrose (sugar) rich liquid - in its stalk. This liquid is
extracted by mechanically crushing the stalk. The sugar content of the juice is known as the Commercial
Cane Sugar (CCS) and is measured as a percentage of the cane weight (generally between 12% and 18%).
Although there are many varieties of sugar cane plant they all share the same basic characteristics.
The life cycle of the sugar cane plant begins when it is planted. Sugar cane is propagated vegetatively, by
planting stem cuttings (called billets) that contain one or more buds. The buds germinate to produce a
primary stalk, from which roots and shoots develop. In the Burdekin, planting generally takes place in
March or April and the cane will be harvested the following year.
In an identical process to mowing your lawn at home, sugar cane also regrows after harvesting. Harvesting
is simply a more industrial version, that involves cutting the stalk about 3cm above ground level. ACF
harvests cane for 5 to 6 months each year - from early June through to mid December.
The leaves and tops of the sugar cane plant do not contain any significant sugar. As such, and in order to
minimise the logistical cost of moving this valueless vegetable matter, all sugar cane farms in the Burdekin
burn their cane prior to harvest. This does not damage the cane or the sugar in any way and in fact
provides valuable carbon back into the soil. The impact on transport and logistics costs is significant,
reducing average material transport requirements by over 40%.
Once the cane is cut, the plant immediately begins to regrow from the underground root buds known as
the stool. The process by which a new crop of sugar cane grows from the stool is called ratooning.
Ratooning is triggered by removal of the cane stems and the cane plant is again ready to harvest in the
subsequent year.
13Typically, five to six annual crops of sugar cane are produced from each sugar cane planting. The first crop
known as the "plant cane" and each subsequent years crop known as "first ratoon", "second ratoon" etc.
ACF operates the farms on a portfolio basis, rotating the planting and ratoon profile of the cane as well as
the cane variety. This provides effective risk management against pests, diseases and timing of cane
maturity.
The cane harvester chops the stalks into 20cm billets, which are deposited into 5 & 6 tonne capacity cane-
bins carried on trucks following the harvester. There is a network of narrow gauge railways and sidings
operated by the mill that efficiently collects all the cane harvested in the region for delivery to the mill.
ACF's trucks carry the cane-bins to designated rail sidings for collection, at which point responsibility for the
cane passes to the mill.
Following the crushing and extraction process, the raw sugar is transported from the mill to the storage
and loading facility located at the port in Townsville. This facility is managed by Queensland Sugar Limited
("QSL"), an industry owned non-profit organisation that manages the export marketing and sale of most of
the raw sugar produced in Queensland.
2.4 Commercial Arrangements
ACF sells all of the sugar cane that it produces to the regional milling company Wilmar Sugar Australia
(Wilmar). Historically, there has been a 3-year rolling Cane Supply Agreement (CSA) between ACF and
Wilmar that is negotiated on a collective basis with other growers in the same region. This arrangement is
expected to continue, however as described in Section 6.3 of this IM, Wilmar and its supplying growers
(including ACF) are still in collective negotiations for renewal of this contract. The CSA governs the
economic relationship between ACF and Wilmar and sets out the formula for determining the price and
payment terms of the sugar cane supplied by ACF.
The economic relationship between Wilmar and ACF is complex but in essence rests on the underlying
concept that although ACF (and all other cane growers) deliver sugar cane to Wilmar, the cane grower is
paid for the sugar contained in the cane based on how much the sugar is sold for and when that sugar is
sold. This intimate connection between the cane grower and the world market for raw sugar is what
enables ACF to price its cane based on the transparent NY ICE #11.
The price formula in the CSA operates to deduct a specified proportion of the sugar in each tonne of sugar
cane as payment to the mill for extracting the raw sugar from the sugar cane. Through this mechanism the
CSA determines a sharing of the raw sugar between ACF and Wilmar. Specifically, the CSA contains the
concept of GEI Sugar being the sugar extracted from ACF's cane after deduction by Wilmar of its share of
the sugar. Wilmar is thus paid in sugar, not dollars, for processing ACF's cane. In effect (as far as ACF is
concerned) Wilmar is simply a processor of ACF's sugar cane into GEI Sugar that ACF then sells in an agency
arrangement onto the world market.
ACF has currently appointed QSL as agent to sell its GEI Sugar although this is reviewed regularly to ensure
ACF secures the best possible terms for sale of its GEI Sugar. QSL operates two main methods of pricing
the GEI sugar. Firstly, ACF must deliver a minimum 40% of its GEI Sugar into the Harvest Pool. This pooling
arrangement is designed to avoid the risk of non-delivery of GEI sugar if production is lower than expected
14for any reason. Secondly, ACF has the option of pricing up to 60% of its expected GEI Sugar on a direct
basis through QSL onto the NY ICE #11. This arrangement is designed so that ACF (and all participating
growers) can lock in a specific price (based on the market at the time) if they wish to.
The outcome of this system is that ACF can progressively "pre-price" up to 60% of its cane crop in any given
year. Further, the futures market offers prices up to 4 years forward, and because of this, ACF can and
does pre-price a proportion of the sugar cane that it will harvest in future years. Compared to the Harvest
Pool, the pricing activities conducted by ACF have generated a net benefit of more than $1.0m over the last
3 years. A detailed discussion of the policy and the outcomes is contained in Section 4.2 of this IM.
2.5 Operational strategy
ACF's two key objectives are to achieve top quartile overall sugar cane yield, while reducing the overall cost
of production across the farm portfolio.
Implementation is based on:
1. Understanding of all of the needs of the sugar cane plant, including timing and interactions
between those needs;
2. Precise delivery of those needs to deliver the targeted yield outcomes;
3. Minimising waste of farm inputs;
4. Minimising depreciation, fuel and labour costs by using large machinery;
5. Increasing the long term sustainable productive capacity of the farm;
6. Careful control of source, timing, quantities, usage and price of inputs.
Over the past 4 years ACF has improved cane yields by 28% and is on track to deliver top quartile cane
yields across the entire portfolio for season 2017. This has occurred while driving down costs to levels
lower than the previous 4 year average. Both yield and cost outcomes have been achieved through on-
farm efficiencies such as block amalgamation and standardisation of farm practices, reduction in variable
input costs (scientific monitoring of use and outcome), economies of scale (increasing sizes of farm blocks
and machinery) and a focus on the unique characteristics of each cane block.
2.6 Acquisition strategy
There are around 90,000 hectares of sugar cane farms in the Burdekin Irrigation Area. Based on current
average land prices this equates to around $1.6bn of land value. ACF currently owns $32m of cane farms -
less than 2% of the total. There is thus a significant opportunity to acquire cane farms at fair value in the
areas we are seeking to expand into.
The acquisition strategy is based on the simple premise that the average age of sugar cane farmers is 65
and therefore that there is, in general, an imperative for third party capital to facilitate the ownership
transition from this cohort of farmers to the next generation. Whilst there is a "market price" for cane
farms in the Burdekin, the underlying price per hectare of land is modified by a number of factors. These
modifiers vary between buyers, and so there will be acquisition opportunities that ACF may not be willing
to meet the asking price for.
15In this sense, cane farmers seeking an exit will find ACF a willing buyer at our assessed value, rather than
the wider "market" or "asking" price. ACF's price assessment is based on a matrix of variables including
(inter alia) current farm productivity, soil type, irrigation allocation, farm location and infrastructure that
drive our calculation of an earnings accretive Internal Rate of Return.
The key factors and criteria applied by ACF for farm purchases are:
1. Zone of interest: There are five micro-regions within the Burdekin that are of interest to ACF.
Farms outside these areas are not considered desirable purchases due to distance from mill and
services, land values or plot sizes.
2. Aggregation: The purchase must be nearby to existing farms to facilitate integration into the
existing farm management flow and to minimise equipment transport time and cost.
3. Productivity: An assessment of the historic performance of the farm and the effect of the
age/variety mix on cashflow / fallow area planning of the existing portfolio. The farm must be
assessed as capable of delivering top quartile yields under ACF management.
4. Cost: Analysis of costs and delivery timing of management actions required to lift yields.
5. Irrigation infrastructure: On-title water allocation must exceed 6MLpa. Irrigation delivery layout
including underground piping, bore water and pumps is assessed for suitability and capacity to
deliver water at flow rates required by ACF management practices.
6. Soil: Although there is no "right" soil type, evidence of sodicity or salinity are "red flags". Nutrient
status, soil structure, moisture retention capacity and organic matter are assessed for productive
potential and short and long term costs of remediation or improvement.
7. Buildings: Nature, utility within the current portfolio and capacity for disposal are reviewed and
factored into the price.
2.7 Operational performance
The practices, discipline and focus brought by ACF to operating sugar cane farms have delivered strong
cane yields and sugar content.
The chart shows the first tranche of 290ha of farms acquired in 2006 (pre-acquisition yield in red). The
second tranche of 1,100ha of farms was completed in 2009 slightly reducing yields. A further tranche of
300ha took place in 2012. The effect of the additional farms can be seen in the effect on yields over 2011-
2013. Having completed the 4-year-long turnaround, the aggregation is now performing at levels of at or
above 120t/ha. The forecast for 2017 (shown in green) is for 128t/ha.
2017 (f)
162.8 Historic and target returns ACF generates strong returns and distributions to its investors. The returns are comprised of a cash return - distributed semi-annually - and the embedded capital appreciation of the farmland. The capital appreciation is quantified in an annual independent valuation in accordance with the AASB 1037 "Self Generating and Regenerating Assets" Standard known by its acronym SGARA. ACF currently has a variety of different debt and equity instruments on its balance sheet. In order to compare (on a like for like basis) past returns and the future return profile following the IPO, ACF's historic cash yield, referred to as return on assets (ROA) is shown alongside the forecasts for FYE March 2018 and 2019. The farms to be acquired following the Offer and the IPO will be consolidated over a three-year period starting on completion of this Offer and concluding in FYE March 2020 and will not therefore deliver significant earnings to ACF's account until FYE March 2019. The forecast FYE March 2018 earnings will be from the existing portfolio plus a smaller contribution from farms acquired with funding under this IM. Farms acquired with funds raised under the proposed IPO will not contribute earnings until FYE March 2019. Thus the per-share dividend for FYE March 2018 will be diluted by the expanded capital base. On a like for like comparison, the table below sets out ROA, across the five years ending March 2015 to 2019 as well as the target cash dividend (excluding franking credits) and the target dividend yield: FYE March 2015 2016 2017 (est) 2018 (f) 2019 (f) Equity Metrics: A$'000 EBITDA 1 1,017 2,188 2,664 4,423 10,646 Adjusted assets 2 32,473 31,838 33,311 41,011 86,464 ROA 3.1% 6.9% 8.0% 10.8% 12.5% Equity Metrics: cents/share EPS 3 3.2 7.4 Price Earnings ratio 4 22.1 x 9.5 x Target cash dividend 5 2.4 5.5 Target cash dividend yield 6 3.4% 8.0% 1. Refer to full definition of EBITDA in Glossary 2. Adjusted assets means net assets plus bank debt at start of relevant FY and for FYEM 2018 the addition of pre-IPO net equity. 3. EPS is net profit after tax (NPAT) divided by the number of shares on issue at the end of the relevant FY. 4. PE Ratio based on the share price under this Offer of $0.70 (seventy cents). 5. Target cash dividend does not include expected franking credits of 1 cent/share. 6. Target dividend yield is the target cash dividend per share divided by the share price under this Offer of $0.70 (seventy cents). For FYEM 2019 - the first full year following the IPO, ACF has a target for the gross dividend of 7.4c per share. The earnings and dividend targets are based on existing farm performance parameters achieved by ACF. It is important to note that exogenous factors, particularly weather and world raw sugar prices may affect the outcome. Further discussion regarding the assumptions underlying the financial model is set out in Section 4. 17
EBITDA does not include the underlying appreciation in land values. Historically, the Burdekin has shown
capital appreciation of approximately 4% pa with periods of growth followed by consolidation. The strategy
employed by ACF of buying poorer performing farms and improving the relative yield should further
enhance this outcome. With around 90% of every invested dollar utilised in the purchase of land this is
expected to have a significant impact on long-term capital appreciation.

The chart below shows the growth in land prices in the Burdekin over the 20 years 1996 to 2016:

                                                                                      Source: RP Data

Note: The data in the chart above comprises all land sales in the Burdekin region reported by RP Data. These sales are grouped by
quarter and averaged on a per hectare basis. The data has been filtered to exclude small parcels (to remove the distortion of
dwelling value on the land value) and transfers between related parties (where values may be below market for other reasons).

18
3. Board and Management 3.1 Board composition The management structure of ACF is very flat. The connection between the executive directors in Sydney and the farm personnel is purposefully close yet separated to ensure informed but dispassionate decision making. The philosophy of empowering on-farm personnel to make decisions enables rapid reaction to daily issues but also places responsibility on the staff for their decisions and actions. The outcome of this structure can be seen in the performance of the farms. 3.2 Board of Directors Chairman: Richard Lee AM. Rick started his career in the sugar division of CSR. He was involved in the international marketing and pricing of Australian raw sugar exports from the 1970's until he left to join the investment bank Rothschild Australia in 1985. Rick retired from Rothschild as CEO in 2001. He became a director of CSR in 2005 and was Chairman designate of CSR's demerged sugar business until its sale to Wilmar International in 2011. Rick is presently Chairman of Oil Search Limited and Ruralco Holdings Limited and a Director of Newcrest Mining Limited. Steven Kirby. Steve co-founded ACF in 2005. Prior to this he joined Rothschild Australia in 1989, becoming a Director in 2002 and assuming responsibility for a number of units within the banking business. Steve is also a Director of Queensland Sugar Limited. Leigh Opit. Leigh co-founded ACF in 2005. Prior to this he joined Rothschild in 1987, becoming a director in 2001 and assuming responsibility for risk management and prudential control. Leigh is responsible for financial management and operational oversight of farming activities. ACF will appoint up to two additional independent non-executive directors prior to the IPO who will have appropriate skills to complement the existing board and management. 3.3 Advisory Board ACF's Advisory Board has deep sugar industry and financial markets expertise and experience in a variety of industries and disciplines. The Advisory Board has been constituted by ACF to assist the Board and senior management. All members of the Advisory Board are investors in ACF. The Advisory Board comprises: 19
Rick Holliday-Smith. Rick has a wealth of experience in the financial markets. He is
presently Chairman of Australian Securities Exchange and Cochlear Limited.

Alec Brennan. Alec had a long career with CSR including as a director of the company
for a decade and its CEO for four years until he stepped down in 2007. His career
included substantial experience in CSR's sugar businesses. He currently is Deputy
Chancellor of Sydney University, a director of the NSW EPA and consults to numerous
other organisations.

John Barneby. John has spent his life working in the global sugar markets. He retired
as Chairman of C. Czarnikow in 2009 and provides insights to ACF on sugar pricing
and market strategies.

Dr. John Keniry AM. John started work at CSR as an industrial chemist working in the
sugar and ethanol divisions including responsibility for CSR's sugar mills and
refineries. His career has included roles as Chairman of Sugar Australia, Goodman
Fielder, President of the ACCI and director of the Australian Farm Institute.

Henderson Tuten. Hank is a founding partner and the chairman of Resource Capital
Funds. RCF is a preeminent mining and natural resources investment fund. Prior to
forming RCF, Hank was CEO of Rothschild Australia and subsequently Rothschild
North America.

3.4 Management
Managing Director: Steven Kirby. Steve co-founded ACF in 2005. Steve joined the Rothschild merchant
banking group in 1989. He was appointed a Director of Rothschild Australia in 2002 and held responsibility
for a number of units within Rothschild's investment and banking units. Steve worked closely with Leigh
for 16 years while they were both at Rothschild. Steve is responsible for ACF's overall strategic direction.
Within ACF's policy framework he also has responsibility for farm acquisitions and sugar pricing.

CFO and Company Secretary: Leigh Opit. Leigh co-founded ACF in 2005. Prior to this he joined Rothschild
in 1987, becoming a director in 2001 and assuming responsibility for risk management and prudential
control. Leigh is responsible for financial management and operational oversight of farming activities.

20
General Manager: Ryan Matthews. Ryan is an agronomist having studied a Bachelor of Agricultural
Science at UQ specialising in Plant and Soil Science. Ryan worked as an extension officer at the Queensland
Sugar Industry owned scientific organisation BSES Ltd. He was responsible for sugar cane research and
development for 10 years prior to joining ACF in April 2012. Ryan has day-to-day responsibility for all
agronomic and farm management activities.

21
4. Financial Information

4.1 Historic Performance
As explained in Section 1.3, references to ACF also refer to the antecedent entities of ACF. ACF's key
operating measures and the audited financial performance for the three Financial Years ended March 2015,
2016 and 2017 (unaudited estimate) are set out below:

                                                       FYEM                    FYEM                   FYEM
                                                       2015                    2016                 2017 (est)1
      Planted area (ha)                                1,095                   1,362                  1,225
      Harvest volume (t cane)                         122,772                 159,313                147,813
      Yield (t cane/ha)                                112.1                   116.9                  120.7
      CCS                                              15.00                   15.08                  14.50
      Opex ($/ha)                                      2,155                   2,330                  2,238
      Price ($/t cane)                                 41.30                   42.50                  47.00

      A$ '000
      Total income                                      5,210                   6,879                  7,112
      Variable Opex                                    (2,518)                 (3,067)                (2,841)
      Fixed Opex                                       (1,674)                 (1,624)                (1,607)
      EBITDA 2                                          1,018                   2,188                  2,664

      ROA                                               3.1%                    6.6%                   8.0%

1. With the harvest complete in December 2016, the cane volume, CCS and yield metrics for FYE March 2017 are actual, the
   operating profit remains an estimate until completion of the audit for FYE March 2017.
2. Refer to full definition of EBITDA in Glossary.

The planted area varies year to year as operational management decisions are made to take older cane
blocks out for the fallow and replanting process. This will result in changes to the overall volume of cane
harvested. However, ACF targets the per hectare yield as a key performance measure. The table above
shows ACF has achieved average cane yields of over 120 tonnes per planted hectare.

ACF owns 1,595 hectares of farms, and thus it can be seen from the FYE March 2015 results that nearly
30% of the farm area was in fallow as ACF took advantage of lower prices to rejuvenate a number of older
cane blocks. This lifted cane yields significantly for FYE March 2017 as the new plant cane yields averaged
167 tonnes per hectare.

The second key measure is operating costs. Whilst there are annual fluctuations as chemicals or other
variable costs rise and fall and usage volumes vary with planted area, ACF aims to keep the aggregate
increase to below 1.5%pa over a five-year period.

22
4.2 Price Protection
The raw sugar price is set in a global market, within which QSL operates to deliver a transparent "Pool"
price for growers that feeds into the cane price formula in the CSA. Alongside this, ACF also operates its
own price management strategy in accordance with a formal "Pricing Policy". This enables ACF to directly
pre-price a proportion of the raw sugar price while leaving the remaining amount to be set at the market
price under the pool system operated by QSL (and Wilmar). ACF is able to pre-price specified percentages
of its GEI Sugar under the CSA and has additional capacity under a swap line with Rabobank. Pricing
activities put in place for the three years FYEM 2014 to FYEM 2016 are shown in the table below.
ACF's pricing policy is designed to enable ACF to take advantage of favourable prices relative to cost of
production and not necessarily to outperform an average market benchmark. Nevertheless, in aggregate,
ACF's pricing actions have generated a net benefit compared to the average market price (the proxy being
the QSL "Seasonal Harvest Pool") of over $1.0m in the last 3 years.
FYEM FYEM FYEM
2014 2015 2016
ACF "Pre-priced" ($/t cane) 41.17 41.43 44.04
Pool Price ($/t cane) 38.14 39.36 37.35
Differential 3.03 2.07 6.69
Hedged Volume (t cane) 88,561 69,121 90,540
Benefit to ACF ($) 268,252 142,870 605,504
The aggregate benefit of $1.02 million (based on the aggregate revenue for the same period of $17.27
million) is equivalent to an extra 5.9% of gross revenues.
4.3 Balance Sheet
ACF's audited balance sheets for FYE March 2015, FYE March 2016 and the unaudited balance sheet for
YTD December 2016 are shown below:
Balance Sheet A$ '000 Mar-15 Mar-16 YTD Dec-16
Cash on hand 471 828 1,343
Receivables, prepayments 909 1,305 540
Farm land, buildings, improvements 31,400 32,379 32,638
Agricultural equipment 1,283 1,450 1,399
Total assets 34,063 35,962 35,920
Creditors, accruals & other liabilities 315 509 687
Finance leases & other loans 1,909 2,142 1,977
Bank facilities: Non-current 13,200 13,200 13,200
Total liabilities 15,424 15,851 15,864
Net Assets 1 18,639 20,111 20,056
1. This balance sheet incorporates the Deposit Notes as an equity item to reflect the underlying economic rights of the
securities.
23The $50k decline in net assets for YTD December 2016 compared to FYE March 2016 is the net effect of the
YTD December 2016 profit of $1.35m and the payment of the final distribution of $400k for the FYE March
2016 in June 2016 and the interim distribution of $1m for the FYE March 2017 in December 2016. As
explained previously, the antecedent entities of ACF included a trust that is obliged to distribute earnings.
4.4 Pro-forma Impact of Seed Capital Raising and IPO
The effect on ACF's balance sheet of the capital subscribed under this Offer and then subsequently the
capital subscribed under the IPO has been modeled and set out in the pro-forma balance sheets as set out
below.
The balance sheets as at December 2016 (actual) and March 2017 (estimate) account for the Deposit Notes
to be repaid at the IPO as an equity item (because they convert to ordinary shares if the IPO does not
proceed). The projected balance sheet at March 2017 does not incorporate the capital of $10m subscribed
in accordance with this Offer nor does it reflect any SGARA revaluation increment.
The balance sheet as at March 2018 incorporates both the pre-IPO capital raised under this IM and the
capital subscribed under the proposed IPO in July 2017 and the deployment of the subscribed capital in
accordance with the use of funds table set out in Section 7.4.
Balance Sheet A$ '000 Dec-16 (act) Mar-17 (est) Mar-18 (est)
Cash on hand 1,343 805 2,050
Receivables, prepayments 540 1,252 4,252
Land, crop, buildings, improvements 32,638 32,449 80,678
Agricultural equipment 1,399 1,393 3,243
Total assets 35,920 35,899 90,223
Creditors, accruals and other liabilities 687 514 1,014
Finance leases and other loans 1,977 1,895 3475
Bank facilities: Non-current 13,200 13,200 16,500
Total liabilities 15,864 15,609 21,259
Net Assets 20,056 20,290 68,964
The capital subscribed under this Offer will be utilised to fund the acquisition of sugar cane farms and to
meet the costs of the proposed IPO. This includes the direct one-off costs of the IPO and the ongoing
operating costs inherent in a listed company. Further details of the use of funds are set out in Section 7.4
of this IM.
The process to acquire sugar cane farms takes time and diligence to execute properly. In terms of scale,
the median sugar cane farm of approximately 110ha has a gross market value of around $2.1m. Further,
because the sugar cane is harvested between June and November each year, the realisation of revenues
can lag the acquisition date by up to 18 months.
24You can also read