The Michigan Land Resource Project - Summary of Findings
←
→
Page content transcription
If your browser does not render page correctly, please read the page content below
The Michigan Land Resource Project
          Summary of Findings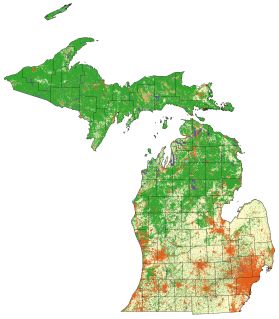
Our Land, Our Industries, Our Economy
               The land-based industries of agriculture, forestry, mining, and tourism and recreation account for
               almost $63.2 billion (29 percent) of Michigan’s economic output, and contribute immensely to the
               character of Michigan’s landscape.

  pg. 2        • Agriculture and food processing contribute $15 billion directly to Michigan’s economy and another
 Agriculture     $22 billion indirectly through support and related services.

               • Tourism and recreation accounts for 350,000 jobs and $12 billion.

               • Forestry provides 150,000 jobs to Michigan citizens and $9 billion to its economy.
  pg. 3
   Forestry    • Twenty-one minerals are mined in Michigan, and the non-fuel sector of the industry provides 9,000
                 jobs and $1.6 billion to the economy.

               Our Future
  pg. 4        Land-use and development decisions made today and in the future will affect our state’s character,
     Mining    landscape, and economy for generations to come. And the Michigan industries that rely on our land
               the most—agriculture, forestry, mining, and tourism and recreation—will be particularly affected.

               The Purpose of the Michigan Land Resource Project
  pg. 5        The Michigan Land Resource Project (MLRP) is an economic research initiative demonstrating how
               current land-use trends will affect the state’s economy through 2040.
Tourism and
 Recreation
               Research findings include economic forecasts and policy challenges important for leaders from
               business and industry, policymakers, and citizens to consider in land-use and development
               discussions.

               About the Research

               Researchers from Michigan State University used geographic information systems (GIS), remote
               sensing, and other techniques to map land use in 1980 and 1995, and to project the state landscape
               into 2020 and 2040, based on current trends. Projections can be viewed using the Land
               Transformation Model (LTM), which shows how land use would evolve over time, if current trends
               continue. The LTM can be viewed online at www.ltm.msu.edu.

               Using the LTM projections, research economists from the University of Michigan and Michigan
               Technological University identified potential threats to agriculture, forestry, mining, and tourism and
               recreation, based on future land-use needs and resource demands. Detailed economic forecasts for
               each industry are included in the final report.

               To date, the model has already demonstrated 94 percent accuracy in projecting land-use
               patterns in the Saginaw Bay and Traverse Bay areas.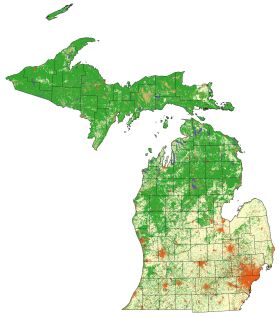
1965 1 9 7 0 1 9 7 5 1 9 8 0 1985 1990 1995 2000 2005 2010 2015 20202025 2030 2035 20402045 2050 2055
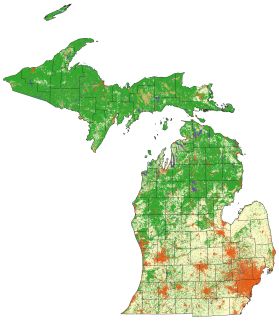
These maps depict possible urbanization
in 2020 and 2040 if land-use trends
since 1980 continue.
2040
2020
1980
The 1980 map is based on the state MiRIS land-use/cover
maps. The 2020 and 2040 maps are the result of the MSU
Land Transformation Model, which takes historical land-
use/cover data and projects it ahead based on a complex set
of land-use, demographic and transportation relationships.
About the Maps A Glance at What’s Ahead
MLRP maps show seven basic classes of land If current trends continue, researchers expect the following:
use which characterize Michigan. Together, these
classes constitute the land cover: built land Class of Land Use Year 1980* Year 2040* Change* % Change
(including land developed for residential,
commercial, industrial, and transportation uses), Agriculture 11.0 9.1 - 1.9 - 17%
agriculture, forest, non-forest non-agriculture
vegetation (noted on the maps as “other Built (Developed) 2.3 6.4 + 4.1 + 178%
vegetation”), wetlands, inland lakes, and barren
(or dunes). Private Forestland 18.2 16.9 - 1.3 - 8%
The MLRP analysis was conducted using the Other Vegetation 2.9 2.2 - .7 - 24%
Michigan 1980 base, provided by the Michigan
Department of Natural Resources’ Michigan Wetlands 1.8 1.4 - .2 - 10%
Resource Information System (MiRIS) data.
*in millions of acresAgriculture
SUMMARY OF FINDINGS
• The number of farms in Michigan is expected dry bean acreage by 36 percent, potato • For the livestock industries to remain viable
to decline from 42,000 in 2000 to about acreage by 16 percent, and vegetable acreage in Michigan, they must make major
24,000 by 2040. The number of very small by 13 percent by 2040. Acres of corn, adjustments to comply with environmental
farms will not change much, but dramatic soybeans, wheat, and sugarbeets are not and nuisance restrictions. With rapid
reductions will be noted in farms of 50 to expected to change appreciably. Acres in structural change, conversion to larger units,
500 acres. Farms over 1,000 acres will ornamentals will continue to expand. and new technology, remaining producers
increase significantly. However, the output of will need to be more capable in making this
Michigan agriculture will continue to increase • More than 40 percent of the land in farms is adjustment. If they’re not, production will
as farmers extract more product from less in hay, pasture, woodland, and other less shift to less populated areas in other states.
land and less labor. intensive uses. These areas will shrink by
one-third by the year 2040. • The main rationale for public policy dealing
• Michigan will lose 1.9 million acres of with the impact of urban sprawl on
farmland in the next 40 years. This represents • In spite of the projected declines in crop agriculture is to preserve open space and the
15 percent of its farmland with about a 25 acreages, increased yields per acre will more character of Michigan’s landscape.
percent loss in metropolitan counties. than offset reduced areas harvested, with
few exceptions. • One major dilemma is how to prevent
• As the number-two industry in the state, conversion of farmland without diminishing
agriculture (including food processing) • Dairying will shift out of metropolitan farm equities. In the 1990s, the annual gain in
provides needed stability to the state’s counties, and cow numbers will drop by at farm real estate values was 65 percent greater
economy and esthetics associated with open least 25 percent. Total milk production, than the average annual net farm income.
spaces. A trademark of Michigan agriculture however, will continue to increase.
has been its diversity, with substantial • For all of the land-based industries, the
sectors in livestock, field crops, specialty • The close interface between agriculture and geographic distance between supporting
food crops and ornamentals. urban areas has a positive influence on farm industries and businesses will make it more
households, but presents challenges for difficult to conduct business.
• Michigan agriculture is in danger of losing farmers to control nuisance factors,
some of its diversity as the fruit area is especially odor from livestock operations.
projected to decline by about 25 percent,
Agriculture and Other Uses
1980 2020 2040
Other Uses
Agriculture
Open Water
The maps above show the projected loss of agricultural land over time, if current development trends continue.
2Forestry
SUMMARY OF FINDINGS
• Due to the abandonment of farmland and its • The primary effect of development on
conversion to forest, forestland acreage will forestland in the future is fragmentation.
appear to increase in the future. However, As land is divided and sold, contiguous,
data shows a 1–3 percent decrease to 2020 large tracts of land become small parcels of
and a 2–7 percent decrease to 2040. many owners, who are not likely to manage
a forest for harvesting. In order to keep
• Forestland loss will be greatest in southern harvesting costs down, access to larger
lower Michigan—up to 13 percent in 2020 parcels is necessary.
and up to 25 percent in 2040.
• As the land becomes more fragmented,
• Encroaching urbanization may force forest the price for harvesting Michigan’s timber
managers to alter practices, e.g., discontinue will increase.
pesticide use or prohibit scheduled,
regenerative burns. This will most certainly
delay timber harvesting or restrict the
frequency of harvests. It may also add
costs if restrictions are imposed on
harvesting methods.
Forest and Other Uses
1980 2020 2040
Other Uses
Forest
Open Water
The maps above show the projected loss of forested land over time, if current development trends continue.
3Mining
SUMMARY OF FINDINGS
• Accessibility to land for mineral exploration, economically transported more than about 40 already have contributed to the loss in
development, and production is a principal miles. Increased urbanization and production in some counties.
factor that is directly and negatively impacted development will create additional need for
by urbanization, sprawl, and land these building materials, but these industries • Peat production is likely to be sensitive
fragmentation. Existing extraction sites come are not welcome in urban, suburban, or resort to land fragmentation and especially
under pressure as urbanization occurs around areas. In a sense, these industries will build to perceptions about the environmental
them, and their neighbors engage in themselves out of business as they are closed effects of its production. This is a
increasing conflict with them. There is even a down or squeezed out of developed areas. problem because peat-producing
stronger resistance to siting new mineral counties are forecasted to have
extraction operations. Potential mineral • The drilling of oil and gas wells is another greater urbanization growth than the
producers must compete against other land segment of the minerals industry likely to be state average.
uses that are often perceived as having higher affected by land fragmentation. The most
direct value to the local community and, relevant land-based constraint is ownership of Oil and Gas Wells with Land Use
accordingly, higher political value. mineral rights. Conflicts with surface owners
add to the costs and difficulty of exploring for,
• Minerals will become more expensive if they developing, and producing oil and gas.
must be shipped from farther away. This Increased urbanization and land fragmentation
expense will raise the cost of building and will make it more difficult and costly for the
construction activities as well as other industry to continue.
industrial production, making far less profit
and less competitive industries—all to the • In counties that have recently lost clay and salt Oil and Gas Wells
detriment of Michigan. production, there is an increase in population Built
density and built-up areas. Other signs of Agriculture
Shrubland
• There is a clear link between urbanization and urban sprawl indicate that increased land
Forest
the production of sand and gravel and crushed fragmentation can affect production of these
Open Water
stone. Their production depends on local minerals. Increased land values and greater
Wetlands
economic patterns and therefore will be highly difficulty in gaining access to the minerals can Barren
influenced by urbanization and local land-use drive up the costs of production and may
Above, locations of oil and gas wells
patterns. Construction materials cannot be
throughout the state, as of 1980.
Built Uses and Other Land Uses
1980 2020 2040
Other
Land Uses
Built
Above, maps show how built—or developed—land fragments will cover mining areas,
especially in northern-lower and southeast Michigan, if current development trends continue.
4Natural Resource-Based Tourism and Recreation
SUMMARY OF FINDINGS
• The great challenge for hunters will be more people than ever will have direct access • The golf industry will continue to expand,
finding huntable lands and gaining access. to water, through their own property or that of often becoming the last open space in many
Opportunities for hunting will shift away from a friend or relative. However, there will be communities outside of public parks.
the countryside near major population increasing conflicts over access to and
centers as new neighbors arrive and safety quality of many of Michigan’s premier trout • As people move to destination resort areas to
zones are created. With a safety zone of 450 (coldwater) streams as the banks become take advantage of the amenities and views,
feet from a structure off-limits to hunting more densely developed and vacant land and those areas may lose the very character and
without landowner permission, this means seasonal homes become permanent homes. quality that defined them as a destination. It
that every 30x30-foot structure constructed is often reported that the journey to the
removes 15.6 acres of land for hunting. • The amount of impervious surfaces, destination resort is an important element of
introduction of pollutants to waterways, rise the entire trip.
• Michigan currently has approximately 6,000 and fall of floodwaters, and changes in water
miles of snowmobile trails. About half of chemistry all damage aquatic environments
those trails are on public lands; the rest are and can reduce fish populations and species
on private lands with voluntary landowner diversity. Coldwater species are especially
permission, formalized by short-term lease vulnerable to changes in environmental
arrangements. The trail system is only quality, such as increases in temperature and
continuous if every landowner leases his/her pollutants and decreases in dissolved oxygen
property—so as land fragmentation levels—all of which are exacerbated by
increases, more and more easements will be sprawl. Homes with poorly engineered
needed to connect trails. For motorized trail septic systems constructed along northern
activities, the legacy of fragmentation will be Michigan streams, coupled with the
breaks in trails due to non-renewed leases. replacement of native vegetation with
fertilized lawns, can spark rapid deterioration
• Angling for coolwater species in lakes is of blue-ribbon trout waters.
likely to benefit from fragmentation because
Percent Watershed Subasins in Built Uses
1980 2020 2040
0–20
21–40
41–60
61–80
81–100
The maps above, which outline Michigan’s watersheds, show how increased impervious surfaces affect water quality. Water quality starts to
become impaired at 60 percent (seen in orange and red on the maps), which dramatically affects swimming, fishing, and other types of recreation.
5Land Use from 1980 to 2040
Northwest Lower Michigan
Land Use from 1980 to 2040
Southeast Michigan
Built Forest Barren
Agriculture Open Water County Boundaries
Shrubland Wetlands
Land Use from 1980 to 2040
Southwest Lower Michigan
Where Do We Go From Here?
The purpose of the Michigan Land Resource Project is not to draw subjective conclusions, but rather
to serve as a call to action. The MLRP is intended to provide the tools to inform the land-use dialog
at all levels of decision-making, in both the private and public sector, in every part of the state.
Speakers Are Available
PEOPLE AND LAND For more information, or to schedule an MLRP presentation for your next meeting, contact:
600 W. St. Joseph, Suite 10
Lansing, MI 48933-2265 Holly Madill, MLRP Manager
People and Land
(517) 371-7467 517-371-7467
Web: www.peopleandland.org pal@peopleandland.org
E-mail: pal@peopleandland.org
The Michigan Land Resource Project was funded by grants from the W.K. Kellogg Foundation of
Battle Creek and the Frey Foundation of Grand Rapids. The MLRP is administered by People and
Land, a statewide initiative dedicated to educating and developing leadership around land-use issues
in Michigan.
For the complete report, visit www.peopleandland.org/resourcelibrary_mlrp.htmYou can also read