THE NEXT RETAIL REVOLUTION - Threats and Opportunities in Changing Consumer Behavior September 2017 - Alvarez & Marsal
←
→
Page content transcription
If your browser does not render page correctly, please read the page content below
THE NEXT RETAIL REVOLUTION
Threats and Opportunities in Changing
Consumer Behavior
September 2017

Love it or hate it, people don’t shop like they used to. Retailers that can
    tap new technology to enhance the customer experience across channels,
    create demand-driven supply chains and optimize real estate will be best
    positioned to compete as the retail industry enters a new era.

    INTRODUCTION
    Retail is a key driver for the U.S. economy, approaching $5 trillion — more than 25 percent of the nation’s gross domestic product
    (GDP). Overall, sales in 2017 and 2018 are expected to grow 3.5 percent and 4 percent, respectively, almost double the projected
    inflation rate. The industry is thriving. However, changes in consumer behavior and digital technology are creating new threats and
    opportunities, specifically in the areas of omnichannel commerce, supply chain management and retail real estate.

    E-commerce has been around for more than 20 years, and the term has become ubiquitous among retailers and consumers
    alike, but fresh advancements in digital technology like radio frequency identification (RFID)1, beacons2 and m-commerce3 —
    the buying and selling of goods exclusively via mobile device — are opening unprecedented opportunities to gather data and
    customize the shopper experience across channels. The potential impact isn’t limited to the digital space. Per a recent report by
    Retail Dive citing data from Forrester, web-influenced offline sales — which are either brick-and-mortar sales-driven by online
    research or online purchases picked up in-store — are expected to account for 41 percent of retail purchases by 2020, up
    nearly 8 percent from 2016.

    In addition to enhancing the customer experience in-store and online, advancements in digital technology are changing the way
    and speed at which retailers can respond to consumer demand. Studies show that product availability and convenience have
    a much greater impact on brand loyalty and customer retention than they did just a few years ago. Today’s shoppers not only
    expect the latest trends, but also full inventory transparency and immediate access to products. In response, more retailers
    are exploring demand-driven supply chains.

    Store closures of major retail brands have made top headlines repeatedly over the past several years, and the “overstored”
    status of the country is widely accepted. However, more than 90 percent of retail sales in 2016 were made in physical locations,
    and retail stock per capita — one way of determining if an area is “overstored” — varies widely from market to market. Brick-
    and-mortar is not dead. Recent investments in physical storefronts by online brands like Amazon, Warby Parker and Bonobos
    affirm that conclusion, but retailers must use their physical storefronts to the best advantage as traffic patterns and shopping
    culture continue to evolve.

    This isn’t the first time that major changes in the economy and consumer behavior have dramatically reshaped retail. In fact,
    it happened during the last two centuries along similar lines. During that period of change, businesses that clung to traditional
    models faded into history. Those that seized the opportunity to evolve became retail icons and dominated the industry for more
    than a century. As the real-world lives of consumers become more integrated with digital technology, retail experiences must evolve
    once again. By optimizing both digital and physical aspects of an omnichannel retail strategy, retailers have an opportunity to
    grow and compete through the industry’s next revolution.

    1
      Radio frequency identification, or RFID, uses electronic tags to automatically track objects.
    2
      Beacons are small digital devices that use low-energy Bluetooth technology to send targeted information to mobile devices based on a user’s precise location in a
    store or shopping center.
    3
      M-commerce is a subset of e-commerce. It is distinguished because it uniquely allows consumers to browse and make purchases anywhere, anytime, without
    necessarily needing access to an electrical outlet or modem.

3
CONTENTS
A BRIEF HISTORY OF MODERN RETAIL         2

THREE AREAS OF THREAT AND OPPORTUNITY    3

     OMNICHANNEL COMMERCE                4

     SUPPLY CHAIN MANAGEMENT             7

     RETAIL REAL ESTATE                 11

CONCLUSION                              14

REFERENCES                              15

RELATED A&M INSIGHTS                    17

ABOUT THE AUTHORS                       17

                                        THE NEXT RETAIL REVOLUTION   1
Simultaneously, technological advancements made large-
    A BRIEF HISTORY OF MODERN RETAIL                                     scale operations manageable and steady growth attainable for
    This isn’t the first time rapid changes in economic conditions and   retailers. In 1879, James Ritty patented the first cash register,
    consumer behavior have dramatically altered the retail industry.     calling it “Ritty’s Incorruptible Cashier,” helping retailers better
    Knowing the circumstances that created modern retail will shed       manage and track high-volume sales. One hundred years later,
    light on the revolution currently underway.                          the invention of barcodes further enhanced retailers’ abilities to
                                                                         manage and track inventory.
    The story of modern retail began about 150 years ago. The
    Industrial Revolution in the mid-19th century rapidly expanded
    the global economy as well as middle-class assets. Not only
    did consumers suddenly have more disposable income, they                 WHAT DO THE SEARS CATALOG
    also had more leisure time. Department stores like Harrod’s of
    London, Macy’s and Bloomingdale’s emerged in the mid- to
                                                                             AND AMAZON HAVE IN COMMON?
    late-1800s not only as central emporiums where shoppers could
    browse and buy a wide variety of goods, but also as venues               The Homestead Act of 1862 fueled westward
    for entertainment. Harry Gordon Selfridge, founder of London-            movement in the U.S., creating a greater need for direct
    based Selfridges department store, famously said, “Excite the            order and delivery services in retail. While it was not
    mind, and the hand will reach for the pocket.” Department stores         the first mail-order publication to reach consumers, the
    sought to excite the minds of consumers by offering concerts,            Sears, Roebuck and Co. catalog was, by far, the most
    art exhibits, fashion shows, celebrity visits, traveling showcases       extensive and well known, publishing more than 300
    and, in the case of Macy’s, an annual Thanksgiving Day parade.           pages of products including clothing, appliances, tools,
                                                                             jewelry, musical instruments, groceries, books and even
    The rise of department stores jump-started the modern retail
                                                                             cars. Taking advantage of special postage rates for mail-
    industry, and as competition grew so did new innovations in retail
                                                                             order catalogs, including a “Rural Free Delivery” service
    marketing and technology.
                                                                             offered by the U.S. Postal Service, Sears made itself one
    In 1875, Montgomery Ward was the first to promise “satisfaction          of the most affordable, convenient ways to shop from
    guaranteed or your money back.” Others implemented new                   anywhere in the U.S.
    marketing tactics, like automatic mark-downs designed to
                                                                             Over the past 20 years, Amazon has seized similar
    continuously push inventory, and mail-order catalogs, which
                                                                             opportunities created by new technology and
    extended brand reach and distribution beyond the storefront.
                                                                             distribution methods, becoming the new leader in
    In the mid-1940s, 7-Eleven set new consumer expectations for
                                                                             product variety and convenience.
    accessibility and convenience by opening from 7 a.m. to 11 p.m.,
    seven days a week — hours that were unprecedented at the time.

2
As retail culture grew throughout the 20th century, so did              feedback, interact with brands and fellow consumers, monitor
store footprints. Between 1977 and 1987, the number of U.S.             inventory and find locations. Brick-and-mortar stores are still
shopping malls increased by 57 percent, eventually doubling by          desirable destinations for some, but their role is evolving thanks
2007, according to CoStar Group and U.S. Census reports. In             to advancements in supply chain and delivery methods. The
1962, Kmart, Walmart and Target all opened their first stores,          purpose of retail real estate is certainly changing as commerce
giving rise to “big-box retail” in just a three-month span. Thirty      becomes an omnichannel experience.
years later, Minnesota laid claim to the nation’s largest-ever
shopping mall, the Mall of America (MOA).                               Retailers, stakeholders and advisers who understand both how
                                                                        and why consumer behavior is changing, and can adjust to
Just as the MOA was making U.S. retail history with a gross             better meet demand and provide fresh customer experiences,
acreage that could contain seven Yankee Stadiums and more               will be best prepared to compete and succeed, just as Selfridge,
than 500 stores, a brand-new technology was taking shape.               Ward and other innovators did during the last retail revolution.
Like the Industrial Revolution a century and a half before, it
would spur dramatic changes in the ways people work, play, live,
communicate and consume.
                                                                        THREE AREAS OF THREAT AND
In 1991, scientists at the European Organization for Nuclear
Research (CERN) launched the very first website and laid the            OPPORTUNITY
foundation for the World Wide Web. Four years later, Amazon was
open for business. In its first month of operation the new online-      In 2016, retail accounted for the second-highest number of
only retailer had customers in all 50 states as well as 45 countries.   bankruptcies and was the second-largest distressed sector with
                                                                        a Standard & Poor’s 500 Index distress ratio of 20 percent, an
With technology enabling real-time, low-cost, multimedia                increase of more than 21 percent over the previous year. The
communication worldwide, people embraced new forms of                   year 2016 also saw the highest number of retail defaults since
entertainment. Pioneers like AOL and MySpace ignited social             the financial crisis earlier this century. Of those defaults, 75
media culture by changing the way and frequency at which                percent were in the apparel segment, and a significant number
people communicate. Facebook, the world’s largest social site,          of apparel manufacturers are currently on the S&P “Negative
launched just a decade after Amazon. In June 2017, Facebook,            Watch” list. New business models, including online retail, fast
which now hosts more than 65 million business pages in addition         fashion and off-price retail, are causing price deflation and an
to personal profiles, announced its goal to become a virtual            overall decrease in average unit retail (AUR).
storefront for retailers.
                                                                        These factors cast a bleak light, but the industry overall is
Just as department stores rose to meet changing consumer                growing. The same changes in technology and consumer
behavior in the 19th century, the internet is affording                 behavior that are threatening the status quo are also posing new
opportunities along those same lines. In addition to browsing           opportunities for innovation and success.
and buying online, shoppers can also research products, share

                                                                                                     THE NEXT RETAIL REVOLUTION              3
Exhibit 1
                                    US M-Commerce Sales as a Pct. of Total E-Commerce Sales, 2012–2016 ($ billion)

    Data Source: comScore

    OMNICHANNEL COMMERCE                                                                            Digital commerce, as a whole, now accounts for 10–15 percent
                                                                                                    of all apparel sales with specialty store penetration of about 20
    Threats                                                                                         percent. Online clothing sales are rapidly growing as in-store
    Non-store retail has been a factor in the industry since the advent                             purchases approach negative growth (Exhibit 2).
    of mail-order catalogs (See “What do the Sears catalog and
    Amazon have in common?”, p. 2.) and the rise of teleshopping in                                 In the home furnishings sector, e-commerce is also expected
    the 1980s. However, non-store retail hasn’t been truly disruptive                               to be the fastest growing distribution channel. Home delivery is
    until the last decade. In 2015, e-commerce made up 7.4 percent                                  usually required anyway, and new interactive technologies like
    of global retail sales, according to eMarketer, and that number                                 augmented reality enable shoppers to virtually “try before they
    is expected to reach 12.8 percent by 2019. That growth is                                       buy.” According to eMarketer, online furniture sales in the U.S.
    fueled by decreasing shipping costs and new advancements                                        are expected to increase at a compound annual growth rate
    in media, technology and data analytics. Emerging trends like                                   (CAGR) of 12.3 percent and will account for 30 percent of total
    m-commerce (Exhibit 1) and web-influenced offline sales are                                     furniture sales by 2018 (Exhibit 3).
    impacting all segments.

                                                                                            Exhibit 2
                                          Year-Over-Year Change in Traditional and Online Clothing Sales 2012–2016
     11%

      9%

      7%

      5%

      3%

      1%

     -1%

     -3%
          12

                 12

                         Ju 12

                        Se 12

                        No 012

                        Ja 12

                          ar 3

                          ay 3
                         Ju 13

                        Se 13

                        No 013

                        Ja 13

                          ar 4

                          ay 4
                         Ju 14

                        Se 14

                        No 014

                        Ja 14

                          ar 5

                          ay 5
                         Ju 15

                        Se 15

                        No 015

                        Ja 15

                          ar 6

                          ay 6
                         Ju 16

                                   6
                                 1

                                 1

                                 1

                                 1

                                 1

                                 1

                                 1

                                 1

                               01
        20

               20

                     20

                               0

                             20

                             20

                             20

                             20

                               0

                             20

                             20

                             20

                             20

                               0

                             20

                             20

                             20

                             20

                               0

                             20

                             20

                             20

                             20
                            l2

                             2

                            l2

                             2

                            l2

                             2

                            l2

                             2

                            l2
      n

            ar

                   ay

                           p

                           v

                           n

                           p

                           v

                           n

                           p

                           v

                           n

                           p

                           v

                           n
    Ja

           M

                        M

                        M

                        M

                        M
                 M

                        M

                        M

                        M

                        M

                                                                   Nonstore Retailers                            Clothing Stores

    Source: RBC Capital Markets, “Department Stores & Specialty Softlines – 2017 Outlook”

4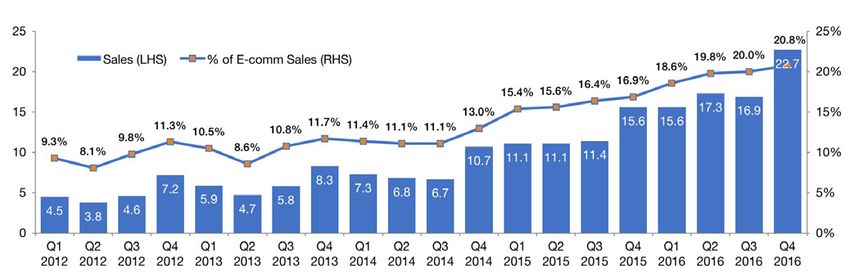
Exhibit 3                                                                                              Exhibit 4
          Online Furniture Sales 2014–2018F ($ billion)                                                     US Retail Sales Forecast 2016–2020F ($ trillion)

Source: eMarketer, Inc. “Furniture and Home Goods Retailers and Digital Commerce 2016”
                                                                                                    Data Source: Retail Dive, “Mobile’s Influence on Offline Sales Continues to Grow: Forrester,”
                                                                                                    February 2016

Even the grocery segment, in which brick-and-mortar had been                                        help build momentum. Three emerging areas of omnichannel
previously unbeatable against home delivery services, appears                                       opportunity are:
to be reaching an inflection point. According to a 2017 report
by the Food Marketing Institute and Nielsen, online sales are                                        1. Customer personalization
expected to compose 20 percent of total grocery spending —
                                                                                                     2. Optimizing existing digital channels for m-commerce
an estimated $100 billion — by 2025.
                                                                                                     3. Enhancing in-store experiences
The growing popularity of meal kit services like Blue Apron and
HelloFresh, as well as Amazon’s recent and widely talked about                                      CUSTOMER PERSONALIZATION
acquisition of Whole Foods Markets, are strong indicators that                                      Cross-channel influences — including websites, mobile apps,
omnichannel strategies may soon be as critical for the grocery                                      social media, email, buyer reviews and digital advertising — are
segment as they are for apparel.                                                                    playing a growing role in consumer decision-making. More and
                                                                                                    more, customers are impressed by, and even prefer, brands
Opportunities
                                                                                                    that can deliver a personalized experience across channels.
The good news is that sales are growing. In fact, overall retail
                                                                                                    According to MyBuy’s 7th Annual Consumer Personalization
sales are projected to increase 3.5 percent in 2017 and 4
                                                                                                    Survey, 53 percent of consumers prefer brands that suggest
percent in 2018. While a portion of that growth is fueled by
                                                                                                    products based on past purchases, and 49 percent prefer
e-commerce, a recent report by Retail Dive citing data from
                                                                                                    brands that personalize ads. Brands that personalize emails
Forrester shows that web-influenced offline sales are expected
                                                                                                    and brands that personalize the shopping experience across all
to account for 41 percent of total sales in 2020, up 8 percent
                                                                                                    channels are preferred by 48 percent of consumers, respectively.
from 2016 (Exhibit 4) as consumers more frequently use their
                                                                                                    Of course, providing a highly personalized customer experience
smartphones in stores to research products, compare prices and
                                                                                                    requires data collection on a granular level. Fortunately, mobile
check online inventory.
                                                                                                    apps, beacon technology and social media are making data
While it might not be technically or financially feasible for an                                    collection and message targeting ever more feasible.
established business to go from a Web 1.0 digital presence to
a full-fledged Web 3.04 sales platform in one fiscal year or less,
focusing omnichannel retail strategies on a few key areas may

4
  Web 1.0, 2.0 and 3.0 are stages of internet advancement. Web 1.0 refers to sites that serve as information portals exclusively, providing read-only content. Web 2.0 sites allow users to
share information and contribute content such as comments, photos, videos or blog posts. Web 3.0 is a yet-to-be-fully-realized stage of the internet that incorporates advanced technology
like machine learning, data mining and artificial intelligence. To some extent, sites that make recommendations based on a user’s past actions fall into this category.

                                                                                                                                              THE NEXT RETAIL REVOLUTION                            5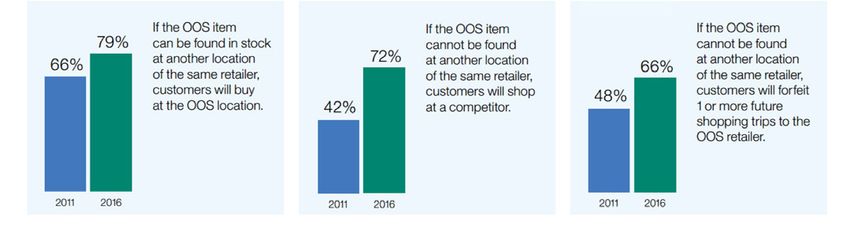
GETTING PERSONAL TO                                               MAKING IT BETTER
       INFLUENCE OFFLINE SALES                                           WITH MOBILE

       Gino Rossi                                                         Starbucks
       The Poland-based footwear seller wanted to drive                   Over the past few years, the Seattle-based coffee
       customer loyalty by offering promotions tailored to a              company has invested more than $400 million in digital
       customer’s individual needs. Integrating in-store beacon           technology with a primary focus on improving its mobile
       technology with its mobile app, Gino Rossi collects                app. Introducing new features that allow customers
       real-time data and relays it back to an analytics platform         to do nearly everything from their smartphone — find
       that generates customized promotions for individual                a store, choose a product, place an order, finalize a
       shoppers based on their unique habits and interests.               purchase and earn rewards — Starbucks has been
       In fact, there are no standardized promotions at Gino              able to not only streamline the process for customers
       Rossi. They’re all customized. Up to 98.5 percent of               but also for employees, improving productivity across
       users continue using the brand’s app after receiving a             the board. In 2015, Starbucks saw a 15–20 percent
       personalized notification, and notifications achieve an            increase in the number of U.S. transactions driven by its
       average click-through rate of 85 percent. Both metrics             mobile app and a 17 percent increase in total revenue
       are significantly above industry standards.                        year over year. In Q1 2016, consumers had loaded $1.9
                                                                          billion onto their Starbucks cards through the mobile
       Chick-fil-A                                                        app, and in 2017, average Starbucks app spending has
       To improve customer experience and increase sales, the             increased almost 20 percent.
       fast food chain wanted a mobile app to provide the same
       level of personalized service that customers expect in             Nike
       its restaurants. The Chick-fil-A app generates a unique            No longer just an apparel retailer, Nike has invested
       storyline for each customer based on the customer’s                heavily in tech to deepen its relationship with athletic
       order history, routine and location. It greets the user,           consumers. In 2016, the company launched the Nike+
       incorporates real-time visuals and provides a detailed             app, which provides not only product information, but
       menu that varies based on time of day. It also stores              also custom news feeds and training tips based on
       preferred locations and personal payment information               a user’s inputs and behavioral patterns. Overall, Nike
       and offers an Allergens filter that warns users based on           has more than a dozen smartphone apps to engage
       their meal selections. When the app launched in 2016, it           consumers. It also has an investment in wearable tech
       made the number one position in the iTunes App Store,              with the Nike FuelBand, an electronic bracelet that
       displacing giants like Facebook and Snapchat. It also              tracks a wearer’s activity. In 2016, Internet Retailer
       received rave reviews on Google Play and was highlighted           reported that Nike’s e-commerce sales had grown 51
       on CNBC and in the Atlanta Business Chronicle.                     percent year over year.

    M-COMMERCE                                                        adults now own a smartphone, which is higher than the number
    E-commerce is now more than 20 years old. Retailers are well      of adults who use social media (69 percent) or have broadband
    aware of its presence and impact. However, m-commerce —           internet at home (73 percent). In 2015, comScore reported
    the buying and selling of goods exclusively via mobile device     that the number of mobile-only users surpassed the number of
    — is a growing trend and one that should be top of mind when      desktop-only users for the first time ever.
    shaping an omnichannel retail strategy.
                                                                      Mobile devices afford the unique advantage of giving users access
    The release of Apple’s first iPhone 10 years ago sparked          to content anywhere, anytime, without the need for an electrical
    widespread adoption of mobile technology. According to a report   outlet or modem to connect to the internet. With the integration
    by the Pew Research Center, as of 2016, 77 percent of U.S.        of GPS technology, users can find information (and be reached)

6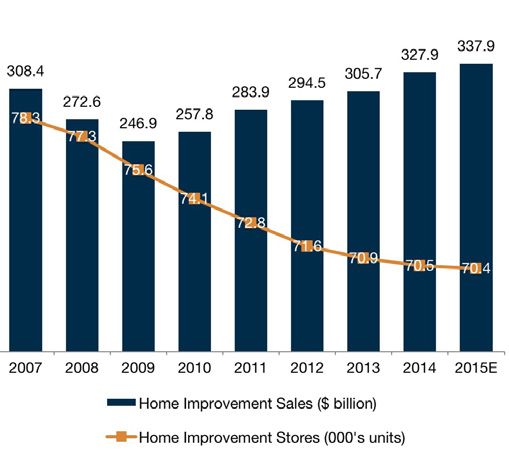
based on their real-time location. This subset of e-commerce is
creating additional opportunities for both online and brick-and-
mortar retailers. Having a mobile-first approach to omnichannel
                                                                        CREATING A 21ST CENTURY
strategy will be even more important in the future.                     IN-STORE EXPERIENCE
ENHANCING IN-STORE EXPERIENCES
A theory exists that consumer spending is shifting away from             VulcanoBuono
tangible goods toward experiential activities, including dining,         By deploying beacon technology throughout its venue,
spas, entertainment and travel. While retail sales are growing,          Italian shopping center VulcanoBuono has been able
in a world where personal experiences are being shared and               to drive greater store traffic and engage shoppers with
compared more frequently on social media — from food photos              personalized offers. More than 200 beacons recognize
to entertainment reviews to travel routes and check-ins — the            and communicate with shoppers as they walk by, offering
promotional value of a top-notch experience can’t be denied.             them custom coupons for boutiques, restaurants and
Today’s retailers may have something to learn from the mid-19th          cinemas. The app also integrates with and gamifies
century department stores that sought to “excite the mind” and           the mall’s loyalty program. For in-app activities or social
inspire buying by creating entertainment destinations within their       interactions, users receive points and badges that can be
shopping centers (“A Brief History of Modern Retail,” p. 2).             redeemed for gifts at the mall. In the first six months after
                                                                         launching the new experience, the app was downloaded
In 2013, Glimcher Retail Monitor surveyed consumers about their
                                                                         about 8,000 times, and the average user was interacting
preferences between online and in-store shopping. At the time,
                                                                         with it about 25 times per month.
half of respondents shopped both online and at the mall, while
30 percent shopped exclusively at the mall. The primary reasons          Rebecca Minkoff
for choosing an in-store shopping experience were the ability to         In 2014, the luxury apparel and accessory retailer opened
try on clothes and accessories (74 percent), to enjoy the in-store       its flagship location in New York City as a “connected
experience (55 percent) and to have store variety (49 percent).          store.” The space incorporates interactive screens, digital
Apparel newcomers like Stitch Fix, LeTote and Gwynnie Bee                mirrors and RFID technology to create an immersive,
have recently introduced subscription models that let customers          personalized shopping experience with the added benefit
order online, try on at home and return items as needed with             of collecting rich customer data. The store’s touch
no additional shipping fees. However, a significant number of            screens display videos and product information and allow
shoppers still value the experience and variety afforded by in-          shoppers to select items to be added to their fitting room.
store shopping. The key for retailers is having an omnichannel           Shoppers can even order drinks and change the dressing
strategy that makes the shopping experience personal, engaging           room lighting. Preferences are stored and automatically
and shareable whether online or in-store.                                reinstated when a customer returns to the store. Using
                                                                         RFID technology, the company can suggest products
SUPPLY CHAIN MANAGEMENT                                                  based on size, color and other user preferences. Rebecca
                                                                         Minkoff’s full suite of digital features work in conjunction
Threats                                                                  with the retailer’s mobile app. According to a 2015 article
When it comes to modern supply chain management, retailers               by Digiday, this use of cutting-edge tech helped to triple
that embrace a demand-driven approach seem to be capturing               expected clothing sales in the store’s opening year.
market share. Studies show that inventory transparency
and almost-immediate product accessibility are now critical to
customer acquisition and retention.
                                                                            Find retail solutions tailored to fit your needs.
According to a 2015 study by eMarketer, 82 percent of U.S.
shoppers want the ability to see and search available inventory at
stores in their vicinity. Furthermore, immediacy and convenience     channels, they are more willing than ever to switch brands if an
seem to greatly outweigh brand loyalty in their purchasing           item is out of stock. In 2016, 72 percent of consumers said that
decisions. Surveys conducted by IBM in 2011 and 2016 indicate        if an out-of-stock item was not available from their first-choice
buyers not only expect real-time inventory visibility across         retailer they would switch to a competitor, compared to only 42
                                                                     percent in 2011. In 2016, 66 percent of those surveyed said that

                                                                                                   THE NEXT RETAIL REVOLUTION            7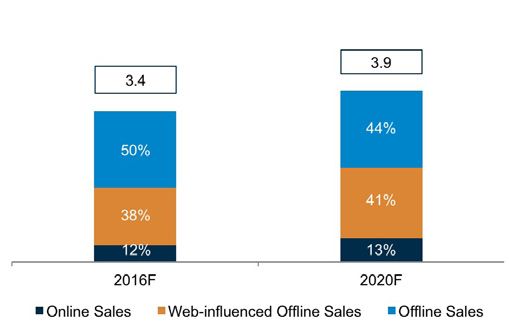
Exhibit 5
                                               US Consumer Sentiment on Inventory Transparency and Availability

    Source: IBM “Consumer Expectations Study,” 2016

    if an out-of-stock item could not be found at an alternate location                             Off-price and fast fashion retailers have made some of the greatest
    of their first-choice retailer, they would forfeit one or more future                           strides in supply chain optimization. Those efforts have led to
    shopping trips, compared to just 48 percent in 2011 (Exhibit 5).                                tremendous growth in off-price stores while department stores
    These results confirm that product availability and convenience                                 continue to decline (Exhibit 6). The impact of this shift is especially
    have the potential to make or break consumer relationships.                                     significant in the apparel sector where both department stores and
                                                                                                    apparel manufacturers are seeing a strain on EBITDA due largely
    The growing demand for inventory transparency and easy                                          to apparel deflation as online, off-price and fast fashion sellers offer
    accessibility reflects an overall cultural shift driven by digital                              lower prices for near-equal-quality products. Fast fashion brands
    technology, the internet and social media. Now accustomed                                       like H&M and Zara seem to have mastered the art of turning
    to having up-to-the-minute information and real-time results at                                 fashion inventory quickly to make the latest trends available on a
    their fingertips, today’s consumers want control, customization                                 continuous, rather than seasonal, basis.
    and convenience in every area of their lives. To meet those
    expectations, retailers must embrace a more modern, demand-
    driven approach to supply chain management.

                                                                                            Exhibit 6
                                                   Growth in Department Stores vs. Off-Price Stores 2010–2017E

     4600

     4400

     4200

     4000

     3800

     3600

     2400

     3200
                   2010                  2011                   2012                   2013             2014               2015            2016E             2017E

                                                                       Total Department Stores          Total Off-price Stores

    Source: RBC Capital Markets, “Department Stores & Specialty Softlines – 2017 Outlook”

8
DATA-INFORMED AND DEMAND-DRIVEN MODERNIZING TO COMPETE WITH GIANTS
Macy’s McLendon Hardware
At the beginning of 2017, Macy’s committed to tagging The family-owned business operating stores in seven
100 percent of its inventory with RFID technology by the cities around the Puget Sound area of Washington
end of the year in order to track inventory movement needed to dramatically improve its inventory
at a granular level. Already, that initiative has increased management and warehouse operations to compete
inventory accuracy, decreased mark-downs, improved with Home Depot and Lowes. By implementing a
display consistency across stores and increased full- modern warehouse management system, it was able to
price sales by 2.6 percent. consolidate store deliveries, reduce warehouse staff by
30 percent and eliminate the need for manual in-store
DeFacto inventory counts. The small company offers more than
The fashion retailer located in 11 European, Middle 100,000 distinct products through its e-commerce
Eastern and African countries consistently struggled site and brick-and-mortar locations, and the new
with excess ordering, resulting in high mark-downs system has enabled it to better ensure its supply meets
and eroding margins. The business was relying on old consumer demand. In April 2017, the business was
systems and spreadsheet-based forecasting methods. acquired by Central Network Retail Group of Memphis
It needed a modern method for predicting demand. with a vision of facilitating growth regionally and beyond.
DeFacto opted for a cloud-based solution that integrated
with its legacy systems but offered new data-collection
and forecasting tools. Products were segmented into
two categories: fast fashion and fashion basics, the The grocery sector is also experiencing a significant off-price
latter having a longer shelf life. Demand forecasts were impact, as discount competitors and dollar stores present
calculated separately for each category and considered discounts up to 15 percent lower than private-label products from
a wide range of variables such as style and color. In established grocers and up to 200 percent lower than name-brand
the first six months of implementation, DeFacto saw products. Furthermore, two highly successful German discount
an 85 percent increase in shelf availability, a 24 percent grocers, Aldi and Lidl, have recently announced plans to open
reduction in out-of-stock items and $7 million in additional approximately 2,000 stores in the U.S. by 2022.
revenue from store-to-store transfers.
Opportunities
While consumer loyalty seems more uncertain than ever,
implementing a demand-driven supply chain, inventory
Supply chain efficiencies and consumer demand for better
transparency and faster ways to get goods to buyers, including
bargains have enabled the growth of off-price retailers across
click-and-collect options, can help to increase customer
multiple segments. Already, off-price stores outnumber
retention and sales.
department stores, but that variance is expected to increase even
more as off-price retailers build to more than 5,000 locations Traditional demand forecasting models take a long-term
nationwide. Collectively, TJX Companies, Inc. (including T.J.Maxx, approach, looking at aggregate sales — as opposed to
Marshall’s and HomeGoods), Ross Stores, Burlington and demand — on a monthly or quarterly basis to inform inventory
Nordstrom Rack’s expansion plans include 2,400 new locations. decisions up to a year in advance. This approach can yield
highly inaccurate results because sales don’t necessarily predict
T.J.Maxx sales grew 6.4 percent in 2015 to more than $30 billion.
demand, and many variables can change over the course of a
President and CEO Ernie Herrman is hopeful the brand will reach
year. Alternatively, demand sensing (as opposed to forecasting)
$40 billion soon. Marshall’s and HomeGoods saw strong growth
uses technology to gather large quantities of real-time consumer
through 2016 as well. The company’s leaders attribute this
data and assess behavioral patterns. Social media, RFID and
success to an extensive global structure that has helped them
beacon technology are all relatively new sources of consumer
deliver new products to consumers in record time.
data that can be combined with information from point-of-sale
(POS) and inventory management systems to inform a demand-
driven approach and create a shorter supply chain.
THE NEXT RETAIL REVOLUTION 9In addition to adopting demand-driven supply chains,
retailers can improve customer retention by offering inventory
transparency and convenient product access.
HIGH-TECH TRANSPARENCY
In the same IBM study mentioned above, 79 percent of Nordstrom
respondents in 2016 said they would still buy from their first- The company has integrated its main website and
choice retailer if an out-of-stock item could be found at an the Nordstrom app with its inventory management
alternate location, compared to only 66 percent in 2011. system, allowing customers to find products all in one
Additionally, click-and-collect options have the high potential to place and either have them delivered or made available
generate additional purchases in-store at the time of pickup. for pickup at the location of their choice. Through its
Per a 2016 Internet Retailer survey of online consumers, of those click-and-collect model Nordstrom customers can
who made click-and-collect purchases within the last year, 48 buy online based on real-time, in-store inventory and
percent bought additional items at the time of pick up at pick up purchases as little as one hour later instead of
least some of the time. waiting 2–3 days for shipping or paying high same-day
or next-day shipping costs. The program has helped
In January 2016, eMarketer reported that in-store pickups are
the company improve both online and in-store sales.
accounting for a growing percentage of e-commerce sales,
In 2015, Nordstrom generated 20 percent of its sales
particularly for big-box retailers. In 2015, buy-online-pickup-in-
online, up from just 8 percent in 2010. A study by L2
store (BOPUS, another term for click-and-collect) purchases
found that an in-store pickup model resulted in sales
accounted for more than 30 percent of Sam’s Club sales, more
exceeding the original bill value by 7 percent on average.
than 22 percent of Kmart sales and nearly 12 percent of Best
Buy’s. This trend is driven partly by discounts offered for BOPUS
purchases, which save retailers on shipping, but also by greater
online inventory transparency. Shoppers can confirm product Drive significant results with practical approaches.
availability online before investing in a trip to the store.
10Exhibit 7
Metropolitan Areas With the Most Store Closures 2015–2017E (in square feet)
Neighborhood and
Power
Community Center Malls Total
Centers
Retail
Philadelphia 655,677 195,068 1,046,998 1,897,743
Houston 168,666 318,504 767,000 1,254,170
Chicago 623,720 403,717 149,000 1,176,437
Central New Jersey 682,130 268,124 - 950,254
Long Island 452,158 251,470 193,530 897,158
Boston 65,605 358,541 432,923 857,069
Detroit 42,610 15,000 767,000 824,610
San Diego 334,186 86,375 385,000 805,561
Northern New Jersey 669,411 134,132 - 803,543
St. Louis 164,598 376,378 180,000 720,976
Seattle 335,420 40,000 310,679 686,099
Los Angeles 545,562 79,917 - 625,479
Dallas 145,513 132,085 347,000 624,598
New Orleans - 110,112 456,000 566,112
Charlotte - 223,276 340,517 563,793
Total Top 15 4,885,256 2,992,699 5,375,647 13,253,602
Total Primary Metros 9,981,903 6,342,463 9,433,061 25,757,427
Total Tertiary Metros 3,173,804 3,173,804
Source: Reis, “Impact of Large Chain Store Closures on Retail Rents”
RETAIL REAL ESTATE More than 13 million square feet of retail space was eliminated
between 2015 and July 2017 in the top 15 cities for store
Threats closures alone (Exhibit 7). In terms of square feet, Sports
There’s a rising sentiment that the U.S. is “overstored,” having Authority contributed the biggest cuts in 2016 at 8 million, or 28
more brick-and-mortar retail locations than shoppers can percent of total closure square footage, due to its bankruptcy.
support. Over the past several years, many department stores Macy’s was second with 6.7 million square feet, and Kmart was
have made significant closures to reduce operating costs and third at 4.3 million.
raise capital.
The loss of big-name anchor locations impacts surrounding
According to a report by the International Council of Shopping retailers as well, and some locations are at risk of becoming
Centers (ICSC), more than 2,000 stores closed in 2016, and “ghost malls.” In fact, in 2013 the nation’s oldest shopping mall,
by the first quarter of 2017 that number had already been Rhode Island’s historic Arcade Providence, established in 1828,
surpassed. Sears / Kmart, Macy’s and Walmart were among was converted to an upscale apartment complex.
the biggest names to announce widespread closures in 2016.
THE NEXT RETAIL REVOLUTION 11Exhibit 8
15 Most Over-Retailed US Metro Areas 2017–2022, by Retail Stock per Capita
Sum of 2017 Retail Sum of 2022 Retail Sum of
Location
Stock per Capita Stock per Capita Change
Myrtle Beach 95 85 (10)
Huntington 80 82 2
Toledo 75 78 3
Lubbock 74 69 (5)
Charleston, WV 74 75 1
Mansfield 73 76 3
Roanoke 70 69 (1)
Jackson 69 70 1
Burlington 68 69 1
South Bend 67 72 5
Youngstown 67 69 2
Racine 67 68 1
Knoxville 66 67 1
Utica 66 68 2
Portland, ME 66 67 1
Source: A&M Insights
One way to measure whether an area is “overstored” or “over- key for retailers is to focus real estate investments on primary
retailed” is to evaluate retail stock, or square footage, per capita. business objectives. Depending on a retailer’s market position
The top 15 over-retailed cities in the U.S. have a retail stock per and goals, opportunities may exist to:
capita (RSPC) of 66 or greater in 2017, which is well above the
national average of 53 (Exhibit 8). • Expand in relatively under-retailed areas
Opportunities • Optimize brick-and-mortar facilities
Brick-and-mortar is by no means dead. In fact, about 90
• Consolidate strategically
percent of all retail sales are still generated at brick-and-mortar
locations and will be for the foreseeable future. Nielsen’s Total While some cities have a relatively high retail stock per capita,
Consumer Report July 2017 edition notes, “For the first time in others fall below the national average (Exhibit 9). As noted
over a decade, shoppers actually took more trips to stores last earlier, many department stores are closing locations, but off-
year than in the year prior.” price retailers are on track to have more than 5,000 locations
sooner rather than later (Exhibit 6). While many community and
While the U.S. overall may be overstored, from market
regional shopping centers are anchored by department and
to market the measure varies significantly. Furthermore,
big-box brands, other retailers sell goods and services that
different brick-and-mortar locations have different competitive
consumers need quickly and frequently. Hardware stores, delis,
advantages. Some may offer high-traffic brand exposure while
pharmacies, salons and grocers, for example, still have a distinct
others may be best positioned for distribution and delivery. The
advantage in brick-and-mortar.
12Exhibit 9
15 Least Over-Retailed US Metro Areas 2017–2022, by Retail Stock per Capita
Sum of 2017 Retail Sum of 2022 Retail Sum of
Location
Stock per Capita Stock per Capita Change
Los Angeles 39 39 0
Provo 38 38 0
Visalia 38 38 0
San Diego 38 38 0
Honolulu 38 37 (1)
Stockton 38 38 0
McAllen 37 37 (1)
New York 37 37 0
Salinas 37 37 0
San Jose 37 36 (1)
Santa Cruz 36 36 0
Lebanon 36 36 0
Madera 36 36 0
Greeley 35 32 (3)
Bakersfield 32 32 0
Source: A&M Insights
Exhibit 10
Even online retailers recognize that some needs are better met Home Improvement Sales vs. Stores 2007–2015
with a physical presence. In a microtrend known as “clicks-
to-bricks,” online eyeglass seller Warby Parker, men’s clothing
manufacturer Bonobos and, most notably, Amazon, among
others, have invested in brick-and-mortar locations to either
provide customers a more tangible shopping experience or to
better position inventory for faster distribution. The integration
of GPS technology in smartphones has also given rise to new
forms of marketing based on a customer’s physical location at
any given time, making physical presence and proximity that
much more valuable to retailers.
Still, some brick-and-mortar locations were built to meet
consumer needs and behavior patterns that have long
since changed and are not likely to return. In those cases,
consolidating strategically can still have positive potential in the
form of higher sales per store and liquid capital. For example,
from 2007 to 2015, the home improvement industry witnessed
a 10 percent reduction in stores. However, sales per store
Data Source: RBC Capital Markets, “Home Improvement Sector is Alive and Well; Lots of
increased by approximately 22 percent (Exhibit 10). Legs Left to the Cycle”
THE NEXT RETAIL REVOLUTION 13CONCLUSION
CONSOLIDATING FOR GREATER CAPITAL Consumer behavior in the 21st century is driven by higher-than-
ever demands for convenience, control and customization.
While today’s consumers still desire shopping experiences that
Sears
“excite the mind,” they expect those experiences to be available
In 2015, Sears completed a real estate investment
across multiple channels anytime, anywhere. Foregoing a digital
trust (REIT) transaction, creating Seritage Growth
presence is simply not an option for retailers who want to remain
Properties to manage the redeployment of its retail
viable now and into the future. In fact, digital firms are far more
assets. Seritage currently owns 266 properties
likely to be considered superior or “industry leaders” than non-
totaling over 42 million square feet of leasable
digital firms (Exhibit 11).
space. Third-party retailers are driving new traffic
and customers to the properties and, in 2016, were Digital technology is not only extending brand reach and enabling
renting at 4.5 times the rate of what Sears paid. more convenient and more personalized shopping experiences,
Sears plans to use proceeds to reduce obligations it’s also helping to optimize supply chains, improve inventory
and generate cash. Sears Holdings CFO Jason management and streamline processes. Retailers that can
Hollar said in 2016, “We will continue to focus on our focus both their front- and back-end digital strategies have an
best stores as part of our shift to a member-centric opportunity to improve performance across the entire value chain.
integrated retail model. As we reduce our overall
store base, we believe we will inevitably end up with While digital technology has permeated nearly every aspect of
stores that are profitable, operate at a small loss or our lives, brick-and-mortar is not dead. Fresh, original in-store
have a clear path to profitability.” experiences are still in demand for many segments, and as
mobile and geo-based technologies grow, physical storefronts
can meet new demand for tangible shopping experiences and
fast distribution if positioned and scaled appropriately.
Learn how to maximize every transaction.
Consumer behavior is changing fast, but it’s not the first time.
Retailers can either succumb as new trends in omnichannel
commerce, supply chain management and retail real estate
threaten the status quo, or they can seize the opportunity to change
and become the industry icons of this century’s retail revolution.
Exhibit 11
Performance Comparison of Digital Firms vs. All Firms
Source: Capgemini, “Organizing for Digital: Why Digital Dexterity Matters”
NOTE: Percentages indicate share of firms that respondents report to be “Better than most” or “An industry leader” relative to their competitors or industry.
14REFERENCES
1. “7-Eleven, Inc. Success Story.” SuccessStory.com. Success 16. Gasiorek, Agnieska. “VulcanoBuono Gamifies Malls with
Story. Web. 11 July 2017. Beacons.” Kontakt.io. Kontakt.io, 5 November 2015. Web.
26 July 2017.
2. Braun, Stephanie. “The History of Retail: A Timeline.”
Lightspeed. Lightspeed, 8 May 2015. Web. 11 July 2017. 17. Getting, Brian. “Basic Definitions: Web 1.0, Web 2.0, Web
3.0.” Practical Ecommerce. Practical Ecommerce, 18 April
3. Britt, Phil. “Three Ways Beacon Technology Personalizes the 2007. Web. 21 July 2007.
In-Store Experience.” Insights. Samsung, 10 January 2017.
Web. 24 July 2017. 18. Hartmans, Avery. “15 Fascinating Facts You Probably Didn’t
Know About Amazon,” Business Insider. Business Insider, 9
4. Carr, Austin. “Nike CEO Mark Parker on His Company’s April 2017. Web. 11 July 2017.
Digital Future: Body-Controlled Music, Color-Coded Heart
Rates.” Fast Company. Fast Company, 12 February 2013. 19. Heitner, Darren. “Just Do Digital: Nike’s Fundamental Shift to
Web. 9 August 2017. Direct-to-Consumer.” Forbes. Forbes, 2 August 2016. Web.
9 August 2017.
5. “Chick-fil-A: Chick-fil-A App.” Case Studies. Mobile
Marketing Association, 2014. Web. 26 July 2017. 20. “Higher Sales and Lower Markdowns Using Solvoyo.”
Solvoyo, 2016.
6. “comScore Reports $109 Billion in Q4 2016 Total Digital
U.S. Retail E-Commerce Spending, Up 18% vs. Year Ago.” 21. “History of the Sears Catalog.” Sears Archives. Sears, 21
comScore, 13 February 2017. Web. 9 August 2017. March 2012. Web. 20 July 2017.
7. “Consumer Expectations Study.” IBM, 2016. 22. “In-Store Pickups Account for Significant Ecommerce
Sales.” eMarketer. eMarketer, 25 January 2016. Web. 24
8. Denham, Barbara Byrne and Victor Calanog. “Is the U.S. July 2017.
Over-Retailed?” Reis, June 2017.
23. “James Ritty.” OhioHistoryCentral.org. Ohio History Central,
9. Denham, Barbara Byrne and Scott Rappaport. “Impact of 11 July 2017. Web. 11 July 2017.
Large Chain Store Closures on Retail Rents.” Reis, 2017.
24. Kaplan, David. “Facebook Starts 2017 with 65 Million Local
10. “Digitally Engaged Food Shopper Study.” FMI.org. Food Business Pages.” GeoMarketing. GeoMarketing, 2 February
Marketing Institute and Nielsen, 30 January 2017. Web. 20 2017. Web. 11 July 2017.
July 2017.
25. Klepacki, Laura. “Why Off-Price Retail is Rising as
11. Dua, Tanya. “Facebook Wants to Become the New Mobile Department Stores are Sinking.” Retail Dive. Industry Dive, 1
Storefront, Unveils New Ad Tools for Brands and Retailers.” February 2017. Web. 24 July 2017.
Business Insider. Business Insider, 27 June 2017. Web. 11
July 2017. 26. Lella, Adam. “Number of Mobile-Only Internet Users Now
Exceeds Desktop-Only in the U.S.” comScore. comScore,
12. Freedman, Lauren. “7th Annual Consumer Personalization 28 April 2015. Web. 21 July 2017.
Survey.” MyBuys, 2015.
27. Lella, Adam. “Q3 2015 E-Commerce Jumps 15% Y/Y to
13. Garcia, Krista. “Furniture and Home Goods Retailers and $69.7 Billion in Sales.” comScore. comScore, 20 November
Digital Commerce 2016.” eMarketer, 12 October 2016. 2015. Web. 11 August 2017.
14. Garfield, Leanna. “America’s Oldest Shopping Mall is Now 28. Lella, Adam. “Q3 2016 Digital Commerce Hits $84.3 Billion
a Bunch of Gorgeous Micro-Apartments.” Business Insider. as M-Commerce Accounts for 20% of Sales for the First
Business Insider, 16 February 2017. Web. 14 July 2017. Time.” comScore. comScore, 14 November 2016. Web. 11
August 2017.
15. Gasiorek, Agnieska. “Proximity Drives Loyalty: Almost 99%
of Gino Rossi Consumers Keep Using Its App.” Kontakt.io.
Kontakt.io, 5 May 2015. Web. 26 July 2017.
THE NEXT RETAIL REVOLUTION 1529. “Mall Shoppers Cite ‘More Experiences’ as Reason to Shop 40. Taylor, Glenn. “Macy’s RFID Rollout Improves Inventory
More Often, Glimcher Retail Monitor Finds.” Business Wire. Accuracy, Display Compliance.” Retail Success Stories.
Berkshire Hathaway, 20 May 2013. Web. 14 July 2017. Retail Touchpoints, 19 April 2017. Web. 24 July 2017.
30. McCoy, Kevin. “Are Shopping Malls an Endangered 41. Thomas, Lauren. “Macy’s Looking to ‘Aggressively’ Roll Out
Species?” USAToday. USA Today, 6 June 2017. Web. 14 Its Off-Price Strategy, CEO Gennette Says.” CNBC. NBC
July 2017. Universal, 11 May 2017. Web. 24 July 2017.
31. Meyer, Zlati. “Grocery Chain Aldi to Open Another 900 42. Tirico, Klaudia. “McLendon Hardware Reduces Warehouse
Stores in the U.S.” USAToday. USA Today, 12 June 2017. Staff 30%, Consolidates Store Deliveries.” Retail Success
Web. 24 July 2017. Stories. Retail Touchpoints, 14 April 2017. Web. 24 July 2017.
32. Milnes, Hilary. “How Tech in Rebecca Minkoff’s Fitting 43. Tode, Chantal. “Mobile’s Influence on Offline Sales Continues
Rooms Helped Triple Expected Clothing Sales.” Digiday. to Grow: Forrester.” Retail Dive. Industry Dive, February
Digiday, 23 September 2015. Web. 9 August 2017. 2016. Web. 9 August 2017.
33. Milnes, Hilary. “In the Race to Digitize, Nordstrom and 44. “Total Consumer Report.” Version 1. Nielsen, July 2017.
Macy’s are Neck-and-Neck.” Digiday. Digiday, 7 May 2015.
Web. 26 July 2017. 45. Tu, Janet I. “McLendon Hardware, for Decades a Regional
Fixture, Is Sold to Memphis Firm.” The Seattle Times. The
34. “Organizing for Digital: Why Digital Dexterity Matters.” Seattle Times Company, 4 April 2017. Web. 24 July 2017.
Capgemini, 2015.
46. “Worldwide Retail Ecommerce Sales: eMarketer’s Updated
35. Petersen, Rob. “11 Inspiring Case Studies of Digital Estimates and Forecast through 2019.” eMarketer, 2015.
Transformation.” Biznology. Mike Moran Group, LLC, 28
December 2016. Web. 26 July 2017. 47. Wurmser, Yory. “Key Trends in Ecommerce.” Slideshare.
eMarketer, 22 January 2015. Web. 9 August 2017.
36. Rowinski, Dan. “Digital Commerce Continues to Accelerate
Its Percentage of Retail Sales.” ARC. Applause, 11 April 48. Zaroban, Stefany. “A Closer Look at the Buy Online Pick Up
2017. Web. 11 August 2017. in Store Shopper.” Internet Retailer. Digital Commerce 360,
30 August 2016. Web. 24 July 2017.
37. Sharaf, Ben. “The Best In-Store Digital Experiences.” Decoded:
Contemporary Commerce. Decoded: Contemporary 49. Zaroban, Stefany. “Nike.com Sales Shoot Up 51% in Fiscal
Commerce, 21 July 2016. Web. 9 August 2017. 2016.” Internet Retailer. Digital Commerce 360, 29 June
2016. Web. 9 August 2017.
38. “Shopping Around.” Morgan Stanley, July 2017.
50. Zaryouni, Homa. “Curbside Offers Better Fulfillment with
39. Smith, Aaron. “Record Shares of Americans Now Have In-Store Pickup.” L2 Daily. L2, Inc., 20 January 2016. Web.
Smartphones, Home Broadband.” Fact Tank. Pew Research 24 July 2017.
Center, 12 January 2017. Web. 21 July 2017.
16RELATED A&M INSIGHTS
Why Retailers Can Benefit From RFID in the Supply Chain
October 2016
For years RFID has been the “nearly man” of business, with many organizations perhaps seeing the potential but never quite realizing the
reality of its use. (Third article in a series on future technology trends in the retail supply chain.)
Measuring the True Contribution of Stores in a Digital Retail World
April 2016
Traditional measurement of store profitability tended to be much more straightforward. It required deducting costs from in-store sales and
potentially adding an allocation for supplier contributions. Digital has completely transformed how retailers function, and a new way of
thinking and operating is required that takes into account how stores support the full customer journey.
Understanding Big Data: Retail Therapy for a Long-Term Restructuring Solution?
September 2015
With the growing prevalence of online and mobile shopping, traditional retailers face significant hurdles to effectively compete in the global
marketplace. Adding big data analysis to their toolbox presents an opportunity for retailers to enhance their decision-making process,
improve supply chain management and reduce insolvency levels.
ABOUT THE AUTHORS
MICHAEL SIMONCIC Specializing in enterprise-wide performance improvement for
MANAGING DIRECTOR retail and consumer brands, Mike has worked extensively in
RETAIL AND CONSUMER PERFORMANCE IMPROVEMENT
msimoncic@alvarezandmarsal.com product design, supply chain optimization, store operations and
marketing and has held senior leadership roles with major online
and offline retailers.
JIM WEIGEL With more than 25 years of experience in management
SENIOR DIRECTOR consulting and strategic research, Jim leverages capital markets
INSIGHT CENTER
jweigel@alvarezandmarsal.com experience, deep industry knowledge, macroeconomic expertise
and broad research capabilities to produce comprehensive
insights about company and industry issues and trends.
CRYSTAL L. LAUDERDALE Crystal has extensive experience in strategic communications,
DIRECTOR digital marketing, public relations and social media as well as a
INSIGHT CENTER
clauderdale@alvarezandmarsal.com proven track record of building data-driven strategies to achieve
measurable results in brand awareness, lead generation and
business development.
THE NEXT RETAIL REVOLUTION 17ABOUT THE A&M INSIGHT CENTER
The science of facts, the art of actionable insight. Our mission is to provide our
professionals and our clients with highly relevant, industry-specific, actionable, fact-
based insights derived through proprietary empirical studies and research on a global
basis in order to drive thought leadership and to support business development and
client projects.
Email: insightcenter@alvarezandmarsal.com
Phone: +1 404-260-4156
ANDY PFEFFER
MANAGING DIRECTOR
apfeffer@alvarezandmarsal.com
Global leader for A&M’s Insight Center specializing in designing
and building fact-based business intelligence programs, with
extensive experience in empirical studies such as benchmarking,
maturity, models, surveys, best-practice analysis and research
ABOUT ALVAREZ & MARSAL
Companies, investors and government entities around the world turn to
Alvarez & Marsal (A&M) when conventional approaches are not enough
to activate change and achieve results. Privately-held since 1983, A&M
is a leading global professional services firm that delivers performance
improvement, turnaround management and business advisory services
LEADERSHIP. to organizations seeking to transform operations, catapult growth and
PROBLEM SOLVING. accelerate results through decisive action. Our senior professionals are
VALUE CREATION. experienced operators, world-class consultants and industry veterans
who draw upon the firm’s restructuring heritage to help leaders turn 53208
change into a strategic business asset, manage risk and unlock value at
every stage.
© 2017 Alvarez & Marsal Holdings, LLC. All rights reserved
Follow us on:
A&M has a dedicated retail practice that has worked with retailers
and consumer brands in all sectors, including apparel and department
stores, specialty retail, discount stores and wholesalers, restaurants,
grocers and distributors.
When action matters, find us at: www.alvarezandmarsal.comYou can also read