The objective assessment of the image quality based on the geometrical concentration
←
→
Page content transcription
If your browser does not render page correctly, please read the page content below
E3S Web of Conferences 149, 0 2013 (2020)                                   https://doi.org/10.1051/e3sconf /20201490 2013
RPERS 2019

          The objective assessment of the image quality
          based on the geometrical concentration
          Evgenii A. Maltsev 1,*, Yurii A. Maglinets 2 , and Ruslan V. Brezhnev 2
          1
            Skolkovo Institute of Science and Technology, Bolshoy Boulevard 30, bld. 1, Moscow, 121205,
          Russia
          2
            Siberian Federal University, The Institute of Space and Information Technology, Kirenskogo st. 26,
          Krasnoyarsk, 660074 Russia

                        Abstract. The method of the objective evaluation of the satellite images
                        based on the calculation of the geometrical concentration using
                        triangulation Delaunay is proposed. Such assessment allows to estimate the
                        degree of the image distortion and can be used for indexing and filtration
                        data in the satellite images catalogues.

          1 Introduction
              The important stage of the remote sensing data processing is the search and selection of
          initial data with specific requirements. One of such requirement is minimal number of the
          noise defects, which distorted the satellite image. Photometric distortions of space images
          can be of different nature: imaging equipment interference, the interference associated with
          atmospheric optics, noises in the receiving path of remote sensors. An example of such
          distortions is cloudiness cover for industrial, social and agriculture studied objects.
              In the first case, the distortions can be eliminated by radiometric and atmosphere
          corrections, in the second case the specialist have to taking into account the cloudiness
          during selection of initial data.
              The volumes of remote sensing data rises year by year in the regional and federal
          satellite images warehouses. It requires the development new criteria and metrics for
          searching and filtration huge volumes of the data, with using not only time-spatial
          properties, but using the level of relational structures of images with semantics and
          relationships between objects.
              This paper contains the new metric of the satellite image quality based on the
          geometrical concentration calculation of the segmented objects on the example of
          cloudiness.

          *
              Corresponding author: evgenii.maltsev@gmail.com

    © The Authors, published by EDP Sciences. This is an open access article distributed under the terms of the Creative
    Commons Attribution License 4.0 (http://creativecommons.org/licenses/by/4.0/).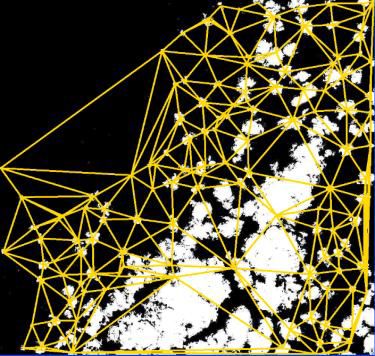
E3S Web of Conferences 149, 0 2013 (2020) https://doi.org/10.1051/e3sconf /20201490 2013
RPERS 2019
2 The measurement of the image quality
The subjective expert assessments are used for estimation of the image quality and for
construction of the objective assessments based on the average scores (mean opinion score -
MOS) [1]. However, today, the objective assessments without experts are most interest,
such as:
Peak Signal to Noise Ratio (PSNR) [2] defined with using Mean Square Error (MSE).
Minkowski distance [3].
Structural SIMilarity (SSIM) [4].
The described above metrics based on comparing of the 2 images: initial and distorted,
but such assessments do not reflect the physiology of human perception. On the other hand,
it is difficult to use such metrics because it is impossible to obtain two satellite images of
the same area with the same conditions.
One of the metric of the satellite image quality is assessment of cloudiness on the
image as criterion of the image distortion. The typical method is following: first stage is
segmentation of image with cloudiness recognition, then the binary mask is built, and after
that the cloudiness percent is calculated using following statement:
S1
P 100% , (1)
S
where P – the cloudiness percent;
S1 – the number of cloudy pixels of the binary image;
S – the total number of pixels of the binary image.
This metric of cloudiness is used in many interfaces of the remote sensing catalogs as
search criterion:
https://gptl.ru/ – Roscosmos Geoportal (Satellite images service).
http://www.ntsomz.ru – Research Center for Earth Operative Monitoring.
http://catalog.scanex.ru – Satellite Image Catalogue of Scanex Company.
http://digitalatlas.ru – Satellite Image Catalogue of Institute of space and informational
technologies of Siberian Federal University.
But this approach does not reflect the cloud distribution in the image [5, 6]. We propose
the objective assessment of the satellite image quality without initial image based on the
geometrical concentration calculation of the segmented objects on the example of
cloudiness.
3 The objective assessment of the image quality based on the
geometrical concentration
The algorithm of the measurement of the satellite image quality based on the cloudiness
detection using geometrical concentration is described in [5,6,7], it considers the cloudiness
as distorted objects.
It can be used for the construction of the objective metric as the search and filtration
criterion in the satellite image catalogue. This metric will allow to estimate the image
quality from the point of view of the human visual perception and its applicability for the
subsequent processing of the image.
2
E3S Web of Conferences 149, 0 2013 (2020) https://doi.org/10.1051/e3sconf /20201490 2013
RPERS 2019
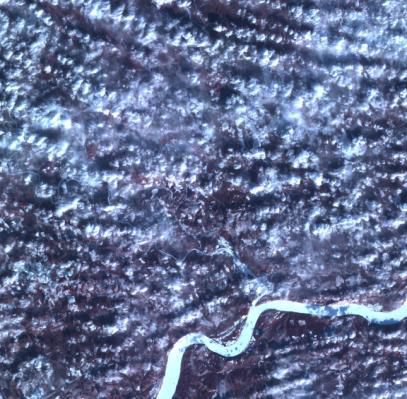
a) b)
Fig. 1. Satellite images: а) Initial satellite image with the cloudiness percent 11%; б) Binary mask of
the cloudiness.
a) b)
Fig. 2. a) Calculated Delaunay triangulation (yellow color); b) Calculated geometrical concentration
(low, middle, high – the gradation of green color accordingly); The binary mask of cloudiness – white
color; background – black color;
The concept of calculation of the geometrical concentration and density of objects
based on the using the Delaunay triangulation, also Voronoi diagram can be applied [10].
The first stage of image processing is segmentation for detection of the objects of
cloudiness with using algorithm for the clouds extraction [5], with the binary mask of
cloudiness creation. The next step is the Delaunay triangulation construction using binary
mask of cloudiness (Fig. 2a). The next step is the geometrical concentration calculation.
The coefficient of the geometrical concentration of the objects on the plane сi(ti) [8,9] is
calculated using statement (2) for the estimation of the clouds distribution in the satellite
image Fig.3.
ª㨟㨤㨴
ŧ㨴 㨿 㨴 ᩛ , (2)
㨟㨤㨴
where ti– the target class of object; NSi – the triangular area of the geometrical centers of
three target objects (clouds), which are located at the minimum Euclidian distance from
each other; NSi – the sum of the objects areas.
3
E3S Web of Conferences 149, 0 2013 (2020) https://doi.org/10.1051/e3sconf /20201490 2013
RPERS 2019
Fig. 3. Calculation of the geometrical concentration of the objects on the plane.
The measurement of triangulation elements with using (2) allows to detect of the
images regions with high, middle and low geometrical concentration of objects (Fig. 2b).
The thresholds for the calculation of geometrical concentration were obtained after the
images analysis of the satellite image catalogue [7]:
0 – 0,05 low geometrical concentration C1;
0,05 – 1 middle geometrical concentration C2;
1 – max high geometrical concentration C3.
The objective metric for the search and filtration of the images in the satellite image
catalogue will be calculated as a ratio of a middle and high concentration area of a
cloudiness to a total area of whole image:
㨤㨮 ڶ ₩ 㨤㨮ڷ
㨜ᩛ ܫڴڴڵ, (3)
㨤㨬
where Sc2 – middle concentration area;
Sc3 – high concentration area;
Sa – total area of the whole image.
The calculated metric K for Fig.2 is equal = 38% but the cloudiness percent P = 23%.
a) b)
Fig. 4. Satellite images with the cloudiness percent 11%.
The calculated metric for the image on the Fig. 4a K = 77%, but for the image on the
Fig. 4b K = 43%. In spite of the equality of the cloudiness percent for the images on the
Fig.4, the metric K shows the difference of the image distortion by cloudiness. The
comparison of the K values for the Fig. 4a and Fig. 4b shows that image on the Fig. 4b is
less distorted and more appropriated for the subsequent image processing.
4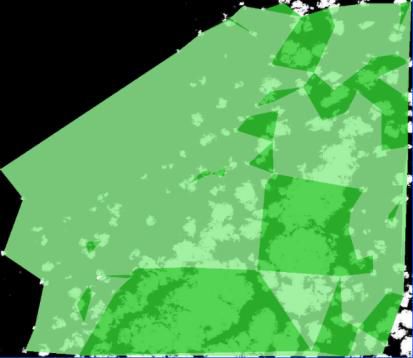
E3S Web of Conferences 149, 0 2013 (2020)                                https://doi.org/10.1051/e3sconf /20201490 2013
RPERS 2019

              This K estimation shows the degree of the image distortion by defects and can be built-
         in into the interface of the satellite images catalogue as an addition metric for the data
         filtrations.

         4 Conclusion
             New metric based on the geometric concentration calculation can be implemented as the
         search and filtration criterion in the satellite images catalogue. Such metric will allow to
         estimate the image quality from the point of view of the human visual perception and its
         applicability for the subsequent processing of the image.
             The implementation this metric as the filtration criterion will simplify to selection
         satellite images by operators, it will lead to decline of the number of the unappropriated
         images with big value of metric K, on the other hand it can increase the number of target
         images with the big cloudiness percent but with low K value.

             The reported study was funded by Russian Foundation for Basic Research (No. 18-47-
         242002), Government of the Krasnoyarsk Territory, Krasnoyarsk Regional Fund of
         Science, to the research project: «The development of technology for creating intelligent
         information systems of object-oriented monitoring of territories based on remote sensing
         data».

         References
          1.  ITU-T. Recommendation P.800.1. Methods for objective and subjective assessment of speech
              and video quality. Mean opinion score (MOS) terminology, (2006).
          2. R.C. Gonzalez; R.E. Woods. Digital Image Processing. Pearson Education, New Jersey. (2008)
          3. S.Bandyopadhyay, S. Saha. Similarity Measures. In: Unsupervised Classification. Springer,
              Berlin, Heidelberg. pp 59-73 (2013)
          4. Z. Wang, A.C. Bovik, H.R. Sheikh, E.P. Simoncelli. Image quality assessment: from error
              visibility to structural similarity. IEEE Transactions on Image Processing. 2,no.4. pp. 600 –
              612. (2004)
          5. E.A. Maltsev, E.E. Sirotin, D.A. Perfil’ev, G.M. Tsibulskii. Extracting a Cluster of Clouds in
              the SPOT Satellite Images // Pattern Recognition and Image Analysis. Advances in
              Mathematical Theory and Applications. Vol. 21, №. 2. pp. 501–504. (2011) DOI:
              10.1134/S1054661811020714.
          6. E.A. Maltsev, E.E. Sirotin, D.A. Perfil’ev, G.M. Tsibulskii The Cloud Cover Measurement of
              the Spot-4 Satellite Images. Journal of Siberian Federal University. Engineering &
              Technologies.no.2,vol.5.pp.229-242 (2011)
          7. E.A. Maltsev. Development of algorithms of remote sensing data processing for recognition of
              agriculture spatial objects with linear geometry structure. PhD thesis. 05.13.17 / E.A. Maltsev.
              Krasnoyarsk (2017).
          8. D.A Perfil’ev, G. M. Tsibulskii. Segments concentration area of metallographic images of
              distorted aluminum alloys. The journal “Vestnik of SibGAU”. vol. 6. pp. 30 – 32.(2007)
          9. D.A. Perfil’ev, Y.A. Maglinets, G.M. Tsibulskii Family of Models for Describing One Class of
              Metallographic Images. Pattern Recognition and Image Analysis. Advances in Mathematical
              Theory and Applications. vol.19, no.2. pp. 334-341.(2009)
          10. F.P. Preparata, M.I. Shamos. Computational geometry. An introduction. Springer-Verlag, New
              York, (1985).

                                                          5
You can also read