The Problems with Troubled Families: Rethinking the Analysis Behind the 120,000 Troubled Families Statistic - Cambridge University ...
←
→
Page content transcription
If your browser does not render page correctly, please read the page content below
Social Policy & Society: page 1 of 19
                 © The Author(s), 2021. Published by Cambridge University Press. This is an Open Access article, distributed under the terms of the
                 Creative Commons Attribution licence (https://creativecommons.org/licenses/by/4.0/), which permits unrestricted re-use, distribution, and
                 reproduction in any medium, provided the original work is properly cited. doi:10.1017/S1474746421000725

                 The Problems with Troubled Families: Rethinking the Analysis
                 Behind the 120,000 Troubled Families Statistic
                 Matt Barnes∗                   and Andy Ross∗∗
                 ∗
                  Department of Sociology, City University of London, London, UK
                 E-mail: matt.barnes@city.ac.uk (contact author)
                 ∗∗
                  Department of Epidemiology and Public Health, University College London, London, UK
                 E-mail: andy.ross.13@ucl.ac.uk

                 In the aftermath of the 2011 England riots, the then Prime Minister David Cameron
                 referred to a ‘small number of families as the source of a large number of problems in
                 society’ (Cameron, 2011). Soon after, the Troubled Families Programme was set up by the
                 government to ‘turn around’ 120,000 troubled families. Despite government rhetoric
                 focusing on ‘neighbours from hell’ (ibid.) the initial estimate of the number of troubled
                 families did not include any indicators of problematic behaviours, such as crime or anti-
                 social behaviour. Instead, a measure previously used by government to classify families
                 with multiple social and economic disadvantages was used (Social Exclusion Task Force,
                 2007a). This article revisits the research behind the initial identification of the 120,000
                 troubled families and explores more widely the overlap between families with multiple
                 social and economic disadvantage and their engagement in problematic behaviours. Our
                 reanalysis of the original research data reveals that although families experiencing multiple
                 social and economic disadvantage were at an increased risk of displaying problematic
                 behaviour, only a small minority did so.

                 Keywords: Troubled families, multiple disadvantage, policy-based evidence, survey data
                 analysis.

                        Introduction
                 This year marks a decade since the England Riots of 2011 and the subsequent introduction
                 of the Troubled Families Programme. In this article we look back to the inception of the
                 Troubled Families Programme, and the survey data and methodology used by the
                 government to identify how many ‘troubled families’ existed in the UK and should be
                 targeted by the programme. We critique the approach used to measure the number of
                 troubled families, using the same data and analysis employed by the government to show
                 why that methodology was flawed. We argue that this is important for the following
                 reasons. First, it draws attention to the need for the careful application of quantitative
                 methods when conducting evidence-based policy making, which can have implications
                 for the budget allocated to the policy programme (crudely put, the cost of the policy
                 intervention multiplied by the target number of policy recipients), as well as how the
                 targeted population (‘troubled families’ in this case) are defined and hence viewed by

                                                                                                                                                        1

Downloaded from https://www.cambridge.org/core. IP address: 46.4.80.155, on 24 Jan 2022 at 06:35:24, subject to the Cambridge Core terms of use, available at
https://www.cambridge.org/core/terms. https://doi.org/10.1017/S1474746421000725
Matt Barnes and Andy Ross
policy makers, the media and the public. A reminder of the importance of definitional and
measurement precision in the evidence used in policy making is also timely; something
that needs continuous consideration in the climate of reactive policy making (particularly
relevant given the speed of social change in a pandemic).
The first phase of the Troubled Families Programme ran from 2011-2015, targeting
120,000 troubled families, which is the statistical estimate that is the focus of this article.
The second phase of the programme was expanded, running from 2015-2021, to target
400,000 troubled families. As we go on to show, the government’s methodology was more
appropriately detailed than that used in phase 1. Most recently, the next phase of the
programme – renamed ‘Supporting Families’ – has been announced and will run from
2021 (MHCLG, 2021). It is not clear from government documentation how many families
this new phase will target.
Background to the Troubled Families Programme (phase 1)
In December 2011, in the aftermath of the riots that had happened across cities and towns
in England in August of the same year, David Cameron spoke about plans to improve
services for ‘troubled families’, a group the government presented as the root cause behind
the riots. In his speech he indicated that the government knew exactly how many troubled
families there were:
Last year the state spent an estimated £9 billion on just : : : 120,000 troubled families across the
country : : : . We are committing £448 million to turning around the lives of 120,000 troubled
families by the end of this Parliament : : : (Cameron, 2011)
Knowing how many troubled families there were implied that the government already
had a working definition of a ‘troubled family’, which Cameron went on to explain in his
speech:
That’s why today, I want to talk about troubled families. Let me be clear what I mean by this
phrase. Officialdom might call them ‘families with multiple disadvantages’. Some in the press
might call them ‘neighbours from hell’. Whatever you call them, we’ve known for years that a
relatively small number of families are the source of a large proportion of the problems in
society. Drug addiction. Alcohol abuse. Crime. A culture of disruption and irresponsibility that
cascades through generations. (ibid.)
In actual fact, these 120,000 families had been identified as a target for policy
intervention a year earlier, when the government introduced ‘Community Budgets’. This
policy allowed local authorities to pool resources and offer multi-agency, joined-up
solutions for tackling families with complex social needs such as education, health and
housing (DCLG, 2010). Following the riots, the focus of Community Budgets changed and
the government launched the Troubled Families Programme, overseen by the Troubled
Families Unit. The programme aimed to help the 120,000 troubled families to ‘turn their
lives around’ through reducing youth crime and anti-social behaviour; getting children
back into school, putting adults on a path back to work; and, reducing the high costs these
families placed on the public sector each year (DCLG, 2012a). The focus now was much
more on the problems that these families caused rather than the problems they were
2
Downloaded from https://www.cambridge.org/core. IP address: 46.4.80.155, on 24 Jan 2022 at 06:35:24, subject to the Cambridge Core terms of use, available at
https://www.cambridge.org/core/terms. https://doi.org/10.1017/S1474746421000725Behind the 120,000 Troubled Families Statistic
experiencing. The government produced figures to argue that troubled families cost the
tax payer an estimated £9 billion per year, with the majority of that being spent on
‘protecting the children in these families and responding to the crime and anti-social
behaviour they perpetrate’ (DCLG, 2012b).
Background to the troubled families statistic
The 120,000 troubled families statistic was not created alongside the introduction of the
Troubled Families Programme. In fact it was taken from government research conducted
by the Social Exclusion Task Force in 2007 (SETF, 2007a, 2007b). SETF had morphed out
of the Labour government’s Social Exclusion Unit in 2006 to provide the government with
strategic and policy advice on service provision for the most disadvantaged members of
society – specifically those with combinations of entrenched social and economic
hardships, such as unemployment, poor skills, low incomes and family breakdown
(Cabinet Office, 2010).
In 2007, SETF led a cross-Whitehall review on ‘families at risk’; a shorthand term for
families (with children) that had multiple, entrenched and reinforcing social and eco-
nomic disadvantages. As part of the background research to this review, SETF conducted
in-house research to help identify how many multiply-disadvantaged families there were.
The SETF research found that 2 per cent of families with children in Britain experienced
multiple disadvantage – defined as having five or more from a list of seven social and
economic disadvantages – which equated to around 120,000 families in England.
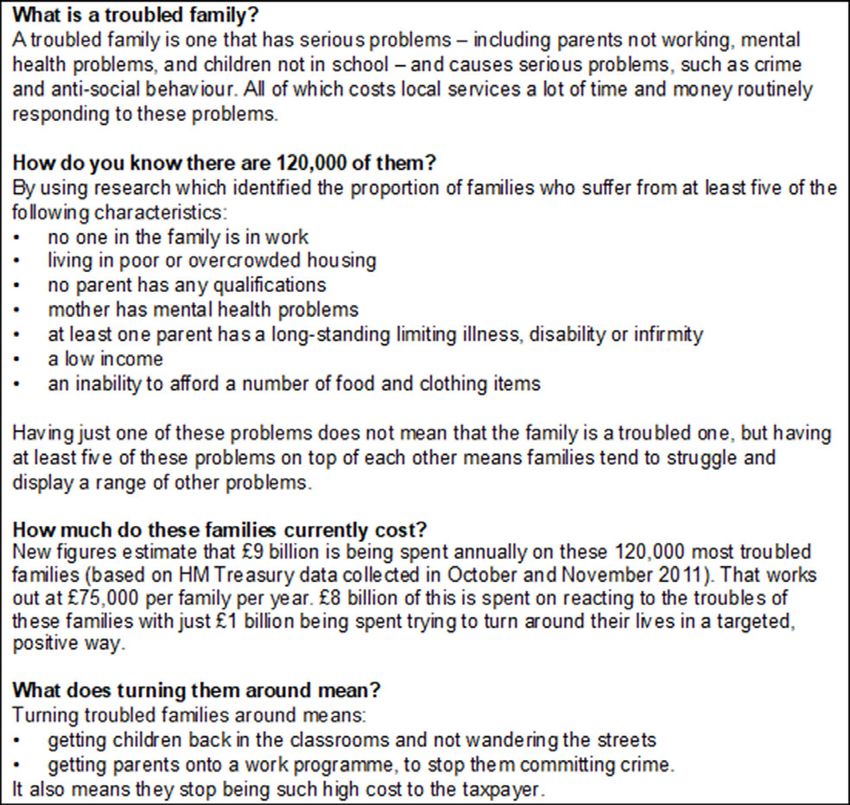
This statistic was then used by the Troubled Families Unit in 2012 to identify the
number of troubled families. This can clearly be seen on the front page of the Troubled
Families Unit website (Figure 1). It explained what a troubled family was and how many
troubled families there were (Department for Education, 2011) – exactly replicating the
methodology used in the SETF research.
The Troubled Families Unit website explicitly stated that ‘A troubled family is one that
has serious problems, including parents not working, mental health problems, and
children not in school – and causes serious problems, such as crime and anti-social
behaviour’ (bold text by authors for emphasis) (ibid.). However, there was no evidence
from the SETF research to suggest that families experiencing multiple social and economic
disadvantage were also displaying problematic behaviours such as crime and anti-social
behaviour. Supplementary analysis by SETF did show that a range of poor child outcomes
was more frequent for multiply-disadvantaged families but still only present for a minority
of these families (Social Exclusion Task Force, 2007a). Even then the analysis only showed
associations and not a causal relationship.
As is evident from the list of criteria used to characterise a troubled family on the
Troubled Families Unit website, the measure identifies the number of families who
experienced multiple social and economic disadvantage. It does not include any infor-
mation about whether they are displaying problematic behaviours, such as crime and anti-
social behaviour. Hence it does not match with the notion of what a troubled family is
according to the Troubled Families Unit, and particularly the notion portrayed in
government rhetoric associating troubled families with the causes of the riots. This
apparent oversight has been discussed before, with the adoption of the SETF analysis
by the Troubled Families Unit being widely condemned as a bad use of data1 (Crossley,
2016; Levitas, 2012; Portes, 2012; Spicker, 2013).
3
Downloaded from https://www.cambridge.org/core. IP address: 46.4.80.155, on 24 Jan 2022 at 06:35:24, subject to the Cambridge Core terms of use, available at
https://www.cambridge.org/core/terms. https://doi.org/10.1017/S1474746421000725Matt Barnes and Andy Ross
Figure 1. Troubled families unit website front page
In this article we reanalyse the same dataset used in the SETF analysis, and add to
the existing discussion of the troubled families statistic by incorporating indicators of
problematic behaviour, such as crime and anti-social behaviour, which were not
included in the original analysis. Our overarching aims are twofold. First, we explore
the validity of that original estimate, and discuss how well the measure of 120,000
troubled families fits with the government definition of what a troubled family is. We
discuss why the SETF analysis was used as the basis of the 120,000 troubled families
statistic given its obvious methodological limitations. Secondly, we explore the
overlap between families experiencing multiple social and economic disadvantage
and families that display problematic behaviour, such as crime and anti-social
behaviour. We seek to answer how many of the 120,000 troubled families (erroneously
measured by government as families with multiple social and economic disadvan-
tages) were actually displaying the kinds of problematic behaviour implied by
government rhetoric.
4
Downloaded from https://www.cambridge.org/core. IP address: 46.4.80.155, on 24 Jan 2022 at 06:35:24, subject to the Cambridge Core terms of use, available at
https://www.cambridge.org/core/terms. https://doi.org/10.1017/S1474746421000725Behind the 120,000 Troubled Families Statistic
Methodology
To explore the overlap between multiple social and economic disadvantage and problematic
behaviour we revisit the same dataset used in the SETF research subsequently adopted as the
120,000 troubled families statistic – the Families and Children Study (FACS). Using this same
dataset, we aim to illustrate the additional insights that further analysis could have provided
the government when evidencing the number, and behaviours, of troubled families prior to
the inception of the Troubled Families Programme.
The data: Families and Children Study (FACS)
The Families and Children Study (FACS) is a panel survey of the living standards of British
families with dependent children. The study began in 1999 and interviewed approxi-
mately 7,000 families2 annually until 2008. Information was mainly collected from the
mother (or main carer) about herself, her partner (where present) and her children.
Children aged ten to fifteen years were also asked to answer a self-completion question-
naire away from their parents’ gaze. The survey covered topics such as income, work,
housing, health, education and child behaviours (Hoxhallari et al., 2007). We use FACS
data from the 2005 survey – the same dataset used in the SETF research.
Measuring multiple social and economic disadvantage – replicating the 120,000
troubled families statistic
First, the seven indicators of social and economic disadvantage were reproduced to match
the analysis produced by SETF (SETF, 2007a, pp.62-64). The percentage of families with
each form of disadvantage varies from 4 per cent (mother had mental health illness or
disorder) to 18 per cent (family living on low income) (Table 1). The 120,000 troubled
families statistic is derived from the families that had five or more disadvantages (2 per
cent). The total number of families with dependent children in Britain in 2005 was
approximately 7 million (Hoxhallari et al., 2007) and 2 per cent of this is 140,000, which
provides an estimate of the number of families with five or more disadvantages in Britain.
This number was recalculated for England as 117,000 families. When the Troubled
Families Unit used this number it was rounded up to give the 120,000 troubled families
statistic (Department for Education, 2011).
Although the SETF analysis of families with multiple social and economic disadvan-
tages was not designed to identify the number of ‘troubled families’, the methodology used
was not without criticism. It provides no theoretical basis to the choice of the seven
disadvantage indicators selected or the way they were constructed. Furthermore, the
thresholds used to measure each of the disadvantage indicators were not explained; for
example, why it is important to lack two or more food and clothing items rather than three
or more. A similar argument can be made with the threshold used to identify multiple
social and economic disadvantage. There is no justification as to why having five or more
disadvantages is critical – rather than having, say, four, or six disadvantages. Additionally,
a simple count assumes that each disadvantage has the same impact on the family, and
that the compounding effect on the family is linear.
The SETF report claimed that this analysis helped underpin a focus on families facing
a number of social and economic disadvantages such as poverty, bad housing and other
5
Downloaded from https://www.cambridge.org/core. IP address: 46.4.80.155, on 24 Jan 2022 at 06:35:24, subject to the Cambridge Core terms of use, available at
https://www.cambridge.org/core/terms. https://doi.org/10.1017/S1474746421000725Matt Barnes and Andy Ross
Table 1 Percentage of families with separate and multiple indicators of social and
economic disadvantage
Indicator of disadvantage %
Below 60% of median equivalised total family income, before housing costs 18
Living in temporary, overcrowded or unfit accommodation 16
No parent in paid work 14
No parent has any academic qualifications 11
Would like to have but cannot afford two or more food and clothing items 6
At least one parent has limiting longstanding illness, disability or infirmity 6
Mother has a mental health illness or disorder 4
Number of disadvantages family has
0 61
1 or 2 30
3 or 4 8
5 or more (the ‘120,000 troubled families’) 2
Unweighted sample size (=100%) 6,989
Base. Families with dependent children in Britain
Source. Families and Children Study (FACS) 2005, authors’ own calculations
forms of deprivation – which arguably it does. However, the report also suggests that these
are families that displayed signs of ‘poor parenting’ and ‘poor models of behaviour that
can have an impact on children’s development and wellbeing, with significant costs for
public services and the wider community’ (SETF, 2007a, p1). However, no evidence was
provided to support this claim.
Despite the criticisms of the SETF research, we have replicated their measure here,
using the same FACS data, in order to examine how many of these families displayed
problematic behaviour, particularly the types of behaviour used in government rhetoric to
describe troubled families, such as criminal and anti-social behaviour.
Measuring ‘problematic behaviour’
Despite the 120,000 troubled families statistic being based on a definition of multiple social
and economic disadvantage that did not include any measure of problematic behaviour, such
as crime and anti-social behaviour, the FACS survey did in fact collect such information. We
align our approach to measuring problematic behaviour with that of the Troubled Families
Programme itself. The Troubled Families Programme used a payment-by-results system to
incentivise local authorities to ‘turn around’ troubled families. Local authorities were told how
to identify ‘troubled families’ in their local area and given a list of expected numbers of
families by the Troubled Families Programme (extrapolated from the 120,000 troubled
families statistic). Troubled families were identified according to four criteria:
1. Involved in crime and anti-social behaviour
2. Had children not in school
3. Had an adult on out of work benefits
4. Caused high cost to the public purse
6
Downloaded from https://www.cambridge.org/core. IP address: 46.4.80.155, on 24 Jan 2022 at 06:35:24, subject to the Cambridge Core terms of use, available at
https://www.cambridge.org/core/terms. https://doi.org/10.1017/S1474746421000725Behind the 120,000 Troubled Families Statistic
A troubled family should meet all of the first three criteria. However, if the number of
troubled families identified was less than the number expected, a local authority was
instructed to use their discretion to include other families who met any two of the first three
criteria plus criteria four (DCLG, 2012c). In this article we attempt to measure the Troubled
Families Programme definition (above) with the FACS data. Where there was no clear
match between the Troubled Families Programme and FACS, we consider what was
implied by government rhetoric, and reciprocated in certain elements of the media, as
problematic behaviours: in other words, the Troubled Families Programme criteria 1 and 2
– crime and anti-social behaviour, and truanting.
Below we provide more detail of the criteria used by the Troubled Families
Programme to identify troubled families along with its closest operationalisation using
data from the FACS survey. As discussed earlier, the emphasis of the Troubled Families
Programme, and the criteria used to define a ‘troubled family’, changed in later years as
the programme expanded (DCLG, 2014). We use the initial definition of a ’troubled
family’ from the inception of the Troubled Families Programme in 2012 (phase 1) as this
was the definition used for the 120,000 troubled families statistic.
1. Involved in crime and anti-social behaviour
Troubled Families Programme criteria:
Identify young people involved in crime and families involved in anti-social behaviour, defined
as:
– Households with one or more under eighteen-year-old with a proven offence in the last twelve
months
AND/OR
– Households where 1 or more member has an anti-social behaviour order, anti-social
behaviour injunction, anti-social behaviour contract, or where the family has been subject
to a housing-related anti-social behaviour intervention in the last twelve months (such as a
notice of seeking possession on anti-social behaviour grounds, a housing-related injunction,
a demotion order, eviction from social housing on anti-social behaviour grounds – or
comparable measure) (DCLG, 2012c, p.4)
‘Equivalent’ indicator in FACS:
• Mother (main carer) reports child (aged eight to eighteen years) has had a formal
warning, fine or conviction from the police within the last twelve months
2. Had children not in school
Troubled Families Programme criteria:
Identify households affected by truancy or exclusion from school, where a child:
– Has been subject to permanent exclusion; three or more fixed school exclusions across the last
three consecutive terms;
OR
– Is in a Pupil Referral Unit or alternative provision because they have previously been
excluded;
OR
– Is not on a school roll;
AND/OR
7
Downloaded from https://www.cambridge.org/core. IP address: 46.4.80.155, on 24 Jan 2022 at 06:35:24, subject to the Cambridge Core terms of use, available at
https://www.cambridge.org/core/terms. https://doi.org/10.1017/S1474746421000725Matt Barnes and Andy Ross
– A child has had 15% unauthorised absences or more from school across the last three
consecutive terms (DCLG, 2012c, p.4)
‘Equivalent’ indicator in FACS:
• Mother (main carer) reports child (aged five to fifteen years) has been suspended at
least once, expelled, or played truant from school for at least half a day in the last
twelve months
3. Had an adult on out of work benefits
Troubled Families Programme criteria:
Identify households which have an adult on Department for Work and Pensions out of work
benefits
– Employment and Support Allowance (only introduced in 2008)
– Incapacity Benefit
– Carer’s Allowance (Invalid Care Allowance)
– Income Support
– Jobseekers Allowance
– Severe Disablement Allowance (DCLG, 2012c, p.5)
‘Equivalent’ indicator in FACS:
• Family claims at least one out of work benefit (Income Support; Jobseekers Allow-
ance; Incapacity Benefit; Severe Disability Allowance; Carer’s Allowance)
4. Cause high cost to the public purse
Troubled Families Programme criteria:
Use this local discretion filter to add families that meet any two of the above three criteria
(1. Involved in crime and anti-social behaviour; 2. Had children not in school; 3. Had an adult
on out of work benefits), and are a cause for concern. Those who are high cost and those with
health problems could include:
Families containing a child who is on a Child Protection Plan or where the local authority is
considering accommodating them as a looked after child
Families subject to frequent police call-outs or arrests or containing adults with proven
offences in the last twelve months, such as those who have been in prison, prolific and
priority offenders, or families involved in gang-related crime
Families with health problems. Particular priority health problems which you should
consider include:
– Emotional and mental health problems
– Drug and alcohol misuse
– Long term health conditions
– Health problems caused by domestic abuse
– Under eighteen conceptions (DCLG, 2012c, p.4)
8
Downloaded from https://www.cambridge.org/core. IP address: 46.4.80.155, on 24 Jan 2022 at 06:35:24, subject to the Cambridge Core terms of use, available at
https://www.cambridge.org/core/terms. https://doi.org/10.1017/S1474746421000725Behind the 120,000 Troubled Families Statistic
‘Equivalent’ indicator in FACS:
• Family has used social/welfare services3 in last twelve months OR Mother (or main
carer) has mental health problem OR At least one parent has long-term limiting health
problem OR Mother drinks more than thirty-five units of alcohol every week OR
Teenage mother
The range of behaviours captured in FACS reflects, to some degree, the broad criteria
targeted by the Troubled Families Programme. However it is clear that not all of the criteria
are captured in the survey. For example, FACS does not ask parents about their own anti-
social behaviour (criterion 1), and hence we can only consider the unlawful behaviours of
children. Nevertheless this does reflect much of the government rhetoric after the riots and
during the introduction of the Troubled Families Programme, which focused on the
deviant behaviour of children and young people in particular (Churchill, 2015). Nor does
FACS capture the more extreme high cost behaviours such as health issues caused by
domestic abuse, and drug misuse (criterion 4).
It is also important to point out that some of the FACS indicators are far more lenient
than the corresponding Troubled Families Programme definition. For example, the FACS
indicator for criterion 2 ‘Had children not in school’ includes ‘truanting from school for a
single half day in the past twelve months’, whereas the Troubled Families Programme
focuses on children with more persistent or permanent records of not being at school.
Consequently, our estimate of this from FACS is very likely to be an overestimate of that
implied by the Troubled Families Programme.
Analytical approach
The analysis was carried out using FACS data on families with dependent children in
Britain in 2005, where a dependent child was defined as any resident child aged sixteen or
under, or aged seventeen or eighteen and in full-time education. We re-constructed the
measure of multiple social and economic disadvantage used for the 120,000 troubled
families statistic, along with indicators that approximate definitions used in the Troubled
Families Programme. We explored the associations between multiple social and eco-
nomic disadvantage and Troubled Families Programme criteria descriptively. Using
logistic regression we specifically investigated the association between multiple social
and economic disadvantage and problematic behaviours, such as crime and anti-social
behaviour, when controlling for standard socio-demographic characteristics of families.
The FACS data was downloaded from the UK Data Service (NatCen/DWP, 2011) and
analysed with the Statistical Package for the Social Sciences (SPSS).
Results
How many families matched the Troubled Families Programme criteria?
The number of families displaying behaviours that approximate the Troubled Families
Programme conditions (either meets all of criteria 1-3, or meets two of criteria 1-3 and 4)
was approximately 2 per cent of all families4 (Table 2).
Focussing more on problematic behaviours (criteria 1 and 2), just 1 per cent of
families had a child that had a warning, fine or conviction from the police, and 5 per cent
9
Downloaded from https://www.cambridge.org/core. IP address: 46.4.80.155, on 24 Jan 2022 at 06:35:24, subject to the Cambridge Core terms of use, available at
https://www.cambridge.org/core/terms. https://doi.org/10.1017/S1474746421000725Matt Barnes and Andy Ross
Table 2 FACS indicators of the Troubled Families Programme criteria
% of all
Troubled families Programme criteria families
1. Involved in crime and anti-social behaviour
Family with child (aged 8-18 years) who has had warning, fine or conviction 1%
from the police in the last 12 months
2. Had children not in school
Family with child (aged 5-15 years) who has been suspended, expelled or 5%
played truant on at least one half-day in the last 12 months
3. Had an adult on out of work benefits
Family claims at least one out of work benefit (Incapacity Benefit, Carer’s 16%
Allowance, Income Support/Jobseekers Allowance, Severe Disablement
Allowance)
4. Caused high cost to the public purse
Family has used social/welfare services OR Mother (or main carer) has mental 22%
health problem OR At least one parent has long-term limiting health problem
OR Mother drinks more than 35 units of alcohol in an average week OR
Teenage mother
A family meeting the Troubled Families Programme definition either meets all 2%
of criteria 1-3, or meets two of criteria 1-3 and 4
Unweighted sample size (=100%) 6,989
Base. Families with dependent children in Britain
Source. Families and Children Study (FACS) 2005, authors’ own calculations
of families had a child who had been suspended, expelled or played truant from school
(predominantly the latter, for at least half a day in the last twelve months). Higher
proportions of families were claiming out of work benefits (16 per cent) or accessing
social/welfare services (22 per cent), reflecting levels of disadvantage and the prevalence
of families in scope of receiving such support in society.
It is also worth remembering that the FACS indictors do not map perfectly onto the
Troubled Families Programme definitions. Often the indicators are a softer measure than
the Troubled Families Programme proposed, meaning these are likely overestimates of the
troubled families definition.
How many families experiencing multiple social and economic disadvantage (the
120,000 troubled families) were displaying problematic behaviours?
Putting aside measurement differences, the percentage of all families coming under the
Troubled Families Programme definition was actually very similar to the percentage of
families who experienced multiple social and economic disadvantages – 2 per cent. The
question that we seek to answer here is whether, according to the FACS data, these are the
same families – in other words, were the multiply-disadvantaged families used as the basis
for the 120,000 troubled families statistic the same set of families implied as the
perpetrators of problematic behaviour?
10
Downloaded from https://www.cambridge.org/core. IP address: 46.4.80.155, on 24 Jan 2022 at 06:35:24, subject to the Cambridge Core terms of use, available at
https://www.cambridge.org/core/terms. https://doi.org/10.1017/S1474746421000725Behind the 120,000 Troubled Families Statistic
Table 3 Percentage of families displaying Troubled Families Programme criteria accord-
ing to the number of social and economic disadvantages families had, cell per cent
Number of social and economic
disadvantages family had
5+ (the
120,000
Troubled Families Programme troubled All
criteria None 1-2 3-4 families) families
Families that were displaying all ofMatt Barnes and Andy Ross
and 4 because they match closely with the types of social and economic disadvantage
captured by the SETF definition. Workless and low income families are likely to be
claiming out-of-work benefits (relevant to TFP criterion 3), and disproportionately likely to
have long-term health issues (relevant to TFP criterion 4), and families with a number of
social and economic disadvantages are likely to be using social or welfare services
(relevant to TFP criterion 4). It is clear then that the Troubled Families Programme headline
statistic – that there were 120,000 troubled families – was much more likely to be
capturing families with multiple social and economic problems than families displaying
problematic behaviours such as crime and anti-social behaviour. This point is supported
by the government’s own independent evaluation of the Troubled Families Programme.
Local authority data showed that just over one in ten families on the Troubled Families
Programme had an adult or child with a police caution or conviction, and a similar
proportion were involved in anti-social behaviour (DCLG, 2017).
What is the association between multiple social and economic disadvantage and
problematic behaviour, controlling for other characteristics of families?
In a final step we used logistic regression analysis to assess the relationship between
multiple social and economic disadvantage and problematic behaviour, when controlling
for some key socio-demographic and geographic variables. Here we focus on problematic
behaviour of children because, as noted above, much of the rhetoric surrounding the
120,000 troubled families was concerned with these types of behaviours. Also, as
previously discussed, these indicators were not included in the original government
measure, and hence this analysis can be used to further explore the strength of the link
between social and economic disadvantage and problematic behaviour
We ran a set of regression models where the outcome was one of:
• Family had a child involved in crime and anti-social behaviour: Family with child (aged
eight to eighteen years) who has had warning, fine or conviction from the police in the
last twelve months (yes/no)
• Family had a child not in school: Family with child (aged five to fifteen years) who has
been suspended, expelled or played truant on at least one half-day in the last twelve
months (yes/no)
• Family had a child involved in crime and anti-social behaviour and family had a child
not in school (yes/no)
Each outcome was regressed on a measure of the number of social and economic
disadvantages a family had, defined as none, one or two disadvantages; three or four
disadvantages; or, five or more. The models control for standard socio-demographic
characteristics of families – family type, number of dependent children, age of youngest
child, ethnic group of mother/carer, and geographic location. These models are not an
attempt to identify the main drivers of problematic behaviour – many of which were not
collected as part of FACS, such as low empathy, family conflict, associating with
delinquent peers, and experiencing feelings of alienation (Ross et al., 2011) – but are
instead a further exploration of the relationship between social and economic disadvan-
tage and problematic behaviour. Results are presented in Table 4.
The regression analysis confirms the descriptive analysis presented in the previous
table, that, even when controlling for a standard set of socio-demographic characteristics
12
Downloaded from https://www.cambridge.org/core. IP address: 46.4.80.155, on 24 Jan 2022 at 06:35:24, subject to the Cambridge Core terms of use, available at
https://www.cambridge.org/core/terms. https://doi.org/10.1017/S1474746421000725Behind the 120,000 Troubled Families Statistic
Table 4 Families with children involved in crime/anti-social behaviour, and/or children
not in school, Logistic regression, Odds ratios
Number of social and economic Crime/ Not in Crime/ASB, and, not
disadvantages the family has: ASB school in school
1 or 2 2.78*** 2.11*** 3.65***
3 or 4 11.94*** 3.70*** 15.77***
5 or more (the ‘120,000 troubled families’) 15.72*** 3.42*** 16.18***
Unweighted sample size 6,958 6,916 6,634
Notes. Models control for: family type, number of dependent children, age of youngest child, ethnic
group of mother/carer, and geographic location
Crime/ASB: Family with child (aged 8-18 years) who has had warning, fine or conviction from the
police in the last 12 months
Not in school: Family with child (aged 5-15 years) who has been suspended, expelled or played
truant on at least one half-day in the last 12 months
***pMatt Barnes and Andy Ross
be at the forefront of the rhetoric surrounding the Troubled Families Programme – namely,
families displaying criminal and anti-social behaviour (Crossley, 2016; Levitas, 2012;
Portes, 2012; Spicker, 2013). Our reanalysis of the same dataset has also shown that
although families with multiple social and economic disadvantages were at an increased
risk of displaying problematic behaviours, such as crime and anti-social behaviour, only a
small minority did so. Not only did the government analysis used to estimate the number
of troubled families not include indicators of problematic behaviour, such as crime and
anti-social behaviour, when the measure is recalibrated to better reflect that definition, it
shows that only a small number of families that experienced multiple social and economic
disadvantage also displayed problematic behaviour. For example, only 6 per cent of
families with five or more social and economic disadvantages had children involved in
crime and anti-social behaviour, and only 14 per cent had children not in school. As only
a minority of families with multiple social and economic disadvantages displayed
problematic behaviours, it is difficult to argue that multiple disadvantage is a key driver
of these behaviours. As Sayer (2017: 160) states, ‘ : : : (multiple) difficulties do not
necessarily lead to the pathologies highlighted in the TFP discourse: the relationship is
probabilistic rather than deterministic’.
Given the relatively small overlap between multiple social and economic disadvan-
tage and problematic behaviour, we have to consider other reasons why the SETF research
was used as the headline statistic for the Troubled Families Programme. One argument is
that the use of the SETF research is an example of ‘policy-based evidence’ (Cairney, 2019).
The government’s strategy to tackle crime and anti-social behaviour, using research that
underpinned family policy making, represents the continuation of a long history of
government interest in the monitoring and regulating of families that are perceived to
be the source of a number of social problems in society (Gregg, 2010). In relatively recent
times governments have labelled these families as ‘problem families’, ‘the underclass’,
examples of ‘broken Britain’, ‘chaotic families’ (Macnicol, 2017; Lambert, 2019), and
more recently, ’families with complex needs’ and ‘troubled families’ (Cameron, 2010).
Many of the philosophies underpinning the labelling of these families have had a similar
focus; that of poverty, worklessness, delinquency, unworthiness, inter-generational con-
tinuities, and the social and economic cost to society (Welshman, 2013; Lambert and
Crossley, 2017). This vision was continued into the Conservative-led coalition govern-
ment’s family policies, with troubled families characterised as dysfunctional parents
negatively impacting on their children’s outcomes. Consequently these families were
targeted in an attempt to change behaviour and get families ‘back on track’ (Eisenstadt and
Oppenheim, 2019).
This perspective is supported when referring back to the policy report from which the
SETF research was taken. Whilst the focus of that report, which predated the Troubled
Families Programme, was on the complex needs of a small minority of families who faced
multiple and entrenched social and economic problems, elements of it hinted at a
recognition of a group of ‘problematic’ families (SETF, 2007a). The narrative described
the outcomes for children growing up in families with multiple social and economic
disadvantages, some of which included ‘problematic behaviours’ such as school exclu-
sion, and being in trouble with the police (the SETF report drew on evidence from HMT/
DfES, 2007).
Linking multiple social and economic disadvantage to problematic behaviour, such
as crime and anti-social behaviour, risks distorting and stigmatising the actions of the poor
14
Downloaded from https://www.cambridge.org/core. IP address: 46.4.80.155, on 24 Jan 2022 at 06:35:24, subject to the Cambridge Core terms of use, available at
https://www.cambridge.org/core/terms. https://doi.org/10.1017/S1474746421000725Behind the 120,000 Troubled Families Statistic
(Levitas, 2012; Hoggett and Frost, 2018). Welshman (2013) has raised the issue of the
Troubled Families Programme problematising certain family conditions, such as mental
health and worklessness, in particular. As Butler (2014: 420) says ‘It is what the Troubled
Families Programme has contributed to our thinking about those in troubled families that
matters, not what it has done for the families concerned, nor even what it has done to
make savings from the public purse’. Conflating data on families with multiple social and
economic disadvantages with rhetoric about problematic behaviour led to the stigmatising
of these families in both policy and media circles (Crossley, 2018).
Another, albeit more practical, reason that the SETF research was used as the estimate
of the number of troubled families is that the government did not have time to undertake,
or commission, a new piece of analysis to calculate this number. The Troubled Families
Programme was established in 2012 as a reaction to the England riots which began in
early August 2011. Just days later David Cameron spoke about the government ‘fight-
back’, and the first public mention of the government’s commitment to ‘turn around the
lives of the 120,000 most troubled families in the country’ (Cameron, 2011). Given that
there was only very limited time for new research, the statistic had to be taken from
existing evidence. The 120,000 statistic was ready-made, having been previously used by
government to identify families with complex needs for the ‘Community Budgets’
intervention – one of the suite of family policies used to target social problems such as
health and housing, but which did include mention of anti-social behaviour (DCLG,
2010).
A headline statistic on the number of troubled families may have been seen to
strengthen the government’s response to the riots at a time when the public were looking
for an authoritative reaction. It enabled the government to take control of the narrative
surrounding the riots and its causes, particularly given the existence of competing
narratives, some of which represented a significant threat to the government (for example,
that the riots were a natural response to the government’s austerity programme). The
government located the cause as external to current government policy, and by evidenc-
ing the exact number of ‘troubled families’ gave significant credibility to this claim. It was
an acknowledgement that the government not only knew that these troubled families
existed, but also that they knew how many of them there were.
It is important to note that the operational definition of a troubled family has changed
since the inception of the Troubled Families Programme. In June 2013 the Government
announced plans to administer the Troubled Families Programme for a further five years
from 2015/16 (DCLG, 2013)5. To be eligible for phase 2 of the programme a family
needed to have at least two of the following six problems:
1. Parents and children involved in crime or anti-social behaviour
2. Children who have not been attending school regularly
3. Children who need help: children of all ages, who need help, are identified as in need
or are subject to a Child Protection Plan
4. Families affected by domestic violence and abuse
5. Adults out of work or at risk of financial exclusion or young people at risk of
worklessness
6. Parents and children with a range of health problems (including but not exclusively
drug or alcohol abuse)
15
Downloaded from https://www.cambridge.org/core. IP address: 46.4.80.155, on 24 Jan 2022 at 06:35:24, subject to the Cambridge Core terms of use, available at
https://www.cambridge.org/core/terms. https://doi.org/10.1017/S1474746421000725Matt Barnes and Andy Ross
This approach used an expanded definition of a troubled family which included
domestic violence and ‘children in need’, as well as identifying families with health
problems. Given that only two of the six criteria are needed to be characterised as a
troubled family, the likelihood of labelling as ‘problematic’ families with multiple social
and economic disadvantages remains – for example, workless families with health
problems (criteria 5 and 6). The definition therefore continues to suggest that social and
economic disadvantage should be viewed as problematic behaviours in the same way as
crime and anti-social behaviour is.
As part of this plan the Government calculated that an additional 400,000 families
across England were in scope of the programme. This involved a new calculation of the
number of troubled families, using a more detailed methodology than was used to identify
the original 120,000 troubled families. This time indicators of problematic behaviour such
as crime and anti-social behaviour were incorporated into the derivation of the headline
statistic that identified how many troubled families the programme was targeting. The
calculation incorporated analysis of FACS data, using some of the measures we have
included in our research. Where FACS did not contain data to measure particular criteria –
for example, criterion 4 ‘Families affected by domestic violence and abuse’ – the gaps
were filled using other surveys and administrative data (DCLG, 2014). This raises the
question as to why this more detailed methodology was not used for the initial estimation
of the number of troubled families when the Troubled Families Programme was an-
nounced in 2011. Instead the SETF research on families with multiple social and
economic disadvantages was used, which sparked the criticisms that followed.
Conclusion
This article has reiterated how the 120,000 troubled families statistic was taken from
government research on families with multiple social and economic disadvantages. As
others have pointed out previously, as a consequence of this, the methodology behind the
120,000 troubled families statistic included no indicators of problematic behaviours such
as crime and anti-social behaviour.
Our reanalysis of the data behind the 120,000 troubled families statistic has shown
that although families with multiple social and economic disadvantages were at an
increased risk of displaying problematic behaviour – such as crime and anti-social
behaviour, and truancy – only a small minority did so. Louise Casey, Head of the
Troubled Families Programme, acknowledged that the 120,000 troubled families statistic
was ‘about families with multiple and complex needs rather than families that caused
problems’ (Casey, 2013) and at the Public Accounts Committee hearing into the evalua-
tion of the Troubled Families Programme, Casey defended the government’s use of the
120,000 troubled families statistic, saying:
: : : The 120,000 figure – which a number of critics, but not too many, have a problem with –
was the starting point of some of the difficulties for people involved in criticising the
programme. : : : In fairness to the Government, I would say the best proxy they had was the
old Social Exclusion Unit data – the family survey data – which I think was then owned by the
Department for Education, which gives you, more or less, this figure of 120,000 across a load of
cohorts. I do not think it is unreasonable that when we were developing with them what they
wanted to evidence by ‘turned around’, they took the 120,000 figure. We then went out to local
16
Downloaded from https://www.cambridge.org/core. IP address: 46.4.80.155, on 24 Jan 2022 at 06:35:24, subject to the Cambridge Core terms of use, available at
https://www.cambridge.org/core/terms. https://doi.org/10.1017/S1474746421000725Behind the 120,000 Troubled Families Statistic
authorities and said, ‘In terms of kids who aren’t in school, families that are committing
antisocial behaviour, and worklessness, as well as another high-cost indicator should you need
it, can you stack that number up?’ – and they could. The criticism that has sometimes come in is
that we were criminalising troubled families. (House of Commons, 2016b)
The government could have staved off some methodological criticism of the use of
the 120,000 troubled families statistic if they had incorporated measures of ‘problematic
behaviour’ into their calculation of the number of troubled families. Our analysis has
shown that a more thorough analysis of the FACS data prior to the introduction of the
Troubled Families Programme would have provided the government with evidence of the
relatively weak link between ‘multiple disadvantage’ and ‘problematic behaviour’. This in
turn may well have changed the basis of economic calculations that underpinned the
programme, and some of the misleading rhetoric around ‘troubled families’.
The SETF research should not have been used by the government to quantify the
number of troubled families that were the focus of the original Troubled Families
Programme. The statistic does not capture the definition it implies. Furthermore it implies
an association between multiple social and economic disadvantage and problematic
behaviours that evidence from that same dataset suggests is weak at best. Nor should the
troubled families statistic have been the basis for which local authorities were told how
many troubled families to ‘turn around’. Nor should that number have been used to help
cost the funding required for the Troubled Families Programme. The 120,000 troubled
families statistic was not a good foundation for policy making.
Acknowledgements
This research was funded by a British Academy/Leverhulme Small Research Grant. The
research benefited from the advice of a small advisory group comprised of Professor Dick
Wiggins, Dr Stephen Crossley, Matt Ford and Jonathan Portes. We are very grateful for
their helpful input. We would also like to thank the reviewers for their careful, constructive
and insightful comments.
Notes
1 The Troubled Families Programme evaluation itself also received criticism for misleading interpre-
tation of the success of the programme and financial savings to the taxpayer (House of Commons, 2016a).
2 In this article we refer to ‘families with children’ simply as ‘families’, for ease of reading. Where
necessary we state the age of the children in the family; for example, ‘families with school-age children’.
3 Child education support/Child health education/Child and family counselling/Child mentoring/
role model programmes/Home-school liaison/Parenting skills support and/or education/Telephone help
lines for parents/Home visiting one-to-one services/Marriage/relationship support and mediation/Family
learning activities/Family centres.
4 The estimate was also 2 per cent of families with school-aged children, and slightly higher at 3 per
cent of families with children aged eight to eighteen years. Here, and in the rest of the article, we only
present the percentages for all families with dependent children (aged under nineteen) for simplicity, and
given the small differences between these age thresholds.
5 More recently the government announced a further one-year extension of the programme for
2021/22 (HM Treasury, 2020).
17
Downloaded from https://www.cambridge.org/core. IP address: 46.4.80.155, on 24 Jan 2022 at 06:35:24, subject to the Cambridge Core terms of use, available at
https://www.cambridge.org/core/terms. https://doi.org/10.1017/S1474746421000725Matt Barnes and Andy Ross
References
Butler, I. (2014) ‘New families, new governance and old habits’, Journal of Social Welfare and Family Law,
36, 4, 415–25.
Cabinet Office (2010) ‘Social exclusion task force’, updated 23 March, https://webarchive.nationalarchives.
gov.uk/20100407163458/http://www.cabinetoffice.gov.uk/social_exclusion_task_force.aspx
[accessed 10.04.2019].
Cairney, P. (2019) ‘The UK government’s imaginative use of evidence to make policy’, British Politics, 14, 1,
1–22.
Cameron, D. (2010) ‘Speech on families and relationships’, 10 December, https://www.gov.uk/
government/speeches/speech-on-families-and-relationships [accessed 10.04.2019].
Cameron, D. (2011) ‘Troubled families speech’, David Cameron’s speech on plans to improve services for
troubled families, Cabinet Office and Prime Minister’s Office, Published 15 December, https://www.
gov.uk/government/speeches/troubled-families-speech [accessed 10.04.2019].
Casey, L. (2013) ‘Troubled families tsar: intervention programme will free up resources’, The Guardian, 7
April, https://www.theguardian.com/society/2013/apr/07/troubled-families-tsar-intervention-resources
[accessed 10.04.2019].
Churchill, H. (2015) ‘Turning lives around? The Troubled Families Programme’, in L. Foster, A. Brunton, C.
Deeming and T. Haux (eds.), In Defence of Welfare 2, Bristol: Policy Press, 28–31.
Crossley, S. (2016) ‘The ‘troubled families’ numbers game’, Environment and Planning A, 48, 1, 4–6.
Crossley, S. (2018) Troublemakers: The Construction of ‘Troubled Families’ as a Social Problem, Bristol:
Policy Press
Department for Communities and Local Government (DCLG) (2010) 16 areas get ‘community budgets’ to
help the vulnerable, DCLG press release 22 October 2010. Available at https://www.gov.uk/
government/news/16-areas-get-community-budgets-to-help-the-vulnerable [accessed 08.02.2021].
Department for Communities and Local Government (DCLG) (2012a) 2010 to 2015 Government Policy:
Support for Families, Policy Paper, updated 8 May 2015, https://www.gov.uk/government/
publications/2010-to-2015-government-policy-support-for-families/2010-to-2015-government-policy-
support-for-families [accessed 10.04.2019].
Department for Communities and Local Government (DCLG) (2012b) Communities and Local Government
Committee – Ninth Report Taking forward Community Budgets, https://publications.parliament.uk/pa/
cm201012/cmselect/cmcomloc/1750/175002.htm [accessed 08.02.2021].
Department for Communities and Local Government (DCLG) (2012c) The Troubled Families Programme:
Financial Framework for the Troubled Families Programme’s Payment-by-Results Scheme for Local
Authorities, London: DCLG.
Department for Communities and Local Government (DCLG) (2013) ‘Massive expansion of Troubled
Families Programme announced’, DCLG, https://www.gov.uk/government/news/massive-expansion-
of-troubled-families-programme-announced [accessed 08.02.2021].
Department for Communities and Local Government (DCLG) (2014) Estimating the Number of Families
Eligible for the Expanded Troubled Families Programme, London: DCLG.
Department for Communities and Local Government (DCLG) (2017) National Evaluation of the Troubled
Families Programme 2015–2020: Family Outcomes – National and Local Datasets, London: DCLG.
Department for Education (2011) Families with Multiple Problems, FOI Request, https://www.gov.uk/
government/publications/families-with-multiple-problems/families-with-multiple-problems [accessed
10.04.2019].
Eisenstadt, N. and Oppenheim, C. (2019) Parents, Poverty and the State: Twenty Years of Evolving Family
Policy, Bristol: Policy Press.
Gregg, D. (2010) Family Intervention Projects, London: Centre for Crime and Justice Studies, www.
crimeandjustice.org.uk/publications/family-intervention-projects-classic-case-policy-based-evidence
[accessed 08.02.2021].
18
Downloaded from https://www.cambridge.org/core. IP address: 46.4.80.155, on 24 Jan 2022 at 06:35:24, subject to the Cambridge Core terms of use, available at
https://www.cambridge.org/core/terms. https://doi.org/10.1017/S1474746421000725Behind the 120,000 Troubled Families Statistic
HM Treasury (2020) Spending Review 2020, https://www.gov.uk/government/publications/spending-
review-2020-documents/spending-review-2020 [accessed 08.02.2021].
HM Treasury (HMT) and Department for Education and Skills (DfES) (2007) Policy Review of Children and
Young People: A Discussion Paper, https://dera.ioe.ac.uk/6553/1/cyp_policyreview090107.pdf
[accessed 10.04.2019].
Hoggett, J. and Frost, E. (2018) ‘The Troubled Families Programme and the problems of success’, Social
Policy and Society, 17, 4, 523–34.
House of Commons (2016a) Troubled Families Progress Review, Public Accounts Committee, London: The
Stationery Office.
House of Commons (2016b) Public Accounts Committee Oral Evidence: Troubled Families, HC 711, http://
data.parliament.uk/writtenevidence/committeeevidence.svc/evidencedocument/public-accounts-
committee/troubled-families/oral/41442.pdf [accessed 10.04.2019].
Hoxhallari, L., Conolly, A. and Lyon, N. (2007) Families with Children in Britain: Findings from the 2005
Families and Children Study (FACS), DWP Research Report No. 424, Leeds: Corporate Document
Services
Lambert, M. (2019) ‘Between “families in trouble” and “children at risk”: historicising “troubled family”
policy in England since 1945’, Children and Society, 33, 1, 82–91.
Lambert, M. and Crossley, S. (2017) ‘“Getting with the (troubled families) programme”: a review’, Social
Policy and Society, 16, 1, 87–97.
Levitas, R. (2012) There May Be Trouble Ahead: What We Know About Those 120,000 ‘Troubled Families’,
Bristol: Poverty and Social Exclusion.
Macnicol, J. (2017) ‘Reconstructing the underclass’, Social Policy and Society, 16, 1, 99–108.
Ministry of Housing, Communities and Local Government (MHCLG) (2021) Supporting Families – 2021-22
and Beyond, Policy Paper, 26 March, https://www.gov.uk/government/publications/supporting-
families-2021-to-2022-and-beyond/supporting-families-2021-22-and-beyond [accessed 20.07.2021].
National Centre for Social Research (NatCen) and Department for Work and Pensions (DWP) (2011)
Families and Children Study: Waves 1-10, 1999-2008, [data collection], 9th edn, UK Data Service.
SN: 4427.
Portes, J. (2012) ‘Neighbours from hell’. Who is the prime minister talking about?’, National Institute of
Economic and Social Research Blog, 17 February, https://www.niesr.ac.uk/blog/neighbours-hell-who-
prime-minister-talking-about [accessed 10.04.2019].
Ross, A., Duckworth, K., Smith, D. J., Wyness, G. and Schoon, I. (2011) Prevention and Reduction: A
Review of Strategies for Intervening Early to Prevent or Reduce Youth Crime and Anti-Social
Behaviour, London: Centre for Analysis of Youth Transitions.
Sayer, A. (2017) ’Responding to the troubled families programme: framing the injuries of inequality’, Social
Policy and Society, 16, 1, 155–64.
Social Exclusion Task Force (SETF) (2007a) Reaching Out, Think Family: Analysis and Themes from the
Families at Risk Review, London: Cabinet Office
Social Exclusion Task Force (SETF) (2007b) Families at Risk: Background on Families with Multiple
Disadvantages, London: Cabinet Office
Spicker, P. (2013) ’Troubled families: what is an “official statistic”?’, Radical Statistics, 108, 47–52.
Welshman, J. (2013) Underclass: A History of the Excluded Since 1880, London: Bloomsbury Press.
19
Downloaded from https://www.cambridge.org/core. IP address: 46.4.80.155, on 24 Jan 2022 at 06:35:24, subject to the Cambridge Core terms of use, available at
https://www.cambridge.org/core/terms. https://doi.org/10.1017/S1474746421000725You can also read