The RUSH Exam: Rapid Ultrasound in SHock in the Evaluation of the Critically lll
←
→
Page content transcription
If your browser does not render page correctly, please read the page content below
The RUSH Exam:
Rapid Ultrasound
in SHock in the
E v a l u a t i o n of th e
Critically lll
Phillips Perera, MD, RDMS, FACEPa,*, Thomas Mailhot, MD, RDMSb,
David Riley, MD, MS, RDMSa, Diku Mandavia, MD, FACEP, FRCPCb,c

 KEYWORDS
 ! Rapid ultrasound in shock examination ! RUSH exam
 ! Shock ! Ultrasound

Care of the patient with shock can be one of the most challenging issues in emergency
medicine. Even the most seasoned clinician, standing at the bedside of the patient in
extremis, can be unclear about the cause of shock and the optimal initial therapeutic
approach. Traditional physical examination techniques can be misleading given the
complex physiology of shock.1 Patients in shock have high mortality rates, and these
rates are correlated to the amount and duration of hypotension. Therefore, diagnosis
and initial care must be accurate and prompt to optimize patient outcomes.2 Failure to
make the correct diagnosis and act appropriately can lead to potentially disastrous
outcomes and high-risk situations.
   Ultrasound technology has been rapidly integrated into Emergency Department
care in the last decade. More practicing emergency physicians (EPs) are now trained
in bedside point of care or goal-directed ultrasound, and this training is now included
in all United States Accreditation Council for Graduate Medical Education Emergency
Medicine residency programs.3,4 Furthermore, the American College of Emergency
Physicians (ACEP) has formally endorsed and embraced bedside ultrasound by the
EP for multiple applications.5 This technology is ideal in the care of the critical patient
in shock, and the most recent ACEP guidelines further delineate a new category of

 a
   New York Presbyterian Hospital, Columbia University Medical Center, Division of Emergency
 Medicine, 622 West 168th Street, PH1-137, New York, NY 10032, USA
 b
   LA County1USC Medical Center, Department of Emergency Medicine, General Hospital, 1200
 State Street, Room 1011, Los Angeles, California 90033, USA
 c
   Cedars-Sinai Medical Center, Department of Emergency Medicine, General Hospital, 1200
 State Street, Room 1011, Los Angeles, California 90033, USA
 * Corresponding author.
 E-mail address: pperera1@mac.com (P. Perera).

 Emerg Med Clin N Am 28 (2010) 29–56
 doi:10.1016/j.emc.2009.09.010                                                 emed.theclinics.com
 0733-8627/09/$ – see front matter ª 2010 Elsevier Inc. All rights reserved.
30   Perera et al

     ‘‘resuscitative’’ ultrasound. Studies have demonstrated that initial integration of
     bedside ultrasound into the evaluation of the patient with shock results in a more accu-
     rate initial diagnosis with an improved patient care plan.1,6,7 Instead of relying on older
     techniques, like listening for changes in sound coming from the patient’s body
     suggestive of specific pathology, bedside ultrasound now allows direct visualization
     of pathology or abnormal physiological states. Thus, bedside ultrasound has become
     an essential component in the evaluation of the hypotensive patient.

     CLASSIFICATIONS OF SHOCK

     Many authorities categorize shock into 4 classic subtypes.8 The first is hypovolemic
     shock. This condition is commonly encountered in the patient who is hemorrhaging
     from trauma, or from a nontraumatic source of brisk bleeding such as from the gastro-
     intestinal (GI) tract or a rupturing aortic aneurysm. Hypovolemic shock may also result
     from nonhemorrhagic conditions with extensive loss of body fluids, such as GI fluid
     loss from vomiting and diarrhea. The second subtype of shock is distributive shock.
     The classic example of this class of shock is sepsis, in which the vascular system is
     vasodilated to the point that the core vascular blood volume is insufficient to maintain
     end organ perfusion. Other examples of distributive shock include neurogenic shock,
     caused by a spinal cord injury, and anaphylactic shock, a severe form of allergic
     response. The third major form of shock is cardiogenic shock, resulting from pump
     failure and the inability of the heart to propel the needed oxygenated blood forward
     to vital organs. Cardiogenic shock can be seen in patients with advanced cardiomy-
     opathy, myocardial infarction, or acute valvular failure. The last type of shock is
     obstructive shock. This type is most commonly caused by cardiac tamponade,
     tension pneumothorax, or large pulmonary embolus. Many patients with obstructive
     shock will need an acute intervention such as pericardiocentesis, tube thoracostomy
     or anticoagulation, or thrombolysis.
        At the bedside of a critical patient, it is often difficult to assess clinically which clas-
     sification of shock best fits the patient’s current clinical status. Physical findings often
     overlap between the subtypes. For example, patients with tamponade, cardiogenic
     shock and sepsis (when myocardial depression compounds this form of distributive
     shock) may all present with distended neck veins and respiratory distress. Because
     of this diagnostic challenge, practitioners used to perform Swan-Ganz catheterization
     in hypotensive patients, providing immediate intravascular hemodynamic data.
     Although the data obtained from these catheters was detailed and often helpful at
     the bedside, large studies demonstrated no improvement in mortality in the patients
     who received such prolonged invasive monitoring.9 Swan-Ganz catheterization has
     thus declined in use, and the stage has now been set for development of a noninvasive
     hemodynamic assessment using point of care ultrasound.

     SHOCK ULTRASOUND PROTOCOL: THE RUSH EXAM

     Given the advantages of early integration of bedside ultrasound into the diagnostic
     workup of the patient in shock, this article outlines an easily learned and quickly per-
     formed 3-step shock ultrasound protocol. The authors term this new ultrasound
     protocol the RUSH exam (Rapid Ultrasound in SHock). This protocol involves a 3-
     part bedside physiologic assessment simplified as:
        Step 1: The pump
        Step 2: The tank
        Step 3: The pipes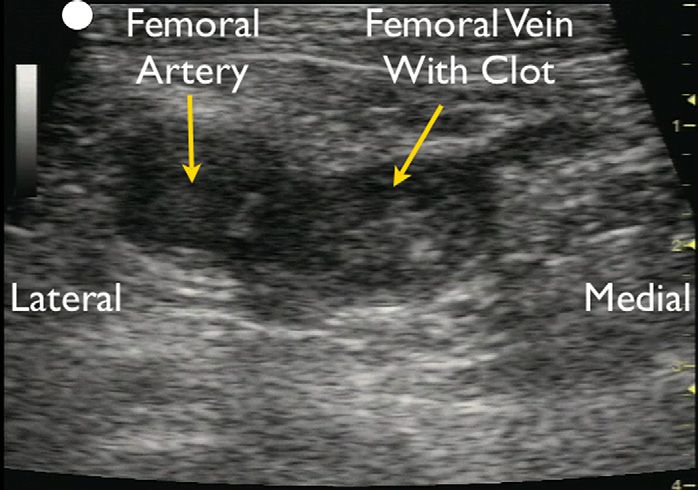
The RUSH Exam       31

   This examination is performed using standard ultrasound equipment present in
many emergency departments today. The authors recommend a phased-array trans-
ducer (3.5–5 MHz) to allow adequate thoracoabdominal intercostal scanning, and
a linear array transducer (7.5–10 MHz) for the required venous examinations and for
the evaluation of pneumothorax.
   The first, and most crucial, step in evaluation of the patient in shock is determination
of cardiac status, termed for simplicity ‘‘the pump’’ (Table 1). Clinicians caring for the
patient in shock begin with a limited echocardiogram. The echo examination is
focused on looking for 3 main findings. First, the pericardial sac can be visualized to
determine if the patient has a pericardial effusion that may be compressing the heart,
leading to a mechanical cause of obstructive shock. Second, the left ventricle can be
analyzed for global contractility. Determination of the size and contractility status of
the left ventricle will allow for those patients with a cardiogenic cause of shock to
be rapidly identified.10,11 The third goal-directed examination of the heart focuses
on determining the relative size of the left ventricle to the right ventricle. A heart that
has an increased size of the right ventricle relative to the left ventricle may be a sign
of acute right ventricular strain from a massive pulmonary embolus in the hypotensive
patient.12,13
   The second part of the RUSH shock ultrasound protocol focuses on the determina-
tion of effective intravascular volume status, which will be referred to as ‘‘the tank.’’
Placement of the probe in the subxiphoid position, along both the long and short
axis of the inferior vena cava (IVC), will allow correct determination of the size of the
vessel. Looking at the respiratory dynamics of the IVC will provide an assessment
of the patient’s volume status to answer the clinical question, ‘‘how full is the

  Table 1
  Rapid Ultrasound in SHock (RUSH) protocol: ultrasonographic findings seen with classic
  shock states

  RUSH       Hypovolemic
  Evaluation Shock               Cardiogenic Shock Obstructive Shock       Distributive Shock
  Pump        Hypercontractile   Hypocontractile     Hypercontractile     Hypercontractile
                heart              heart               heart                heart (early sepsis)
              Small chamber      Dilated heart       Pericardial effusion Hypocontractile
                size                                 Cardiac                heart (late sepsis)
                                                       tamponade
                                                     RV strain
                                                     Cardiac thrombus
  Tank        Flat IVC           Distended IVC      Distended IVC       Normal or small IVC
              Flat jugular       Distended jugular Distended jugular      (early sepsis)
                veins              veins              veins             Peritoneal fluid
              Peritoneal fluid   Lung rockets       Absent lung sliding   (sepsis source)
                (fluid loss)       (pulmonary         (pneumothorax) Pleural fluid (sepsis
              Pleural fluid        edema)                                 source)
                (fluid loss)     Pleural fluid
                                   Peritoneal fluid
                                   (ascites)
  Pipes       Abdominal          Normal              DVT                   Normal
               aneurysm
              Aortic
               dissection

Abbreviations: DVT, deep venous thrombosis; IVC, inferior vena cava; RV, right ventricle.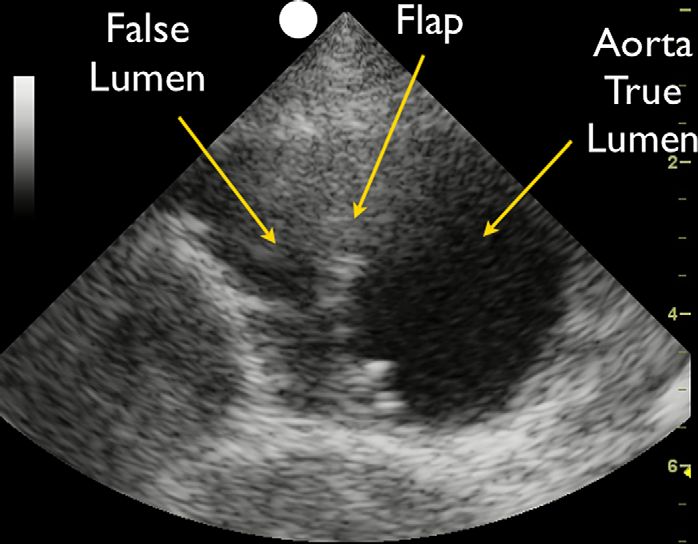
32   Perera et al

     tank?’’14,15 The clinician can also place a transducer on the internal jugular veins to
     view their size and changes in diameter with breathing to further assess volume.16
     Also included in evaluation of the tank is an assessment of the lung, pleural cavity,
     and abdominal cavities for pathology that could signal a compromised vascular
     volume. Integration of lung ultrasound techniques can quickly allow the clinician to
     identify a pneumothorax, which in the hypotensive patient may represent a tension
     pneumothorax requiring immediate decompression. Tension pneumothorax presum-
     ably limits venous return into the heart due to increased pressure within the chest
     cavity.17,18 The lung can also be examined for ultrasonic B lines, a potential sign of
     volume overload and pulmonary edema. The clinician can further examine the thoracic
     cavity for a pleural effusion. Last, the clinician can perform a FAST exam (Focused
     Assessment with Sonography in Trauma examination), to look for fluid in the
     abdomen, indicating a source for ‘‘loss of fluid from the tank.’’
        The third and final part of the shock ultrasound protocol is evaluation of the large
     arteries and veins of the body, referred to as ‘‘the pipes.’’ Clinicians should answer
     the clinical question ‘‘are the pipes ruptured or obstructed’’ by first evaluating the arte-
     rial side of the vascular system to specifically examine the abdominal and thoracic
     aorta for an aneurysm or dissection. Next the clinician should turn to evaluation of
     the venous side of the vascular system. The femoral and popliteal veins can be exam-
     ined with a high frequency linear array transducer for compressibility. Lack of full
     venous compression with direct pressure is highly suggestive of a deep venous throm-
     bosis (DVT).19,20 Presence of a venous thrombus in the hypotensive patient may signal
     a large pulmonary thromboembolus.

     RUSH Protocol: Step 1—Evaluation of the Pump
     Focused echocardiography is a skill that is readily learned by the EP. A smaller foot-
     print phased-array transducer is ideal for this examination as it permits the intercostal
     scanning required of the heart. Imaging of the heart usually involves 4 views. The tradi-
     tional views of the heart for bedside echocardiography are the parasternal long- and
     short-axis views, the subxiphoid view, and the apical 4-chamber view (Fig. 1). The par-
     asternal views are taken with the probe positioned just left of the sternum at intercostal
     space 3 or 4. The subxiphoid 4-chamber view is obtained with the probe aimed up
     toward the left shoulder from a position just below the subxiphoid tip of the sternum
     (Fig. 2). The apical 4-chamber view of the heart is best evaluated by turning the patient
     into a left lateral decubitus position and placing the probe just below the nipple line at
     the point of maximal impulse of the heart. It is important for the EP to know all 4 views

     Fig. 1. Rapid Ultrasound in SHock (RUSH) step 1. Evaluation of the pump.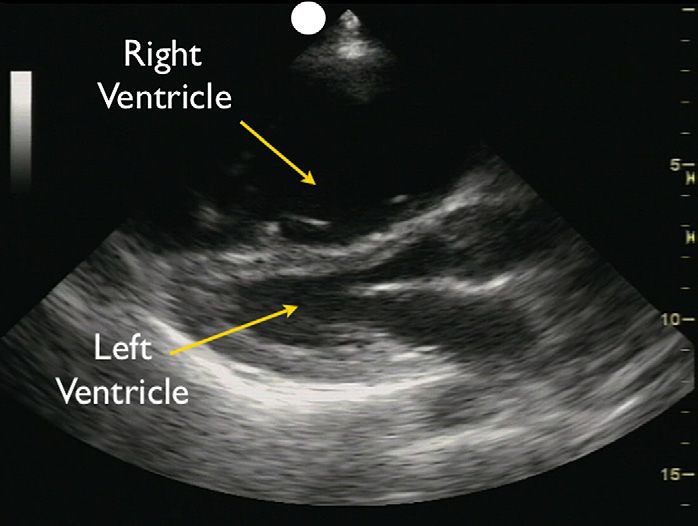
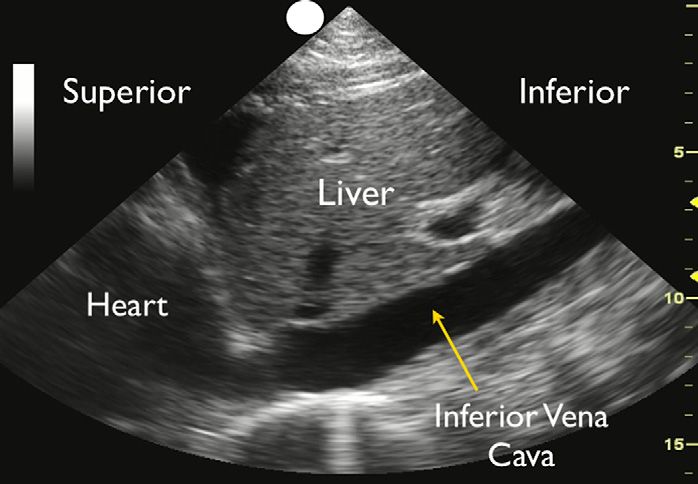
The RUSH Exam        33

Fig. 2. Subxiphoid view: cardiomyopathy with enlarged heart. LA, left atrium; LV, left
ventricle; RA, right atrium; RV, right ventricle.

of the heart, as some views may not be well seen in individual patients, and an alter-
native view may be needed to answer the clinical question at hand.

‘‘Effusion around the pump’’: evaluation of the pericardium
The first priority is to search for the presence of a pericardial effusion, which may be
a cause of the patient’s hemodynamic instability. The heart should be imaged in the
planes described here, with close attention to the presence of fluid, usually appearing
as a dark or anechoic area, within the pericardial space (Fig. 3). Small effusions may
be seen as a thin stripe inside the pericardial space, whereas larger effusions tend to
wrap circumferentially around the heart.21,22 Isolated small anterior anechoic areas on
the parasternal long-axis view often represent a pericardial fat pad, as free flowing
pericardial effusions will tend to layer posteriorly and inferiorly with gravity. Fresh fluid

Fig. 3. Parasternal long-axis view: large pericardial effusion.
34 Perera et al
or blood tends to have a darker or anechoic appearance, whereas clotted blood or
exudates may have a lighter or more echogenic look.
Pericardial effusions can result in hemodynamic instability, due to increased pres-
sure within the sac leading to compression of the heart. Because the pericardium is
a relatively thick and fibrous structure, acute pericardial effusions may result in cardiac
tamponade despite only small amounts of fluid. In contrast, chronic effusions can
grow to a large volume without hemodynamic instability.23 Once a pericardial effusion
is identified, the next step is to evaluate the heart for signs of tamponade. Thinking of
the heart as a dual chamber in-line pump, the left side of the heart is under consider-
ably more pressure, due to the high systemic pressures against which it must pump.
The right side of the heart is under relatively less pressure, due to the lower pressure
within the pulmonary vascular circuit. Thus, most echocardiographers define tampo-
nade as compression of the right side of the heart (Fig. 4). High pressure within the
pericardial sac keeps the chamber from fully expanding during the relaxation phase
of the cardiac cycle and thus is best recognized during diastole. As either chamber
may be affected by the effusion, both the right atrium and right ventricle should be
closely inspected for diastolic collapse. Diastolic collapse of the right atrium or right
ventricle appears as a spectrum from a subtle inward serpentine deflection of the
outer wall to complete compression of a chamber.24 Whereas most pericardial effu-
sions are free flowing in the pericardial sac, occasionally effusions may be loculated.
This phenomenon is more commonly seen in patients following heart surgery, in whom
a clot can form in only one area of the sac.25 In these cases, effusions can preferen-
tially form posteriorly, and in tamponade, the left side of the heart may be compressed
before the right side of the heart. The IVC can also be evaluated for additional confir-
matory signs of tamponade.26 IVC plethora will be recognized by distention of the IVC
without normal respiratory changes. (see later discussion on IVC in the section ‘‘Eval-
uation of the tank’’).
Previous published studies have demonstrated that EPs, with a limited amount of
training, can correctly and accurately identify the presence of a pericardial effusion.27
Studies examining the incidence of pericardial effusions in Emergency Department or
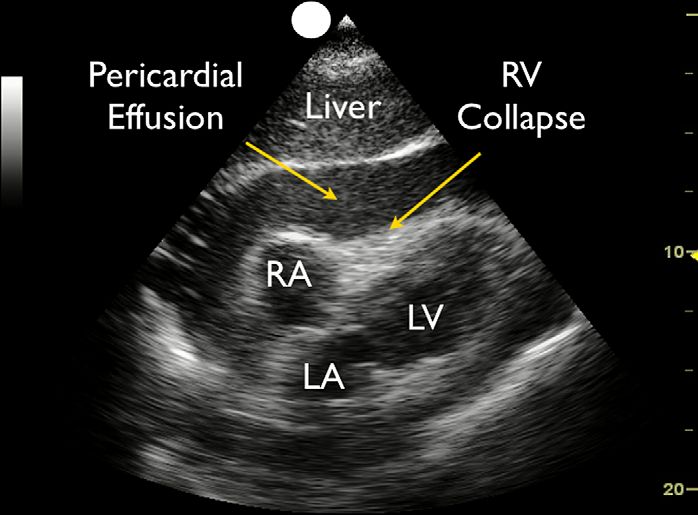
Fig. 4. Subxiphoid view: cardiac tamponade.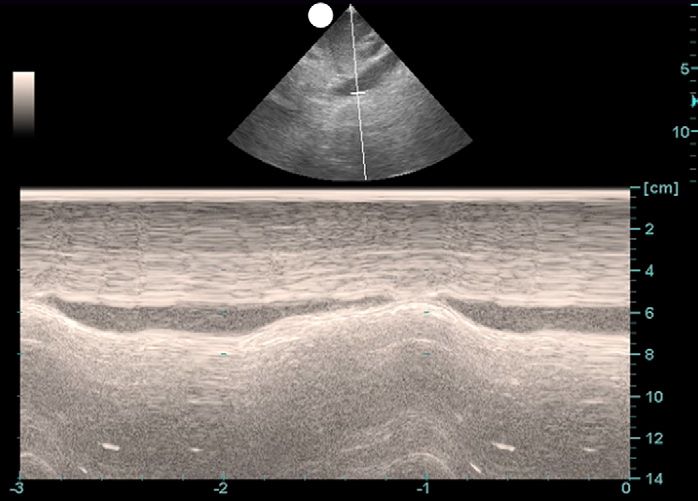
The RUSH Exam        35

Intensive Care patients suffering acute shortness of breath, respiratory failure, or
shock have found effusions in as many as 13% of these patients.21 Another study
looked specifically at patients arriving at the Emergency Department in near-cardiac
arrest states, and found a relatively large number of these cases had pericardial effu-
sions.28 Thus, symptomatic pericardial effusions may be a cause of hemodynamic
instability in a significant number of acute patients, and EPs can quickly and accu-
rately diagnose this condition using bedside ultrasound.
   As a general principle, it is easier for an EP to diagnose a pericardial effusion than to
evaluate for the specific signs of tamponade.29 It is thus safer to assume tamponade
physiology in the hypotensive patient if a significant pericardial effusion is identified.
Under ideal circumstances, the EP can obtain a formal echocardiogram in conjunction
with Cardiology to specifically examine for cardiac tamponade. In the rare cases
where there is not enough time for consultation and the patient is unstable, a pericar-
diocentesis under echo guidance by the EP may be life-saving. In these cases, em-
ploying bedside echocardiography also allows the EP to determine the optimal
needle insertion site for pericardiocentesis. Of note, most EPs have classically been
taught the subxiphoid approach for pericardiocentesis. However, a large review
from the Mayo Clinic looked at 1127 pericardiocentesis procedures, and found that
the optimal placement of the needle was where the distance to the effusion was the
least and the effusion size was maximal.30 The apical position at the point of maximal
impulse on the left lateral chest wall was chosen in 80% of these procedures, based
on these variables. The subxiphoid approach was only chosen in 20% of these proce-
dures, as the investigators recognized the large distance the needle had to travel
through the liver to enter the pericardial sac. EPs should therefore anatomically map
out the effusion before a pericardiocentesis procedure to plan the most direct and
safest route. If the apical approach is selected, the patient should optimally be rolled
into a left lateral decubitus position to bring the heart closer to the chest wall, and after
local anesthesia, a pericardiocentesis drainage catheter should be introduced over the
rib and into the pericardial sac. To maximize success and to avoid complications, the
transducer should be placed in a sterile sleeve adjacent to the needle, and the proce-
dure performed under real-time ultrasound guidance.

‘‘Squeeze of the pump’’: determination of global left ventricular function
The next step in the RUSH protocol is to evaluate the heart for contractility of the left
ventricle. This assessment will give a determination of ‘‘how strong the pump is.’’ The
examination focuses on evaluating motion of the left ventricular endocardial walls, as
judged by a visual calculation of the percentage change from diastole to systole.
Whereas in the past echocardiographers used radionuclide imaging to determine
ejection fraction, published studies have demonstrated that visual determination of
contractility is roughly equivalent.31 A ventricle that has good contractility will be
observed to have a large percentage change from the 2 cycles, with the walls almost
coming together and touching during systole. As an example, a vigorously contracting
ventricle will almost completely obliterate the ventricular cavity during systole. In
comparison, a poorly contracting heart will have a small percentage change in the
movement of the walls between diastole and systole. In these hearts, the walls will
be observed to move little during the cardiac cycle, and the heart may also be dilated
in size, especially if a long-standing cardiomyopathy with severe systolic dysfunction
is present. Motion of anterior leaflet of the mitral valve can also be used to assess
contractility. In a normal contractile state, the anterior leaflet will vigorously touch
the wall of the septum during ventricular filling when examined using the parasternal
long-axis view.
36   Perera et al

         The parasternal long-axis view of the heart is an excellent starting view to assess
     ventricular contractility. Moving the probe into the parasternal short-axis orientation
     will give confirmatory data on the strength of contractions. In this view, a left ventricle
     with good contraction will appear as a muscular ring that squeezes down concentri-
     cally during systole. Whereas cardiologists often use the parasternal short-axis view
     to evaluate for segmental wall motion abnormalities, this is a more subjective
     measurement, and determinations may differ among different clinicians. For that
     reason, it is better for the EP to initially concentrate on the overall contractility of the
     ventricle, rather than to evaluate for segmental wall motion deficits. An easy system
     of grading is to judge the strength of contractions as good, with the walls of the
     ventricle contracting well during systole; poor, with the endocardial walls changing
     little in position from diastole to systole; and intermediate, with the walls moving
     with a percentage change in between the previous 2 categories. If the parasternal
     views are inadequate for these determinations, moving the patient into the left lateral
     decubitus position and examining from the apical view often gives crucial data on left
     ventricular contractility. The subxiphoid view can be used for this determination, but
     the left ventricle is farther away from the probe in this view.
         Published studies confirm that EPs can perform this examination and get an esti-
     mate of left ventricular contractility that compares well with that measured by a cardi-
     ologist.32 Because a large proportion of shock patients (up to 60% in one study) will
     have a cardiac cause for their hypotension, this part of the examination can be very
     high yield.10 Immediate identification of cardiogenic shock by the EP can lead to
     more rapid transfer of the patient to the cardiac catheterization suite for revasculariza-
     tion, especially in suspected cases of cardiac ischemia.33,34 Other types of shock can
     be evaluated by knowing the strength of the left ventricle during systole. Strong
     ventricular contractility (often termed hyperdynamic, because of the strength of
     contractions of the left ventricle in addition to a rapid heart rate) is often seen in early
     sepsis and in hypovolemic shock.35 In severe hypovolemic conditions, the heart is
     often small in size with complete obliteration of the ventricular cavity during systole.
     Bedside echocardiography also allows for repeated evaluation of the patient’s heart,
     looking for changes in contractility over time, especially when if a patient’s status dete-
     riorates. For example, later in the course of sepsis there may be a decrease in contrac-
     tility of the left ventricle due to myocardial depression.36
         Knowing the strength of left ventricular contractility will give the EP a better idea of
     how much fluid ‘‘the pump’’ or heart of the patient can handle, before manifesting
     signs and symptoms of fluid overload. This knowledge will serve as a critical guide
     for the clinician to determine the amount of fluid that can be safely given to a patient.
     As an example, in a heart with poor contractility, the threshold for initiation of vaso-
     pressor agents for hemodynamic support should be lower. In contrast, sepsis patients
     have been shown to benefit with aggressive early goal-directed therapy, starting with
     large amounts of fluids before use of vasopressor medications.37 Because many
     Emergency Departments do not currently use the invasive catheter needed to opti-
     mally monitor the hemodynamic goals outlined for treatment of sepsis patients,
     bedside ultrasound gives the clinician a noninvasive means to identify and follow
     a best management strategy.
         In cardiac arrest, the clinician should specifically examine for the presence or
     absence of cardiac contractions. If contractions are seen, the clinician should look
     for the coordinated movements of the mitral and aortic valves. In this scenario, the
     absence of coordinated opening of mitral and aortic valves will require chest compres-
     sions to maintain cardiac output. Furthermore, if after prolonged advanced cardiac life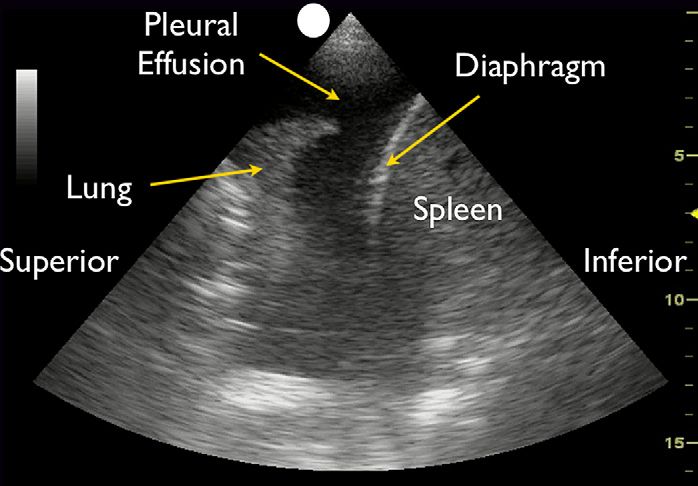
The RUSH Exam        37

support resuscitation the bedside echocardiogram shows cardiac standstill, it is
unlikely that the adult patient will have return of spontaneous circulation.38,39

‘‘Strain of the pump’’: assessment of right ventricular strain
In the normal heart, the left ventricle is larger than the right ventricle. This aspect is
predominantly a cause of the muscular hypertrophy that takes place in the myocar-
dium of the left ventricle after birth, with the closure of the ductus arteriosus. The
left ventricle is under considerably more stress than the right ventricle, to meet the
demands of the higher systemic pressure, and hypertrophy is a normal compensatory
mechanism. On bedside echocardiography, the normal ratio of the left to right
ventricle is 1:0.6.40 The optimal cardiac views for determining this ratio of size between
the 2 ventricles are the parasternal long and short-axis views and the apical 4-
chamber view. The subxiphoid view can be used, but care must be taken to fan
through the entire right ventricle, as it is easy to underestimate the true right ventricular
size in this view.
   Any condition that causes pressure to suddenly increase within the pulmonary
vascular circuit will result in acute dilation of the right heart in an effort to maintain
forward flow into the pulmonary artery. The classic cause of acute right heart strain
is a large central pulmonary embolus. Due to the sudden obstruction of the pulmonary
outflow tract by a large pulmonary embolus, the right ventricle will attempt to compen-
sate with acute dilation. This process can be seen on bedside echocardiography by
a right ventricular chamber that is as large, or larger, than the left ventricle (Fig. 5).41
In addition, deflection of the interventricular septum from right to left toward the left
ventricle may signal higher pressures within the pulmonary artery.42 In rare cases,
intracardiac thrombus may be seen floating free within the heart (Fig. 6).43 In compar-
ison, a condition that causes a more gradual increase in pulmonary artery pressure
over time, such as smaller and recurrent pulmonary emboli, cor pulmonale with
predominant right heart strain, or primary pulmonary artery hypertension, will cause
both dilation and thickening or hypertrophy of the right ventricular wall.44 These mech-
anisms can allow the right ventricle to compensate over time and to adapt to pumping

Fig. 5. Parasternal long-axis view: right ventricular strain.
38   Perera et al

     Fig. 6. Apical view: floating thrombus in right atrium.

     blood against the higher pressures in the pulmonary vascular circuit. Acute right heart
     strain thus differs from chronic right heart strain in that although both conditions cause
     dilation of the chamber, the ventricle will not have the time to hypertrophy if the time
     course is sudden.
        Previous published studies have looked at the sensitivity of the finding of right heart
     dilation in helping the clinician to diagnose a pulmonary embolus. The results show
     that the sensitivity is moderate, but the specificity and positive predictive value of
     this finding are high in the correct clinical scenario, especially if hypotension is
     present.12,13,45–47 The finding of acute right heart strain due to a pulmonary embolus
     correlates with a poorer prognosis.12,48,49 This finding, in the setting of suspected
     pulmonary embolus, suggests the need for immediate evaluation and treatment of
     thromboembolism.50 The EP should also proceed directly to evaluation of the leg veins
     for a DVT (covered in detail later under ‘‘Evaluation of the pipes’’).
        The literature suggests that in general, patients with a pulmonary embolus should be
     immediately started on heparin. However, a hypotensive patient with a pulmonary
     embolus should be considered for thrombolysis.51,52 Bedsides, ultrasound gives the
     treating clinician the clinical confidence to proceed in this more aggressive fashion.
     Clinical status permitting, a chest computed tomography (CT) scan using a dedicated
     pulmonary embolus protocol should be obtained. If the patient is not stable enough for
     CT, an emergent echocardiogram in conjunction with Cardiology or bilateral duplex
     ultrasound of the legs should be considered.

     RUSH Protocol Step 2: Evaluation of the Tank
     ‘‘Fullness of the tank’’: evaluation of the inferior cava and jugular veins for size and
     collapse with inspiration
     The next step for the clinician using the RUSH protocol in the hypotensive patient is to
     evaluate the effective intravascular volume as well as to look for areas where the intra-
     vascular volume might be compromised (Fig. 7). An estimate of the intravascular
     volume can be determined noninvasively by looking initially at the IVC.14,15 The ultra-
     sound transducer should be positioned in the epigastric area in a long-axis configura-
     tion along the IVC as it runs from the abdomen into the heart. A good way of obtaining
     this image is to first examine the heart in the subxiphoid 4-chamber plane and then to
     move the probe into the subxiphoid 2-chamber plane, with the probe marker oriented
The RUSH Exam 39 Fig. 7. RUSH step 2. Evaluation of the tank. IVC exam, inferior vena cava; FAST views (Focused Sonography in Trauma), right upper quadrant, left upper quadrant and suprapu- bic; lung exam, pneumothorax and pulmonary edema. anteriorly. The aorta will often come quickly into view from this plane as a thicker walled and deeper structure. Moving the probe to the patient’s right will bring the IVC into view, running longitudinally adjacent to the aorta. The IVC should be exam- ined at the junction of the right atrium and the cava and followed 2 to 3 cm caudally along the vessel. Moving the probe into short axis to further evaluate the IVC is complementary as it will display the structure as an oval and allow confirmation of size by avoiding underestimation of the structure with the cylinder effect. As the patient breathes, the IVC will have a normal pattern of collapse during inspiration, due to the negative pressure generated in the chest, causing increased flow from the abdominal to the thoracic cavity (Fig. 8). This respiratory variation can be further augmented by having the patient sniff or inspire forcefully. M-mode Doppler, posi- tioned on the IVC, can graphically document the dynamic changes in the vessel caliber during the patient’s respiratory cycle (Fig. 9). Previous studies have demonstrated a correlation between the size and percentage change of the IVC with respiratory variation to central venous pressure (CVP) using an indwelling catheter. A smaller caliber IVC (
40 Perera et al
Fig. 9. Inferior vena cava sniff test: M-mode Doppler showing collapsible IVC.
greater than 50% roughly correlates to a CVP of less than 10 cm of water. This
phenomenon may be observed in hypovolemic and distributive shock states. A larger
sized IVC (>2 cm diameter) that collapses less than 50% with inspiration correlates to
a CVP of more than 10 cm of water (Fig. 10).53,54 This phenomenon may be seen in
cardiogenic and obstructive shock states. Two caveats to this rule exist. The first is
in patients who have received treatment with vasodilators and/or diuretics prior to
ultrasound evaluation in whom the IVC may be smaller than prior to treatment, altering
the initial physiological state. The second caveat exists in intubated patients receiving
positive pressure ventilation, in which the respiratory dynamics of the IVC are
reversed. In these patients, the IVC is also less compliant and more distended
throughout all respiratory cycles. However, crucial physiologic data can still be
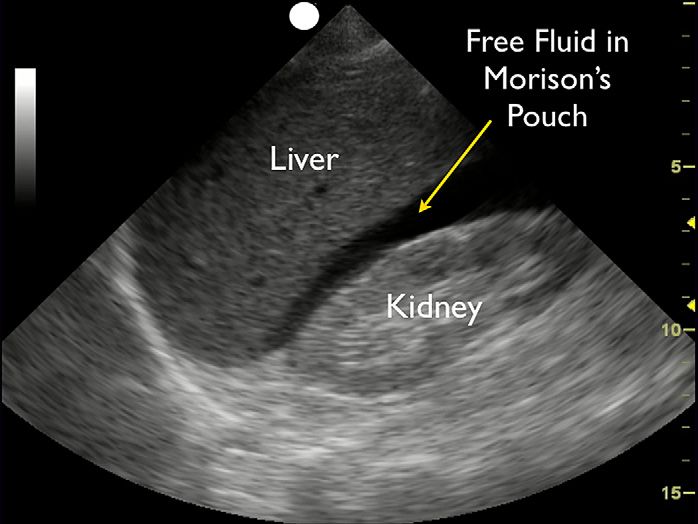
Fig. 10. Inferior vena cava sniff test: high cardiac filling pressures.The RUSH Exam 41 obtained in these ventilated patients, as fluid responsiveness has been correlated with an increase in IVC diameter over time.55 Evidence suggests that the bedside ultrasound estimate of CVP is most accurate when the IVC is small and inspiratory collapse is high. However, rather than relying on a single measurement of the IVC, it is better to determine the effective vascular volume by following changes in size and respiratory dynamics over time with fluid challenges.56 Observing a change in IVC size from small, with a high inspiratory collapse, to a larger IVC with little inspiratory collapse, suggests that the CVP is increasing and ‘‘the tank’’ is more full.57 The internal jugular veins can also be examined with ultrasound to further evaluate the intravascular volume. As with visual evaluation of the jugular veins, the patient’s head is placed at a 30" angle. Using a high-frequency linear array transducer, the internal jugular veins can first be found in the short-axis plane, then evaluated more closely by moving the probe into a long-axis configuration. The location of the superior closing meniscus is determined by the point at which the walls of the vein touch each other. Similar to the IVC, the jugular veins can also be examined during respiratory phases to view inspiratory collapse. Veins that are distended, with a closing meniscus level that is high in the course of the neck, suggest a higher CVP.16 Coupling this data with the evaluation of the IVC may give a better overall assessment of the effective intravascular volume. ‘‘Leakiness of the tank’’: FAST exam and pleural fluid assessment Once a patient’s intravascular volume status has been determined, the next step in assessing the tank is to look for ‘‘abnormal leakiness of the tank.’’ Leakiness of the tank refers to 1 of 3 things leading to hemodynamic compromise: internal blood loss, fluid extravasation, or other pathologic fluid collections. In traumatic conditions, the clinician must quickly determine whether hemoperitoneum or hemothorax is present, as a result of a ‘‘hole in the tank,’’ leading to hypovolemic shock. In nontrau- matic conditions, accumulation of excess fluid into the abdominal and chest cavities often signifies ‘‘tank overload,’’ with resultant pleural effusions and ascites that may build-up with failure of the heart, kidneys, and/or liver. However, many patients with intrathoracic or intra-abdominal fluid collections are actually intravascularly volume depleted, confusing the clinical picture. Focusing on ‘‘tank fullness’’ by assessment of IVC and jugular veins in conjunction with the aforementioned findings can be very helpful in elucidating these conditions. In infectious states, pneumonia may be accom- panied by a complicating parapneumonic pleural effusion, and ascites may lead to spontaneous bacterial peritonitis. Depending on the clinical scenario, small fluid collections within the peritoneal cavity may also represent intra-abdominal abscesses leading to a sepsis picture. The peritoneal cavity can be readily evaluated with bedside ultrasound for the pres- ence of an abnormal fluid collection in both trauma and nontrauma states. This assessment is accomplished with the FAST exam. This examination consists of an inspection of the potential spaces in the right and left upper abdominal quadrants and in the pelvis. Specific views include the space between the liver and kidney (hep- atorenal space or Morison pouch), the area around the spleen (perisplenic space), and the area around and behind the bladder (rectovesicular/rectovaginal space or pouch of Douglas). A dark or anechoic area in any of these 3 potential spaces represents free intraperitoneal fluid (Fig. 11). These 3 areas represent the most common places for free fluid to collect, and correspond to the most dependent areas of the peritoneal cavity in the supine patient. Because the FAST exam relies on free fluid settling into these dependent areas, the patient’s position should be taken into account while
42   Perera et al

     Fig. 11. Right upper quadrant/hepatorenal view: free fluid.

     interpreting the examination. Trendelenburg positioning will cause fluid to shift to the
     upper abdominal regions, whereas an upright position will cause shift of fluid into the
     pelvis.
        The FAST exam has been reported to detect intraperitoneal fluid collections as small
     as 100 mL, with a range of 250 to 620 mL commonly cited.58–60 How much fluid can be
     detected depends on the clinician’s experience as well as the location of the free fluid,
     with the pelvic view best able to detect small quantities of fluid.60 The overall sensitivity
     and specificity of the FAST exam have been reported to be approximately 79% and
     99%, respectively.61
        Ultrasound can also assist in evaluating the thoracic cavity for free fluid (pleural effu-
     sion or hemothorax) in an examination known as the extended FAST, or E-FAST. This
     evaluation is easily accomplished by including views of the thoracic cavity with the
     FAST examination. In both the hepatorenal and perisplenic views, the diaphragms
     appear as bright or hyperechoic lines immediately above, or cephalad to, the liver
     and spleen respectively. Aiming the probe above the diaphragm will allow for identifi-
     cation of a thoracic fluid collection. If fluid is found, movement of the probe 1 or 2 inter-
     costal spaces cephalad provides a better view of the thoracic cavity, allowing
     quantification of the fluid present. In the normal supradiaphragmatic view, there are
     no dark areas of fluid in the thoracic cavity, and the lung can often be visualized as
     a moving structure. In the presence of an effusion or hemothorax, the normally visu-
     alized lung above the diaphragm is replaced with a dark, or anechoic, space. The
     lung may also be visualized floating within the pleural fluid (Fig. 12). Pleural effusions
     often exert compression on the lung, causing ‘‘hepatization,’’ or an appearance of the
     lung in the effusion similar to a solid organ, like the liver. The literature supports the use
     of bedside ultrasound for the detection of pleural effusion and hemothorax. Several
     studies have found Emergency Department ultrasound to have a sensitivity in excess
     of 92% and a specificity approaching 100% in the detection of hemothorax.62–65 As-
     sessing the patient with the head slightly elevated may improve the sensitivity of this
     examination, as this will cause intrathoracic fluid to accumulate just above the
     diaphragms.
The RUSH Exam 43 Fig. 12. Left upper quadrant: pleural effusion. Free fluid in the peritoneal or thoracic cavities in a hypotensive patient in whom a history of trauma is present or suspected should initially be presumed to be blood, leading to a diagnosis of hemorrhagic shock. Although a history of trauma is commonly elicited in such cases, the trauma may be occult or minor, making diag- nosis sometimes difficult. One circumstance of occult trauma is a delayed splenic rupture resulting from an enlarged and more fragile spleen, such as in a patient with infectious mononucleosis. Although rare, this entity may occur several days following a minor trauma, and may thus be easily overlooked by both patient and clinician.66 Leakage of intestinal contents from rupture of a hollow viscus or urine extravasation from intraperitoneal bladder rupture may also demonstrate free intraperitoneal fluid. Nontraumatic conditions may also lead to hemorrhagic shock, and must remain on the EP’s differential diagnosis. Ruptured ectopic pregnancy and hemorrhagic corpus luteum cyst are 2 diagnoses that should not be overlooked in women of childbearing age. In an elderly patient, an abdominal aortic aneurysm may occasionally rupture into the peritoneal cavity and thoracic aneurysms may rupture into the chest cavity. Once the diagnosis of hemorrhagic shock is made, treatment should be directed toward transfusion of blood products and surgical or angiographic intervention. In the nontrauma patient, ascites and pleural effusions will appear as dark, or anechoic, fluid collections, similar to blood. Parapneumonic inflammation may cause considerable pleural effusions and/or empyema. Differentiating blood from other fluids can be suggested from the history, clinical examination, and chest radiograph. There may occasionally be some signature sonographic findings that help make a diagnosis. In hemorrhagic conditions, blood often has a mixed appearance, with areas of both anechoic fresh blood and more echogenic blood clot present. In an infectious para- pneumonic pleural effusion, gas bubbles may be seen within the fluid. In cases of uncertainty, a diagnostic thoracentesis or paracentesis (under ultrasound guidance) will most accurately evaluate the nature of the fluid.67 ‘‘Tank compromise’’: pneumothorax Although the exact mechanism by which tension pneumothorax causes shock is controversial, it has historically been thought to produce obstructive shock.17,18,68 Ac- cording to this theory, severely increased intrathoracic pressure produces mediastinal
44 Perera et al
shift, which kinks and compresses the inferior and superior vena cava at their insertion
into the right atrium, obstructing venous return to the heart. Regardless of the exact
mechanism, detection is critical.
Although chest radiography reveals characteristic findings in tension pneumo-
thorax, therapy should not be delayed while awaiting radiographic studies. With
bedside ultrasound, the diagnosis of tension pneumothorax can be accomplished
within seconds. Pneumothorax detection with ultrasound relies on the fact that free
air (pneumothorax) is lighter than normal aerated lung tissue, and thus will accumulate
in the nondependent areas of the thoracic cavity. Therefore, in a supine patient a pneu-
mothorax will be found anteriorly, while in an upright patient a pneumothorax will be
found superiorly at the lung apex.
Multiple studies have shown ultrasound to be more sensitive than supine chest radi-
ography for the detection of pneumothorax.69–74 Sensitivities for these various studies
ranged from 86% to 100%, with specificities ranging from 92% to 100%. A study by
Zhang and colleagues71 that focused on trauma victims found the sensitivity of ultra-
sound for pneumothorax was 86% versus 27% for chest radiography; furthermore,
this same study reported the average time to obtain ultrasound was 2.3 minutes
versus 19.9 minutes for chest radiography.
To assess for pneumothorax with ultrasound, the patient should be supine. Position
a high-frequency linear array or a phased-array transducer in the mid-clavicular line at
approximately the third through fifth intercostal spaces to identify the pleural line. This
line appears as an echogenic horizontal line located approximately half a centimeter
deep to the ribs. The pleural line consists of both the visceral and parietal pleura
closely apposed to one another. In the normal lung, the visceral and parietal pleura
can be seen to slide against each other, with a glistening or shimmering appearance,
as the patient breathes (Fig. 13). The presence of this lung sliding excludes a pneumo-
thorax.75 This lung sliding motion can be graphically depicted by using M-mode
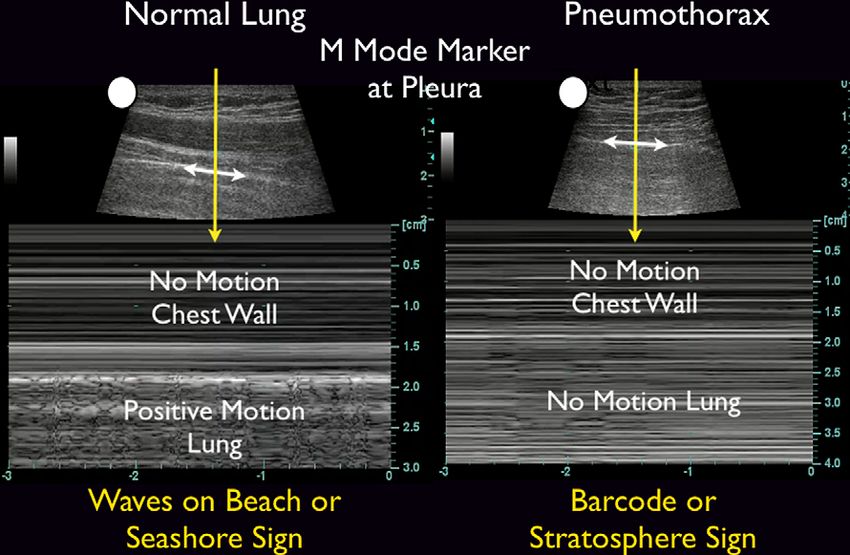
Doppler. A normal image will depict ‘‘waves on the beach,’’ with no motion of the chest
wall anteriorly, represented as linear ‘‘waves,’’ and the motion of the lung posteriorly,
representing ‘‘the beach’’ (Fig. 14). When a pneumothorax is present, air gathers
between the parietal and visceral pleura, preventing the ultrasound beam from detect-
ing lung sliding. In pneumothorax, the pleural line seen consists only of the parietal
layer, seen as a stationary line. M-mode Doppler through the chest will show only
repeating horizontal linear lines, demonstrating a lack of lung sliding or absence of
the ‘‘beach’’ (see Fig. 14). Although the presence of lung sliding is sufficient to rule
Fig. 13. Long-axis view: normal lung.The RUSH Exam 45 Fig. 14. M-mode: normal lung versus pneumothorax. out pneumothorax, the absence of lung sliding may be seen in other conditions in addition to pneumothorax, such as a chronic obstructive pulmonary disease bleb, consolidated pneumonia, atelectasis, or mainstem intubation.76–78 Thus the absence of lung sliding, especially as defined in one intercostal space, is not by itself diagnostic of a pneumothorax. The clinician can examine through several more intercostal spaces, moving the transducer more inferiorly and lateral, to increase the utility of the test. This maneuver may also help identify the lung point, or the area where an incomplete pneumothorax interfaces with the chest wall, as visualized by the pres- ence of lung sliding on one side and the lack of lung sliding on the other.79 Another sonographic finding seen in normal lung, but absent in pneumothorax, is the comet tail artifact. Comet tail artifact is a form of reverberation echo that arises from irregularity of the lung surface. This phenomenon appears as a vertical echoic line originating from the pleural line and extending down into the lung tissue. The pres- ence of comet tail artifact rules out a pneumothorax.80 The combination of a lack of lung sliding and absent comet tail artifacts strongly suggests pneumothorax. In the setting of undifferentiated shock, the EP should strongly consider that a tension pneu- mothorax may be present, and immediate needle decompression followed by tube thoracostomy should be considered. ‘‘Tank overload’’: pulmonary edema Pulmonary edema often accompanies cardiogenic shock, in which weakened cardiac function causes a backup of blood into the pulmonary vasculature, leading to tank overload. Yet the clinical picture can be misleading, as patients in pulmonary edema may present with wheezing, rather than rales, or may have relatively clear lung sounds. The ability to quickly image the lung fields with ultrasound can rapidly lead the EP to the correct diagnosis. Although it is a relatively new concept, ultrasound has been shown to be helpful in the detection of pulmonary edema.81 The sonographic signs of pulmonary edema correlate well with chest radiography.82
46 Perera et al
To assess for pulmonary edema with ultrasound, the lungs are scanned with the
phased-array transducer in the anterolateral chest between the second and fifth rib
interspaces. Detection of pulmonary edema with ultrasound relies on seeing a special
subtype of comet tail artifact, called B lines (Fig. 15). These B lines appear as a series of
diffuse, brightly echogenic lines originating from the pleural line and projecting in
a fanlike pattern into the thorax (described as ‘‘lung rockets’’). In contrast to the smaller
comet tail artifacts seen in normal lung that fade out within a few centimeters of the
pleural line, the B lines of pulmonary edema are better defined and extend to the far field
of the ultrasound image. B lines result from thickening of the interlobular septa, as extra-
vascular water accumulates within the pulmonary interstitium.81,83 The presence of B
lines coupled with decreased cardiac contractility and a plethoric IVC on focused sono-
graphic evaluation should prompt the clinician to consider the presence of pulmonary
edema and initiate appropriate treatment.
RUSH Protocol: Step 3—Evaluation of the Pipes
‘‘Rupture of the pipes’’: aortic aneurysm and dissection
The next step in the RUSH exam is to examine the ‘Pipes’looking first at arterial side of
circulatory system and then at the venous side (Fig. 16). Vascular catastrophes, such
as ruptured abdominal aortic aneurysms (AAA) and aortic dissections, are life-threat-
ening causes of hypotension. The survival of such patients may often be measured in
minutes, and the ability to quickly diagnose these diseases is crucial.
A ruptured AAA is classically depicted as presenting with back pain, hypotension,
and a pulsatile abdominal mass. However, fewer than half of cases occur with this
triad, and some cases will present with shock as the only finding.84 A large or rupturing
AAA can also mimic a kidney stone, with flank pain and hematuria. Fortunately for the
EP, ultrasound can be used to rapidly diagnose both conditions.85 Numerous studies
have shown that EPs can make the diagnosis of AAA using bedside ultrasound, with
a high sensitivity and specificity.86–89 The sensitivity of EP-performed ultrasound for
the detection of AAA ranges from 93% to 100%, with specificities approaching
100%.86–88
A complete ultrasound examination of the abdominal aorta involves imaging from
the epigastrium down to the iliac bifurcation using a phased-array or curvilinear
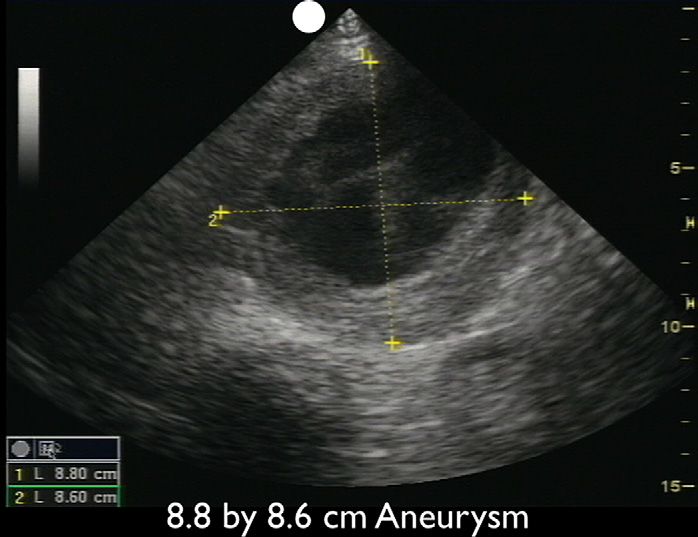
Fig. 15. Lung ultrasound: edema with B lines.The RUSH Exam 47 Fig. 16. RUSH step 3. Evaluation of the pipes. transducer. Aiming the transducer posteriorly in a transverse orientation in the epigas- tric area, the abdominal aorta can be visualized as a circular vessel seen immediately anterior to the vertebral body and to the left of the paired IVC. Application of steady pressure to the transducer to displace bowel gas, while sliding the probe inferiorly from a position just below the xiphoid process down to the umbilicus, allows for visu- alization of the entire abdominal aorta. The aorta should also be imaged in the longi- tudinal orientation for completion. Measurements should be obtained in the short axis, measuring the maximal diameter of the aorta from outer wall to outer wall, and should include any thrombus present in the vessel. A measurement of greater than 3 cm is abnormal and defines an abdominal aortic aneurysm (Fig. 17). Smaller aneurysms may be symptomatic, although rupture is more common with aneurysms measuring larger than 5 cm.90 Studies have also confirmed that the EP can reliably make a correct determination of the size of an AAA.87,91 Fig. 17. Short-axis view: large abdominal aortic aneurysm.
48   Perera et al

        Identifying the abdominal aorta along its entire course is essential to rule out an
     aneurysm, paying special attention below the renal arteries where most AAAs are
     located. Rupture of an abdominal aortic aneurysm typically occurs into the retroperi-
     toneal space, which unfortunately is an area difficult to visualize with ultrasound. In
     a stable patient, a CT scan with intravenous contrast can be ordered to investigate
     leakage of an aneurysm. However, a hypotensive patient with sonographic evidence
     of an AAA should be considered to have acute rupture, and a surgeon should be con-
     sulted with plans for immediate transport to the operating room.
        Another crucial part of ‘‘the pipes’’ protocol is evaluation for an aortic dissection.
     The sensitivity of transthoracic echocardiography to detect aortic dissection is poor
     (approximately 65% according to one study), and is limited compared with CT,
     MRI, or transesophageal echocardiography.92 Despite this, EP-performed bedside
     ultrasound has been used to detect aortic dissections and has helped many
     patients.93–95 Sonographic findings suggestive of the diagnosis include the presence
     of aortic root dilation and an aortic intimal flap. The parasternal long-axis view of the
     heart permits an evaluation of the proximal aortic root, and a measurement of more
     than 3.8 cm is considered abnormal. An echogenic intimal flap may be recognized
     within the dilated root or anywhere along the course of the thoracic or abdominal aorta
     (Fig. 18). The suprasternal view allows imaging of the aortic arch and should be per-
     formed in high-suspicion scenarios by placing the phased-array transducer within the
     suprasternal notch and aiming caudally and anteriorly (Fig. 19). Color flow imaging can
     further delineate 2 lumens with distinct blood flow, confirming the diagnosis. In
     patients with acute proximal dissection, aortic regurgitation or a pericardial effusion
     may also be recognized. Abdominal aortic ultrasound may reveal a distal thoracic
     aortic dissection that extends below the diaphragm, and in the hands of skilled sonog-
     raphers has been shown to be 98% sensitive.96

     Fig. 18. Short-axis view: aortic dissection.
The RUSH Exam 49 Fig. 19. Suprasternal view: aortic dissection. ‘‘Clogging of the pipes’’: venous thromboembolism Bedside ultrasound for DVT In the patient in whom a thromboembolic event is sus- pected as a cause of shock, the EP should then move to an assessment of the venous side of ‘‘the pipes.’’ As the majority of pulmonary emboli originate from lower extremity DVT, the examination is concentrated on a limited compression evaluation of the leg veins. Simple compression ultrasonography, which uses a high frequency linear probe to apply direct pressure to the vein, has a good overall sensitivity for detection of DVT of the leg.97 An acute blood clot forms a mass in the lumen of the vein, and the patho- gnomonic finding of DVT will be incomplete compression of the anterior and posterior walls of the vein (Fig. 20).98,99 In contrast, a normal vein will completely collapse with simple compression. Most distal deep venous thromboses can be detected through Fig. 20. Femoral vein deep venous thrombosis with fresh clot.
50   Perera et al

     simple compression ultrasonography of the leg using standard B-mode imaging, and
     more complicated Doppler techniques add little utility to the examination.100
        Ultrasound may miss some clots that have formed in the calf veins, a difficult area to
     evaluate with sonography.101 However, most proximal DVTs can be detected by
     a limited compression examination of the leg that can be rapidly performed by
     focusing on 2 major areas.102,103 The proximal femoral vein just below the inguinal liga-
     ment is evaluated first, beginning at the common femoral vein, found below the
     inguinal ligament. Scanning should continue down the vein through the confluence
     with the saphenous vein to the bifurcation of the vessel into the deep and superficial
     femoral veins. The second area of evaluation is the popliteal fossa. The popliteal vein,
     the continuation of the superficial femoral vein, can be examined from high in the
     popliteal fossa down to trifurcation into the calf veins. If an upper extremity thrombus
     is clinically suspected, the same compression techniques can be employed, following
     the arm veins up to the axillary vein and into the subclavian vein. Although a good initial
     test, the sensitivity of ultrasound for proximal upper extremity clots is lower than for
     lower extremity clots, as the subclavian vein cannot be fully compressed behind the
     clavicle.104 Although clinically less common, an internal jugular vein thrombosis that
     may form in a patient with a previous central line can also be well seen with ultrasound.
        Previous studies have shown that EPs can perform limited ultrasound compression
     for lower extremity venous clots with good sensitivity in patients with a high pretest
     probability for the disease.105–108 The examination can also be performed rapidly,
     and can be integrated into the overall RUSH protocol with a minimum of added
     time.109

     SUMMARY

     Bedside ultrasound technology has evolved to the point that it offers a powerful, yet
     easy to use tool for the clinician faced with a critical patient. The initial imaging focus
     of ultrasound as used by Radiologists was on anatomy and pathology. Now with clini-
     cians actively using this technology at the bedside, attention has shifted to the crucial
     evaluation of physiology. The ability to recognize both abnormal pathology and phys-
     iology in a critical patient, recognize a distinctive shock state, and arrive at a more
     precise diagnosis represents a new paradigm in resuscitation care. Clinicians around
     the world are recognizing the power of point of care ultrasound and the impact it will
     have on critical care resuscitation in the Emergency Department, as well as in Inten-
     sive Care Units.
        The individual components of the Rapid Ultrasound in SHock protocol have been
     studied and published prior, but this new protocol represents the first synthesis of
     these sonographic techniques into a unified 3 step algorithm. The protocol simplifies
     the ultrasound evaluation into the physiological paradigm of ‘‘pump, tank, and pipes,’’
     allowing the clinician to easily remember the critical aspects of the exam components.
     Although described in a sequential 3-step approach, clinicians are expected to alter
     the components and sequence of sonographic techniques based on the clinical
     scenario presented. Unlike previous published studies that have examined ultrasound
     protocols in the hypotensive patient, the described RUSH exam presents the most
     detailed shock algorithm for use by EPs to date.110 By focusing on both the anatomy
     and the physiology of these complex patients, in shock, bedside ultrasound provides
     the opportunity for improved clinical treatments and patient outcomes.
        For educational ultrasound videos covering all RUSH applications, please go to
     http://www.sound-bytes.tv where a downloadable pocket card on RUSH is also
     available.
The RUSH Exam 51
ACKNOWLEDGMENTS
We would like to acknowledge the work of Scott Weingart, MD and Brett Nelson,
MD on ultrasound evaluation of the hypotensive patient.
REFERENCES
1. Jones AE, Tayal VS, Sullivan DM, et al. Randomized, controlled trial of imme-
diate versus delayed goal directed ultrasound to identify the cause of nontrau-
matic hypotension in emergency department patients. Crit Care Med 2004;32:
1703–8.
2. Jones AE, Aborn LS, Kline JA. Severity of emergency department hypotension
predicts adverse hospital outcome. Shock 2004;22:410–4.
3. Thomas HA, Beeson MS, Binder LS, et al. The 2005 model of the clinical prac-
tice of emergency medicine: the 2007 update. Acad Emerg Med 2008;15(8):
776–9.
4. Heller MB, Mandavia D, Tayal VS. Residency training in emergency ultrasound:
fulfilling the mandate. Acad Emerg Med 2002;9:835–9.
5. ACEP emergency ultrasound guidelines. Ann Emerg Med 2009;14:550–70.
6. Pershad J, Myers S, Plouman C, et al. Bedside limited echocardiography by the
emergency physician is accurate during evaluation of the critically ill patient.
Pediatrics 2004;114:e667–71.
7. Plummer D, Heegaard W, Dries D, et al. Ultrasound in HEMS: its role in differen-
tiating shock states. Air Med J 2003;22:33–6.
8. Kline JA. Shock. In: Rosen P, Marx J, editors. Emergency medicine; concepts
and clinical practice. 5th edition. St Louis (MO): Mosby; 2002. p. 33–47.
9. Shah MR, Hasselblad V, Stevenson LW, et al. Impact of the pulmonary artery
catheter in critically ill patients: meta-analysis of randomized clinical trials.
JAMA 2005;294:1664–70.
10. Joseph M, Disney P. Transthoracic echocardiography to identify or exclude
cardiac cause of shock. Chest 2004;126:1592–7.
11. Bealieu Y. Specific skill set and goals of focused echocardiography for critical
care physicians. Crit Care Med 2007;35:S144–9.
12. Viellard-Baron A, Page B, Augarde R, et al. Acute cor pulmonale in massive
pulmonary embolism: incidence, echocardiography pattern, clinical implica-
tions and recovery rate. Intensive Care Med 2001;27:1481–6.
13. Grifoni S, Olivotto I, Cecchini P, et al. Utility of an integrated clinical, echocardio-
graphic and venous ultrasound approach for triage of patients with suspected
pulmonary embolism. Am J Cardiol 1998;82:1230–5.
14. Jardin F, Veillard-Baron A. Ultrasonographic examination of the vena cavae.
Intensive Care Med 2006;32:203–6.
15. Randazzo MR, Snoey ER, Levitt MA, et al. Accuracy of emergency physician
assessment of left ventricular ejection fraction and central venous pressure
using echocardiography. Acad Emerg Med 2003;10:973–7.
16. Jang T, Aubin C, Naunheim R, et al. Ultrasonography of the internal jugular vein
in patients with dyspnea without jugular venous distention on physical examina-
tion. Ann Emerg Med 2004;44:160–8.
17. Connolly JP. Hemodynamic measurements during a tension pneumothorax. Crit
Care Med 1993;21:294–6.
18. Carvalho P, Hilderbrandt J, Charan NB. Changes in bronchial and pulmonary
arterial blood flow with progressive tension pneumothorax. J Appl Physiol
1996;81:1664–9.You can also read