Design and Comparative Performance of a Robust Lung Auscultation System for Noisy Clinical Settings
←
→
Page content transcription
If your browser does not render page correctly, please read the page content below
IEEE JOURNAL OF BIOMEDICAL AND HEALTH INFORMATICS, VOL. 25, NO. 7, JULY 2021                                          2583

        Design and Comparative Performance of a
            Robust Lung Auscultation System
                for Noisy Clinical Settings
                   Ian McLane , Dimitra Emmanouilidou, James E West, and Mounya Elhilali

   Abstract—Chest auscultation is a widely used clinical                       diagnosis of respiratory conditions presents a major challenge
tool for respiratory disease detection. The stethoscope                        toward successful triage and treatment [1]. The use of chest
has undergone a number of transformative enhancements                          auscultation to rapidly screen for and diagnose lung diseases
since its invention, including the introduction of electronic
systems in the last two decades. Nevertheless, stetho-                         and infections has been in practice since the invention of the
scopes remain riddled with a number of issues that limit                       stethoscope by R.T.H. Laennec in 1816 [2]. Stethoscopes are
their signal quality and diagnostic capability, rendering                      used in respiratory examination to distinguishing normal respi-
both traditional and electronic stethoscopes unusable in                       ratory sounds from crackles, wheezes, and pleural rub in order
noisy or non-traditional environments (e.g., emergency                         to make correct diagnoses and remain a key diagnostic device
rooms, rural clinics, ambulatory vehicles). This work out-
lines the design and validation of an advanced electronic                      due to their portability, low cost, and noninvasive nature.
stethoscope that dramatically reduces external noise con-                         Despite its universal adoption, the use of the stethoscope is
tamination through hardware redesign and real-time, dy-                        riddled by a number of issues including subjectivity in interpre-
namic signal processing. The proposed system takes ad-                         tation of chest sounds, interlistener variability and inconsistency,
vantage of an acoustic sensor array, an external facing
                                                                               need for medical expertise, and vulnerability to airborne ambient
microphone, and on-board processing to perform adaptive
noise suppression. The proposed system is objectively                          noise. The presence of background noise is particularly impor-
compared to six commercially-available acoustic and elec-                      tant because acoustic systems have several noise transmission
tronic devices in varying levels of simulated noisy clini-                     paths–chestpiece, tubing, and earpieces–through which airborne
cal settings and quantified using two metrics that reflect                     noise tends to ‘leak’ and mask body sounds, rendering the
perceptual audibility and statistical similarity, normalized                   interpretation of these sounds challenging or impossible and
covariance measure (NCM) and magnitude squared coher-
ence (MSC). The analyses highlight the major limitations of                    exacerbating the other issues related to subjectivity and variabil-
current stethoscopes and the significant improvements the                      ity. In global health or emergency medicine environments, noise
proposed system makes in challenging settings by mini-                         levels far exceed those of a clinical environment (approximately
mizing both distortion of lung sounds and contamination                        75 dB SPL) and frequently exceed the approximate upper limit
by ambient noise.                                                              of correct detection of abnormal breath sounds (an average of
  Index Terms—Stethoscope, biomedical acoustics,                               81 dB SPL) [3]. Health care providers in resource-limited or
adaptive signal processing, signal to noise ratio, public                      non-traditional settings rely upon low-cost tools or clinical pre-
healthcare.                                                                    sentations to make critical patient management decisions, rarely
                                                                               relying on auscultation due to these limitations [4]. However,
                                                                               one study showed that including auscultatory findings in the
                         I. INTRODUCTION
                                                                               WHO case management guidelines for pneumonia significantly
      ESPIRATORY diseases and illnesses pose some of the
R     most serious threats to individuals and to the public, af-
fecting over 600 million people worldwide; early and accurate
                                                                               increased correct identification of radiographically-confirmed
                                                                               pneumonia by 16% [5].
                                                                                  Electronic stethoscopes were introduced in the last few
                                                                               decades, opening up new opportunities for sound amplification,
                                                                               enhanced frequency range, quality improvement, and comput-
   Manuscript received April 7, 2020; revised September 14, 2020 and           erized analysis. Passive filtering improves the sound quality,
November 23, 2020; accepted January 24, 2021. Date of publica-                 but these systems are still susceptible to dynamic noise seen
tion February 3, 2021; date of current version July 20, 2021. This
work was supported in part by the National Institutes of Health under          in most real-world environments [6]. In many settings, back-
Grants R01HL133043, U01AG058532, and R43MD014104 and in part                   ground chatter and other environmental noises are common, and
by the Office of Naval Research under Grants N000141912014 and                 patient motion contaminates the sound signal picked up by the
N000141912689. (Corresponding author: Mounya Elhilali.)
   The authors are with the Department of Electrical and Com-                  stethoscope. Several electronic systems (e.g., Littmann 3200 and
puter Engineering, Johns Hopkins University, Baltimore, MD 21218               Eko Core) are additionally plagued by the same airborne sound
USA (e-mail: imclane1@jhu.edu; dimitra.emmanouilidou@gmail.com;                transmission paths as acoustic stethoscopes by using a traditional
jimwest@jhu.edu; mounya@jhu.edu).
   Digital Object Identifier 10.1109/JBHI.2021.3056916                         chestpiece or a small loudspeaker and traditional binaural tubing.

                  2168-2194 © 2021 IEEE. Personal use is permitted, but republication/redistribution requires IEEE permission.
                                See https://www.ieee.org/publications/rights/index.html for more information.

     Authorized licensed use limited to: Johns Hopkins University. Downloaded on September 30,2021 at 13:10:00 UTC from IEEE Xplore. Restrictions apply.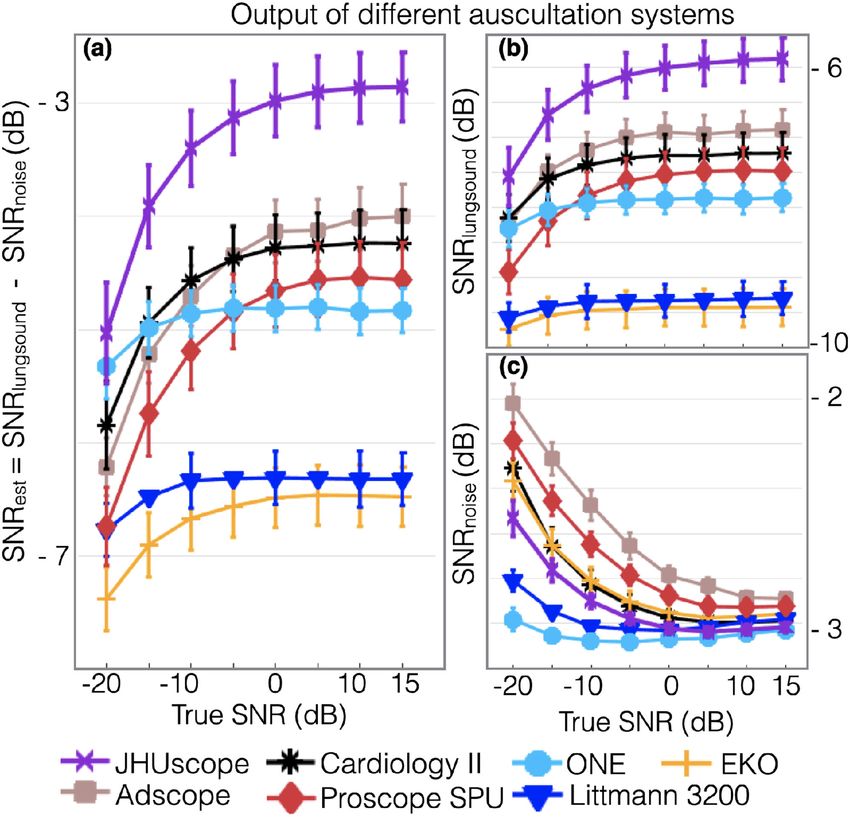
2584                                                                   IEEE JOURNAL OF BIOMEDICAL AND HEALTH INFORMATICS, VOL. 25, NO. 7, JULY 2021

Therefore, most acoustic and electronic commercial devices are
meant to be used only in controlled clinical environments (e.g.,
a quiet doctor’s office) or in stationary noise. They tend to be
unusable in noisy clinical settings such as emergency or operat-
ing rooms, ambulances, or outpatient or rural clinics. Because of
these limitations, development of automated approaches based
on computer-aided auscultation for these electronic systems also
remain in their infancy [7]–[10].
   The aim of this work is to design an adaptable and multi-
purpose device that could be used across the spectrum of clin-
ical environments by any type of healthcare provider, and was
uniquely designed to overcome known limitations of current
devices. This paper presents a comprehensive platform which
includes both hardware and software redesign to improve sens-
ing, acquisition, and analysis of body-generated sounds. The
proposed system comprises a collection of sensing and func-
tional components—a microphone array, an external facing mi-
crophone, an audio codec, and on-board processing—packaged
                                                                                   Fig. 1. Illustrations and photo the device. (a) Three-dimensional ren-
as a standalone device that can be deployed into the field. The                    dering of the proposed smart stethoscope slice to demonstrate the
microphone array maximizes the measurement sensitivity and                         internal hardware components. (b) Basic circuit diagram and operation
uniformity, while the external facing microphone is used for                       of the proposed system.
adaptive noise suppression. The algorithm was designed specif-
ically for auscultation, dynamically adapting to the environment
and actively suppressing unwanted interfering noise, including                     surface. The noise robustness results reveal that there is a mix in
noises with a spectral profile and temporal signature that overlap                 the performance of auscultation systems: some perform best in
with the body sounds.                                                              quiet conditions while others prove effective in noisy environ-
   In order to objectively quantify the design improvements, the                   ments. The proposed hardware system with real-time adaptive
proposed device is compared against 6 commercially available                       noise suppression maintains a low coherence with ambient noise
stethoscopes ranging from acoustic designs to electronic state-                    while preserving the lung sounds as much as possible, outper-
of-the-art technologies. These specific devices were selected                      forming the commercial devices in all simulated environments.
because they each represent unique construction and parameters
that influence the characteristics of the transmitted sound and                                         II. SYSTEM ARCHITECTURE
deliver a different performance. The performance of the systems
                                                                                      The proposed programmable stethoscope (called the JHUs-
is accounted for in terms of several key metrics: 1) sensitivity
                                                                                   cope here) mitigates a number of limitations in existing auscul-
and uniformity of the transducing mechanism, 2) agreement with
                                                                                   tation systems with an on-board microprocessor and a unique
and quality-preservation of the transmitted body signals, and 3)
                                                                                   sensor design. The sensor design increases sensitivity while the
resistance to unwanted ambient noise events.
                                                                                   microprocessor enables real-time capabilities such as adaptive
   The type of validation that is presented in this paper is not
                                                                                   noise suppression and automatic volume control. The design also
reasonable to do in real-world scenarios with this number of
                                                                                   incorporates other features including on-board memory, battery
devices: exact comparison is limited by the reproducibility of
                                                                                   life optimization, and patient motion detection. Of primary
body sounds in patients and ambient noise profiles in the real
                                                                                   importance, it was designed to be small, dependable, and simple
world. We therefore use custom setups for reproducibility. For
                                                                                   to operate. Overall dimensions are 40 mm (height) ×40 mm
sensing sensitivity, an 9-driver array was used to determine
                                                                                   (diameter), and 45.5 g in weight.
position-dependency and sensitivity of the sensor. For quality-
preservation of body sounds and noise robustness, a chest sound
simulator to emit signals recorded from normal and abnormal                        A. Hardware
patients is placed in an artificial clinical setting, created using                   The core of the digital hardware design includes a micro-
a sound booth wherein an 6-speaker setup broadcasts noises                         phone array, an external facing microphone, an audio codec, a
of various types and volume levels. A combination of different                     microprocessor, and a headphone jack for listening (Fig. 1). The
objective quality measures adapted from speech processing are                      acoustic array consists of five omnidirectional electret micro-
used to report performance for the various systems. By using                       phones (Shenzhen Horn Electroacoustic Technology, China), in
these setups, we are able to directly compare the proposed device                  addition to an externally-facing microphone that is matched with
to many devices in hundreds of combinations of lung sounds and                     the array microphones and used for adaptive noise suppression.
ambient noises, and eliminate uncertainty across the analysis.                     The patient-facing microphones are laid out in a cross pattern to
   The sensing sensitivity analysis reveals that acoustic systems                  maximize uniform surface sensitivity, a topic we examine further
with a diaphragm are highly sensitive to placement, while the                      in Section III-A. The audio signals from the sensing array are
proposed system provides uniformity across the entire pick-up                      summed with identical and time-invariant weight factors, and

       Authorized licensed use limited to: Johns Hopkins University. Downloaded on September 30,2021 at 13:10:00 UTC from IEEE Xplore. Restrictions apply.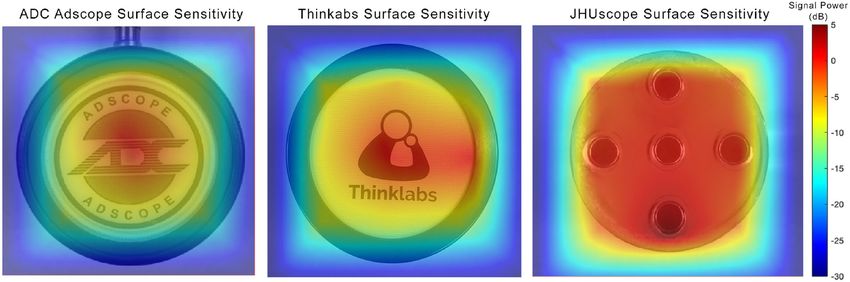
MCLANE et al.: DESIGN AND COMPARATIVE PERFORMANCE OF A ROBUST LUNG AUSCULTATION SYSTEM FOR NOISY CLINICAL SETTINGS                                         2585

both the array signal and ambient signal are processed through a               one entry point (the earpiece), but does not control for airborne
96 kHz, 24-Bit ultra-low power NXP audio codec (NXP Semi-                      ambient noise contamination at the chestpiece. Therefore, the
conductors, Netherlands), which coordinates data acquisition,                  JHUscope runs a real-time adaptive noise suppression tech-
analog-to-digital conversion, and transfer to the digital signal               nique on the device that optimizes both the removal of ambient
processing (DSP) block of the microprocessor.                                  noise and the preservation of the signal in question, with better
   The microprocessor is a Kinetis microcontroller with an                     quality than existing systems. At the core, the algorithm is an
ARM Cortex-M4 core (NXP Semiconductors, Netherlands).                          extension of classic spectral subtraction used in the fields of
The Kinetis microprocessor was chosen because of its                           communication and speech enhancement in that it operates in the
small footprint, low power consumption, and low-cost                           frequency domain and suppresses the ambient noise spectrum
without compromising processing speed and DSP-specific                         d(n) from the noisy auscultation spectrum y(n) [11], [12]. A
architecture.The embedded microprocessor is a key component                    full account and validation of the algorithm has been presented
of the JHUscope hardware, as it aims to run a number of                        before (see [13] for complete details), but the real-time imple-
algorithms to enable more intelligent capabilities to the system.              mentation will be summarized next.
In its current form, the microcontroller is used to implement the                 The device captures both y(n) and d(n) simultaneously
real-time processing discussed in Section II-B. The inclusion                  through a dual microphone setup, as described in Section II-A.
of the microcontroller also allows for increased flexibility in                The algorithm then maps short-time frames of the two signals
future iterations, including the addition of other sensors such                into the spectral domain using a short-term Fourier transform,
as inertial measurements to augment analysis methods.                          resulting in signals Yτ (ωk ) and Dτ (ωk ); where ωk indexes
   Because this system is intended to be used in clinical, emer-               k = 1, . . ., 32 frequency bands and τ is used to represent pro-
gency medical, and global health environments, it was also care-               cessing over short-time windows w(n). The ambient noise is
fully designed in a way that offers optimal battery consumption.               then suppressed in an adaptive manner, such that
The device is powered by 3.7 V/500 mAh Li+ battery. The
                                                                                            |X̂τ (ωk )|2 = |Yτ (ωk )|2 − γτ λk |Dτ (ωk )|2                 (1)
system has an average current draw of 75 mA with peak current
draws up to 120 mA and sleeping current draw less than 3 mA,                   where γτ and λk are time and frequency scaling coefficients,
meaning the battery lasts close to 6 hours of continuous usage                 respectively. These coefficients are adjusted automatically for
or 2-3 days of normal clinical usage.                                          each 50 ms time frame τ by the current SNR of that time frame,
   In addition, the design includes on-board storage for data                  and for each frequency band k by the spectral profile of the
collection in the field and a micro-USB interface for recharging               signals and a priori knowledge of body sound profiles [14]. An
the battery of the device. The device is controlled through push               estimate of the true lung sound signal x̂τ (t) is then obtained by
buttons to control volume, initiate data recording, and powering               applying the inverse Fourier transform on X̂τ (ωk ) and then im-
the device on and off. LED indicators serve as simple visual                   plementing a real-time version of overlap-and-add using circular
guides for the user during the operation of the system. Users can              buffers. This localized time and frequency treatment is especially
listen in real-time through a standard 3.5 mm headphone jack,                  crucial given the variable, unpredictable, and nonuniform nature
which is enabled through the same NXP audio codec used for                     of noise that overlap in time and in frequency with lung sounds.
signal acquisition (Fig. 1).                                                      This algorithm was previously tested on real pediatric data
   The device can also be easily reprogrammed through the                      collected from busy or remote clinic centers with challeng-
micro-USB connected to a computer. Due to the programmable                     ing noise environments, part of a large-scale pneumonia eti-
nature of the JHUscope, this same hardware system can be                       ology study (PERCH) [15]. Lung signals from 22 infants ac-
programmed to implement updates to signal processing, usabil-                  quired in Gambia were analyzed using this algorithm. Objective
ity features, and real-time computerized lung sound analysis                   quality measures were used to compare the algorithm to an
(CLSA). Noise suppression combined with CLSA would enable                      Adaptive-Noise-Canceling scheme (FXLMS) [16], [17]. While
this system to be deployed in all types of traditional and non-                the FXLMS algorithm was shown to deliver reasonable signal
traditional clinical settings to provide objective and repeatable              quality under controlled noise environments, it was unable to
respiratory assessment at a low cost.                                          adapt fast enough to the high non-stationary nature of noise in
                                                                               a real-life, busy clinic. Furthermore, formal listening tests were
                                                                               performed by presenting a panel of 17 experts, a majority of
B. Software
                                                                               whom were pediatric pulmonologists, with auscultation signals
   One of the key challenges of performing noise cancellation in               with and without processing through the proposed denoising
auscultation systems is to deliver a noise-free signal that com-               algorithm in a blind listening judgment of signal quality. An
pletely removes any distortions from airborne ambient noise, all               overwhelming 95.1% of cases processed through the proposed
while cautiously avoiding cancellation of auscultation patterns                algorithm were preferred by the panel of experts, further con-
that are indicative of disease and can easily masquerade as                    firming the efficacy of the denoising software at delivering im-
noise (e.g., crackling noises from the lung masquerading as                    proved quality signals without removing the clinically-important
patient-generated noise).                                                      information in the auscultation signal [13].
   The simple addition of active noise cancelling (ANC) head-                     Finally, the system also includes an an automatic volume
phones to an electronic stethoscope does not adequately address                control (AVC) block to amplify signals of interest and reduces
these challenges because ambient noise is only controlled at                   loud, explosive signals caused by device or patient motion or

     Authorized licensed use limited to: Johns Hopkins University. Downloaded on September 30,2021 at 13:10:00 UTC from IEEE Xplore. Restrictions apply.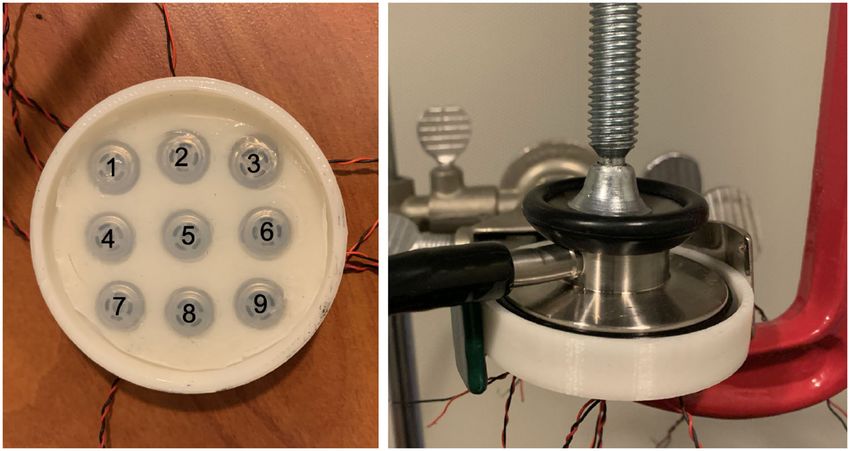
2586                                                                   IEEE JOURNAL OF BIOMEDICAL AND HEALTH INFORMATICS, VOL. 25, NO. 7, JULY 2021

                                                                                                              TABLE I
                                                                                    SPEAKER PLACEMENT RELATIVE TO THE POSITION OF THE STETHOSCOPE
                                                                                                   ON THE CHEST SOUND SIMULATOR

                                                                                      First, we compare the spectral power for each yij (t) and
Fig. 2. Nine driver array setup (numbered) to determine surface sen-
sitivity (left) and an example of how devices were affixed to the driver           compare to the center position y5j (t). The spectral power was
array during recording (right).                                                    calculated for frequencies in the range of [100, 1000] Hz, which
                                                                                   is where the majority of the power lies in lung sounds [14].
                                                                                   An average
                                                                                           1
                                                                                             20power for each driver position i is calculated as
                                                                                   P̄i = 20      j=1 Pij , where the power of recorded signals Pij are
friction. The AVC is designed as a traditional audio compressor
                                                                                   averaged for all j trials. Each P̄i is then compared to the average
that decreases the signal when the measured level is above the
                                                                                   power from the center position P̄5 , calculated as logarithmic
programmed threshold. The threshold, the attack rate (the rate at
                                                                                   ratio P = 10 log(P̄i /P̄5 ).
which the incoming signal is attenuated down to the threshold)
                                                                                      Second, an analysis of variance (ANOVA) test is done to de-
and the decay rate (the rate at which this volume returns back
                                                                                   termine whether there are any statistically significant differences
to its original level) are programmable, and customized so that
                                                                                   between the full spectra of the driving and recorded signals at the
the AVC does not distort important clinical sounds such as heart
                                                                                   nine positions for the three systems. To do this, the euclidean
sounds.
                                                                                   distance is measured between the magnitude spectrum of the
                                                                                   recorded signal |Yij (n)|2 and the magnitude spectrum of the
                               III. METHODS                                        driving pink noise signal |Xp (n)|2 .

   Two specific performance measures were chosen to compare                                                     N
                                                                                                 2       2
the JHUscope to the commercially-available systems: the JHUs-                         dij (|Yij | , |Xp | ) =            (|Yij (n)|2 − |Xp (n)|2 )2 (2)
                                                                                                                       n=1
cope’s performance needs to balance high sensitivity with noise
                                                                                   Considering the distance dij for each of the i positions as a
robustness to ensure that the device can be used by all personnel
                                                                                   group, and each of the j trials for that position as observations
in any type of environment. The following setups were used
                                                                                   for that group, we use a one-way ANOVA to determine if there
to perform objective and repeatable assessment based on these
                                                                                   a statistical significance in the distances between spectra based
performance measures.
                                                                                   on position. In other words, this test determines whether the
                                                                                   position of the input signal changes the output response of the
A. Sensing Sensitivity                                                             systems.
   Sensing sensitivity examines the optimal positioning against
the body by determining the sensitivity of the system’s pickup                     B. Clinical Simulation
surface. The sensing sensitivity is assessed by clamping the head                     The evaluation of the quality of the body signals that is
of the JHUscope and subsequently, for comparison, a represen-                      delivered to the end-user of the JHUscope is compared to
tative acoustic stethoscope (ADC Adscope), and a representative                    other commercially-available stethoscopes in both quiet and
electronic stethoscope (Thinklabs One) directly on top of a                        extremely noisy environments. Noise robustness quantifies the
3-by-3 array of 8.5mm-diameter headphone drivers (Shenzhen                         deterioration in auscultation signal quality as a function of back-
Horn Electroacoustic Technology, China) spaced 4.5 mm apart                        ground noise. The proposed auscultation system was compared
and covered with a 2.5 mm layer of Ecoflex (Smooth On Inc., PA,                    against six commercially available systems, including state-of-
USA) to account for the inertial loading introduced by the skin                    the art and widely used acoustic or electronic devices, as listed in
on the diaphragm. Ecoflex was chosen because of the similar                        Table II. These systems are chosen to represent a wide selection
mechanical properties to that of human skin [18]. See Fig. 2 for                   of options including acoustic and electronic devices as well as
a depiction of the driver array setup.                                             a wide range of features from static systems to active filtering
   A low-amplitude driving signal of pink noise xp (t) is played                   ones. It is important to note that this selection is not meant as
from each driver position successively and output signals yij (t)                  an exhaustive list of all stethoscopes on the market, nor is it
are recorded for the individual driver positions i = [1, .., 9] over               a statement about the performance of these systems in clinical
j = [1, .., 20] trials. Two comparisons are done to assess the                     settings. It is rather a comparison of their individual performance
role location and placement plays in the acoustic and proposed                     under specific simulated conditions.
auscultation systems. The comparisons are only done with the                          The noise robustness validation tests are performed in a
diaphragm side of the acoustic stethoscope due to findings that                    simulated noisy clinical setting recreated inside a sound booth
deny the claims there is a significant difference in filtering                     in order to control the acoustic environment. Real auscultation
between the diaphragm and bell settings [19].                                      sounds from both normal and abnormal lungs are played from a

       Authorized licensed use limited to: Johns Hopkins University. Downloaded on September 30,2021 at 13:10:00 UTC from IEEE Xplore. Restrictions apply.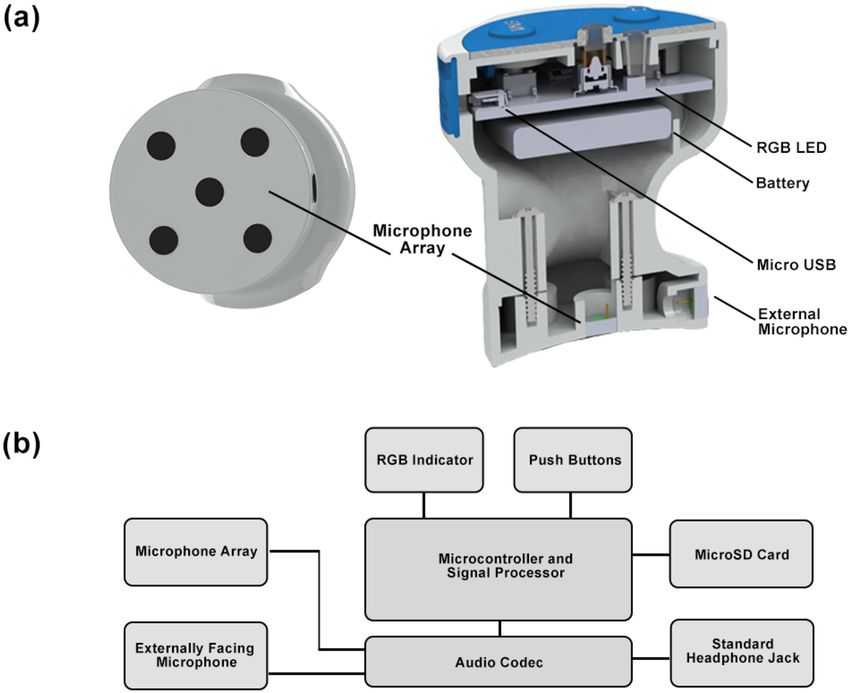
MCLANE et al.: DESIGN AND COMPARATIVE PERFORMANCE OF A ROBUST LUNG AUSCULTATION SYSTEM FOR NOISY CLINICAL SETTINGS                                          2587

Fig. 3. Schematic of the experimental setup illustrating the placement of the loudspeakers and the chest sound simulator (rectangular prism) from
the side (left) and the top (right). h is the loudspeaker’s height position and d is the horizontal distance from the center of the chest sound simulator.
The loudspeakers all face towards the chest sound simulator.

                             TABLE II                                              For a given noise background and condition (signal-to-noise
             LIST OF STETHOSCOPE DEVICES AND SETTINGS
                                                                                level), a commercially available stethoscope or the JHUscope are
                                                                                positioned on top of the chest simulator in this setup and used to
                                                                                auscultate the reference signals while a calibrated microphone
                                                                                is placed directly above it to capture the ambient noise signal.
                                                                                    2) Chest Auscultation Simulation: A chest sound simulator
                                                                                transmitted digital breath signals at a low, fixed level (compara-
                                                                                ble to real chest auscultation signals) via a connected computer
                                                                                installed outside of the soundbooth. It was built comprising
                                                                                of a Jawbone Jambox loudspeaker with frequency response
                                                                                of 40–20 000 Hz and improved low-frequency sensitivity (via
                                                                                a proprietary bass radiator). The loudspeaker was covered in
                                                                                1.5 in-thick medical synthetic gelatin (Humimic Medical, USA)
                                                                                that closely simulates the density and mechanical properties of
chest sound simulation device, custom-built out of a loudspeaker                human muscle tissue and can be kept at room temperature with-
covered in ballistic gelatin mimicking human tissue characteris-                out deforming [20], [21]. The gelatin was baked at 200°F for 4
tics. The resulting signals emulate lung signals emanating from                 hours. A mold of the Jawbone Speaker was then placed inside the
the body, used here as a reference for comparison. The use of this              ballistic gelatin and it was allowed to cool at room temperature
setup ensured: i) control over the volume level of the emanating                for 12 hours. The mold was replaced with the speaker and sealed
body sounds and ambient noise, ii) control over the variety of the              with a heat gun; acoustic foam was placed at the bottom of
presented sounds iii) a repeatable setup for comparison among                   the simulator to attenuate high frequency resonance and noise
various simulated noise profiles, iv) uniformity in sound pick-up               coming from areas of contact with the table.
among auscultation systems, and v) reproducibility of results.                     Each auscultation system was placed individually at a single
    1) Clinical Room Simulation: Six loud speakers, one table,                  designated location on top of the chest simulator and held in
and one chest sound simulator were placed inside a sound booth                  position using a clamp to apply moderate pressure and ensure
of dimensions 148 in (long) x 123 in (wide) x 89 in (high),                     the setup remained the same throughout the completion of all
(Fig. 3). The table was positioned towards one end of the room                  simulations for each system.
while the six Genelec 6010 A loudspeakers were arranged to                          3) Data Preparation: A collection of ten abnormal and ten
roughly face towards the table at different height placements                   control breath sounds of 10 s duration each were selected from
(Table I), independently broadcasting noise sounds of various                   a dataset of auscultation signals [22]. The abnormal group con-
types and levels, reflecting a variety of examination settings from             sisted of breath sounds containing wheeze, crackle and stridor
a quiet room to a busy clinic. On top of the table, the chest sound             sounds, while the control group consisted of mostly normal
simulator transmitted low volume body signals. The noise and                    breath sounds recorded over various chest and tracheal areas.
body sounds were delivered via a connected computer, stationed                  All digital clips were downsampled to 8 kHz.
outside of the sound booth.

      Authorized licensed use limited to: Johns Hopkins University. Downloaded on September 30,2021 at 13:10:00 UTC from IEEE Xplore. Restrictions apply.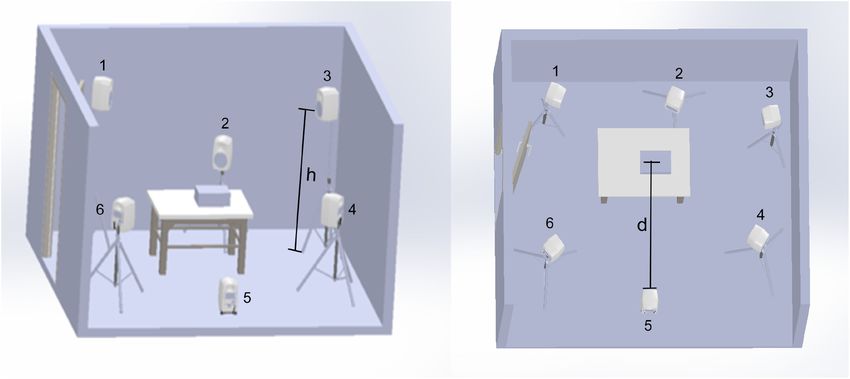
2588                                                                   IEEE JOURNAL OF BIOMEDICAL AND HEALTH INFORMATICS, VOL. 25, NO. 7, JULY 2021

   The High Stationary group of ambient noises consisted                           where P∗ (n) is the average signal power of the nth time frame;
of several colored noise subgroups including white, pink, vi-                      s corresponds to the sound signal recorded on the designated
olet, blue and brown, and fan-like noise found in the BBC                          reference point on top of the chest simulator; d corresponds to
database [23]. In total, 20 ten-second clips were selected from                    the net ambient noise picked up adjacent to this designated point.
each subgroup, resulting in 120 High Stationary noise sounds.                      Due to the dynamic nature of the lung sounds and noises as well
   The Low Stationary noise group consisted of noise types                         as the randomly interjected silence periods, the calculation of
found in the BBC and NoiseX-92 databases [23], [24], and                           SN Rtrue considered only the top 30% of frames in order to
included subgroups of hospital ICU noise, hospital corridor                        capture the highest average signal power. This way, it is ensured
noise, pulse monitor sounds, ambulance noise, babble noise                         that no sound events exceed the desired SNR, while allowing
and ambient talk, baby cry, street noise, chirping birds. Random                   for lower sound level events to be present.
silence periods were interjected to the noise clips to accentuate                      5) Sound Capture: For the calculation of the true SNR in
their non-stationary nature. An equal number of sounds were                        Section III-B4, signals of interest s and d were recorded inde-
selected from each subgroup and sorted according to their aver-                    pendently (not simultaneously). Signals s and d were obtained
age Power Spectral Entropy value (Eq. (3)), which was used as a                    using two 1/4” PCB Piezotronics prepolarized, omnidirectional
stationarity index such that minimum entropy occurs for highly                     condenser microphones, connected to a Brüel & Kjaer 5935-L
variable sounds (low stationary noises) and maximum entropy                        preamplifier at 20 dB gain. The first microphone was placed
occurs when the spectral distribution in uniform (high stationary                  on top of the chest simulator, facing downwards for recording
noises).                                                                           signal s; and the second microphone was placed adjacent to the
                                                                                   first with a separating distance of 10 cm, facing upwards, for
                                 1
                                    M
                                                                                   recording signal d. The distance of these microphones from the
                     P SE =            P SE(m)                             (3)
                                 M m=1                                             speakers follows the positioning presented in Table I and it is
                                                                                   assumed that the signal power from the speakers is equal at both

                                   K
                                                                                   microphones.
                P SE(m) = −              p(m, k) ln p(m, k)                (4)        For the calculation of the quality metrics presented in Sec-
                                   k=1
                                                                                   tion III-C, simultaneous recordings were captured from the
                              P
                               SD(m, ωk )                                          auscultation signal y, the reference sound driving the simulator
                  p(m, k) = K                                             (5)     x, and the ambient microphone d. Digital sounds from the

                             k=1 P SD(m, ωk )                                      auscultation system were captured using an 8-track ZOOM H4
where index m = 1, . . ., M signifies the processing windows of                    recorder, situated outside the sound booth. All inherent sound
duration 100 ms, ωk with k = 1, . . ., K and K = 1024 corre-                       effects and sound filters were disabled and the master recording
sponds to the frequency index, and P SD to the multitaper power                   gain was set at 0 dB.
spectral density estimate [25]. In a ranked list from lowest to
highest entropy, the first 120 sounds were selected and attributed                 C. Quality Metrics
to the Low Stationary group; the rest were discarded.
                                                                                      The signal fidelity and noise robustness of each device is
    4) Sound Playback: While the chest sound simulator emitted
                                                                                   quantified by comparing the recorded auscultation signal y
the selected body sounds at a fixed low volume, the loudspeakers
                                                                                   against the reference signal x that is driving the respiratory sound
independently broadcasted noise sounds randomly selected from
                                                                                   simulator as well as against the noise background d recorded
the database. The volume of individual speakers was set to a
                                                                                   by a calibrated microphone positioned above the chest sound
random difference of {0, ± 0.5, ± 1, ± 2} dB from each other.
                                                                                   simulator. This is done in order to assess two aspects of the
The master speaker volume was automatically adjusted at the
                                                                                   signal: (1) how distorted the recorded signal is relative to the
beginning of each trial, ensuring a net noise effect of signal-to-
                                                                                   reference signal; and (2) how much leakage the device has in
noise ratio at various levels, SN Rtrue ∈ {−20, −10, 0, 10, 15}
                                                                                   terms of letting noise mask the recorded auscultation.
dB. All transmitted lung sound clips were pre-amplified in-
                                                                                      There is currently no agreed upon standard for auscultation,
dependently to ensure equal average sound levels. In total 10
                                                                                   so two existing objective quality metrics were chosen to quantify
normal and 10 abnormal lung sounds were used, each assigned
                                                                                   the similarity between the reference and measured signals and
to 5 random net noise combinations (trials), resulting in a set of
                                                                                   the amount of dissimilarity between the ambient and measured
100 sound recordings per SN Rtrue value: 50 abnormal and 50
                                                                                   signals: normalized covariance measure (N CM ) and magnitude
normal.
                                                                                   squared coherence (M SC) [26]. Although N CM is a speech-
   The true SNR level, SN Rtrue , for each lung sound/net noise
                                                                                   based measure (as are most quality measures in the literature),
combination was determined by the short-term average of the
                                                                                   it is biased by the perceptual system, accounting for signal
ratio of the individual signal powers, averaged over M frames
                                                                                   audibility at various frequency bands for the human ear hence
of duration 100 ms each:
                                                                                   reflecting a general account of improved quality of a signal as
                           1                                                      perceived by a human listener, or in this case the auscultating
                              M
                                         Ps (n)
                SN Rtrue =       10 log10                                  (6)     clinician, on a scale of 0 (lowest quality) to 1 (highest quality).
                           M m=1          Pd (n)
                                                                                   M SC is a statistical index that operates in the spectral domain

       Authorized licensed use limited to: Johns Hopkins University. Downloaded on September 30,2021 at 13:10:00 UTC from IEEE Xplore. Restrictions apply.
MCLANE et al.: DESIGN AND COMPARATIVE PERFORMANCE OF A ROBUST LUNG AUSCULTATION SYSTEM FOR NOISY CLINICAL SETTINGS 2589
and examines the relation between two signals. Unlike N CM , 3) Overall Quality Metric: Both NCM and MSC are invariant
this metric treats the full frequency spectrum evenly and linearly to amplification of the input signals and obtain values between
and the inclusion of M SC limits the shortcomings of using a in the range of [0,1]: 0 when the signals under consideration
perceptually biased metric alone. As with N CM , M SC gives have low similarity and 1 when the signals have high similarity.
a value of 1 for signals that have exact coherence to each other. As a reference, a value of zero would be obtained if one of
The metrics were chosen for their i) objective and standard- the compared signal originated from a white Gaussian pro-
ized quality assessment ii) high correlation to human intelligi- cess. NCM and MSC were computed over M non-overlapping
bility scores, and iii) independence to signal amplification or Hamming windows, the durations of which varied from short
volume variations of the signals. The measures also highlight to longer windows, p = {0.1, 0.5, 1, 2} sec, to compare the
two different aspects of the system: MSC values are not affected measured output of the auscultation system y to the refer-
by non-linear operations whereas NCM is a measure that reliably ence lung sound signal driving the chest simulator x and to
predicts the effects of non-linear operations such as envelope the concurrent net ambient noise during auscultation d. An
thresholding or distortions introduced by spectral-subtraction overall metric Qp takes the geometric mean of the NCM and
algorithms [27]. MSC metrics for each window length p and each x-y and d-y
1) Normalized Covariance Measure: N CM uses the co- pairs:
variance of the spectral envelopes of two signals x and y to N CMp (∗, y), +M SCp (∗, y)
calculate the Signal to Noise quantity SN RN CM , weighted by Qp (∗, y) = (11)
2
band-importance factors Wj [26]
Qp is then averaged across all windows to create combined
J
j=1 Wj SN RN CM (xj , yj ))
metrics accounting for the faithful representation of the emitted
N CM (x, y) = 10 log10 J (7) lung sounds (SN Rlungsound ) and the amount of noise leakage
j=1 Wj into the auscultated signal (SN Rnoise ).
The center frequencies for the 8 bands j = 1, . . ., J follow the
1
P
Bark scale from 150 Hz to 4000 Hz. The corresponding band- SN Rlungsound = Qp (x, y) (12)
widths and band-importance weights Wj , follow the ANSI-1997 P p=1
standards [28]. The Signal to Noise quantity SN RN CM was
1
P
calculated over M windows, as follows:
SN Rnoise = Qp (d, y) (13)
2
P p=1
( Mm=1 Vx (m, j)Vy (m, j))
μ μ
SN RN CM (xj , yj ) = M
1−( m=1 Vxμ (m, j)2 M μ 2 Finally, a single SNR metric, SN Rest , is calculated by sub-
m=1 Vy (m, j) )
(8) traction of SN Rnoise from SN Rlungsound . Since the signal
metrics NCM and MSC (and therefore Qp , SN Rlungsound , and
Vxμ (m, j) = Vx (m, j) − μx (j) (9) SN Rnoise ) are calculated in the logarithmic scale, the subtrac-
tion of these metrics represents the division of linear-scaled
where Vx (m, j) is the centered spectral envelope of signal x
SN Rlungsound and SN Rnoise metrics.
for band j and window m, and μx (j) is the time average of
envelopes Vx (m, j) for all m = 1, . . ., M windows for signal x. SN Rest = SN Rlungsound − SN Rnoise (14)
The denominator comprizes of normalization factors that render
A graphical representation of the signal analysis methodology
quantity SN RN CM limited within [0, 1]; notice that N CM is included in Fig. 4.
metric is also invariant to scalar multiplications of the input
signals. D. Stethoscope Systems
2) Magnitude Squared Coherence: M SC uses the normal-
ized cross spectral energy to calculate a measure of coherence: Six commercially available acoustic and electronic stetho-
scope were chosen to represent construction and parameters
1
K
|Pxy (ωk )|2 of a majority of devices available currently; these parameters
M SC(x, y) = 10 log10 (10)
K Pxx (ωk )Pyy (ωk ) influence the characteristics of the transmitted sound and perfor-
k=1
mance in noise settings. An overview of the systems is presented
where Pxy (ωk ) is the cross-power spectrum density between in Table II.
signal x and y, with frequency spectrums X(ωk ) and Y (ωk ) The ADC Adscope and Littmann Cardiology II devices were
band ωk , the spectral
respectively. For a given frequency
∗
density evaluated using the diaphragm chestpiece. The ADC Proscope
Pxy was estimated by P̂xy = M X
m=1 m (ω )Y
k m (ω )
k along single-patient use (SPU) device only entailed a diaphragm chest-
m = 1, .., M window frames, where M is determined by du- piece. For these three devices, acquisition of the captured body
ration of window p, as described in Section III-C3. The denomi- sounds was performed using the PCB Piezotronics microphone,
nator in (10) makes the M SC index normalized in [0,1]; notice secured into one side of the earpiece. Both sides of the earpiece
that by definition, MSC is invariant to scalar multiplications were then acoustically sealed via a 3-step process: i) covered
of signals x and y; this renders the metric independent of the with a thick layer of clay ii) wrapped in multiple layers of
volume settings of the individual auscultation systems. acoustic foam, iii) wrapped in cotton cloth. This process ensured
Authorized licensed use limited to: Johns Hopkins University. Downloaded on September 30,2021 at 13:10:00 UTC from IEEE Xplore. Restrictions apply.2590 IEEE JOURNAL OF BIOMEDICAL AND HEALTH INFORMATICS, VOL. 25, NO. 7, JULY 2021
Fig. 5. Sensitivity map of a traditional stethoscope head (left), sensitiv-
ity map of the Thinklabs One electronic stethoscope head (center), and
sensitivity map of the proposed JHUscope smart stethoscope (right) in
decibels as compared to the power at the center position.
recommended for lung sounds was used (filter setting 3-4), and
the volume was set at the middle point.
IV. RESULTS
Fig. 4. Flowchart highlighting the signal analysis methodology for de-
termining the overall quality metric SN Rest . A. Sensing Sensitivity
First, we measure the output power as a function of location.
Fig. 5 shows a surface sensitivity heatmap of the JHUscope
restriction of potential noise leakage through the ends of the versus the ADC acoustic stethoscope and the Thinklabs One
earpiece. It is important to highlight here that such systems for electronic stethoscope, revealing spectral power in decibels rel-
which sound travels through a chestpiece, noise leakage is more ative to the center position. In a traditional stethoscope head,
than likely to occur throughout the full length of the tubing piece. the diaphragm is designed to partially integrate over the surface
It was outside of the scope of this study to attempt to contain all of the head [29]. However, our analysis shows that the acoustic
possible sources of noise leakage, especially those that add to a stethoscope is maximally sensitive at the center of the stetho-
device’s vulnerabilities. scope head, directly under the opening leading to the tubing, and
The EKO Core hybrid electronic/acoustic device was toggled decreases dramatically towards the edges with a loss of almost
to ON, to ensure digital acquisition, and the middle volume 30 dB in dynamic range at the outer edges of the stethoscope
setting was selected while the diaphragm chestpiece was used (Fig. 5-left). Similarly, the Thinklabs One electronic stethoscope
for auscultation. Sound was acquired through the earpiece using exhibits positional relationship to signal power (Fig. 5-center),
the same process as above. Notice here that the device offers possibly due to transducer design. In contrast, the JHUscope in-
an accompanying phone application for digital sound capturing creases the number of pickup positions across the stethoscope’s
and while the Bluetooth indicator was flashing, the device was head with a five microphone array and therefore provides a
not connected to a phone to ensure uniformity in the record- more uniform surface to capture body sounds (Fig. 5-right).
ing process. The current study focused on assessing the audio These results are consistent with previously reported studies
signal reaching the user in real-time, simulating a scenario of that demonstrate that diaphragms have the ability to increase the
real-world auscultation; and thus, additional computer software mean vibrational velocity across the surface but have significant
was not considered here. differences between the velocity values measured at center and
The Littmann 3200 electronic device was set to active mode edge points of those diaphragms [30].
(non-standby mode), the filter option was set to Extended mode, In order to further illustrate these differences and the power
volume set at the middle setting. The Extended Range mode loss at certain positions, Fig. 6 shows an example of the power
amplifies sounds from 20–2000 Hz similar to the Diaphragm spectrum from the JHUscope and the acoustic systems for a
Mode, but provides more low frequency response between 50– position that is distant from the center. In this example, the
500 Hz. Sound was again acquired using the process above. average power spectrum from Position 1 relative to the average
Due to the restricted automatic shut-off feature, the device had power spectrum from the center position, Position 5, was chosen
to be set into active mode regularly throughout the duration of to illustrate the spatial dependencies of the sensitivity. For this
the experiments. This device also comes with an accompanying position, the JHUscope preserves signal power relative to the
computer software for digital sound acquisition which was also center and across the frequencies of interest while the ADC
forgone to ensure uniformity in the recording process and a more Adscope shows a significant decrease in power—down to 20 dB
realistic use-case. less—and high variability across the spectrum.
Thinklabs One electronic device offers a standard 3.5 mm au- Second, we further evaluate whether the full spectra of the
dio jack output where the user connects headphones, providing output and input signals are statistically different (p < 0.05)
the capability of directly recording the transmitted sound via an across pickup positions. An ANOVA parametric analysis reveals
audio cable connected to the recording system. The filter option
Authorized licensed use limited to: Johns Hopkins University. Downloaded on September 30,2021 at 13:10:00 UTC from IEEE Xplore. Restrictions apply.MCLANE et al.: DESIGN AND COMPARATIVE PERFORMANCE OF A ROBUST LUNG AUSCULTATION SYSTEM FOR NOISY CLINICAL SETTINGS 2591
Fig. 6. Example of spectral power differences between the JHUscope
and ADC Adscope, illustrated by the spectral power from Position 9
relative to the center position, Position 5. The spectral power ratio is
presented in decibels (dB), with 0 dB representing equal power of
recordings from both positions. Fig. 7. Illustration of the sound-preservation ability of different auscul-
tation systems, with varying simulated noise levels. The true SNR is
depicted on the x-axis and the estimated SNR is plotted on the y-axis.
Main panel (a) depicts results for calculated metric SN Rest ; panel (b)
that the recorded and true signal for the JHUscope are found depicts the SN Rlungsound metric, and panel (c) the SN Rnoise metric.
In panels (a–b) high values correspond to high quality of the pick-up
to be statistically equivalent across positions (p = 0.1204, F signal; in panel (c) high values correspond to maximal noise leakage.
= 1.67) but are statistically different for the both the ADC
Adscope (p = 0.0242, F = 7.14)and the Thinklabs One (p =
3.8053E − 27, F = 27.53) across positions.
ambient noise leakage than preserving the real signature of
Several publications have studied the distribution of sounds
the breath sounds (e.g., electronic device Thinklabs One, in
of the chest wall, demonstrating the presence of sounds across
cyan). Moreover, it is clear that acoustic stethoscopes perform
large areas, with minor amplitude differences (± 3 dB) based on
well in low noise conditions but cannot provide sufficient noise
the placement of the sensor [31], [32]. One of the key advantages
suppression capabilities in noisy settings (Fig. 7(c)). In contrast,
of this sensing array design is that the JHUscope does not require
electronic stethoscopes provide advanced filtering to suppress
precise placement on the body to achieve the maximum ampli-
ambient noise (low SN Rnoise values) but such filtering can also
tude, as it is uniformly sensitive across the head of the device,
affect the underlying signature of the reference breath sounds
thereby allowing for increased sound and information pickup for
(Thinklabs One in cyan, Littmann 3200 in blue and EKO Core
effective use by health-care workers with minimal training. In
in yellow). The proposed JHUscope device shows a balance
the cases with highly trained personnel requiring more localized
between noise suppression of the background and signal fidelity
sensitivity, the programmable aspect of the JHUscope enables
with the reference sound for an overall improved SN Rest .
selective toggling of the microphones, the comparison of which
In order to further illustrate this point, Fig. 8 shows the
is shown in Fig. 1 of the Supplementary Material.
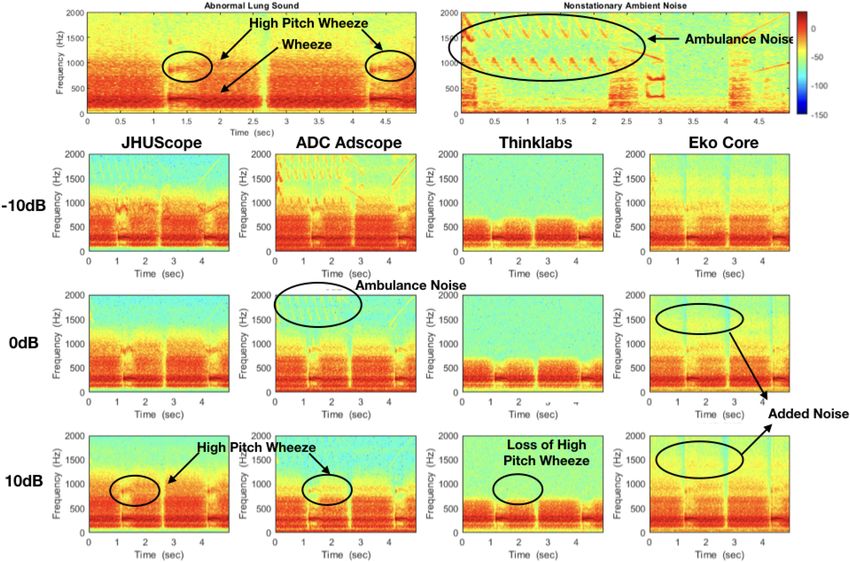
spectrogams of a reference signal containing an abnormal lung
sound (wheezing) and a simulated nonstationary ambient noise
B. Signal Fidelity and Noise Robustness
(ambulance noise). These spectrograms are compared to the
Fig. 7(a) depicts estimated SNR values for each of the tested spectrograms of recordings from four devices (JHUscope, ADC
stethoscopes as a function of the true SNR (averaged across Adscope, Thinklabs One, and Eko Core) at three noise levels
all trials, lung sounds and noise signals). High values of the (SNR −10 dB, 0 dB, and 10 dB). The spectrograms clearly
SN Rest metric represent increased signal fidelity with the illustrate that some devices are better at signal preservation
reference signal and reduced noise leakage, while low values while other devices are better at noise cancellation. The ADC
reflect decreased signal quality and increased noise contamina- Adscope shows a better preservation of the wheezing across
tion. The overall metric SN Rest shown in Fig. 7(a) shows that all three noise levels (high SN Rlungsound ), but also a high
the JHUscope far surpasses the other devices for all simulated level of noise contamination from the ambulance sounds (high
conditions. Figs. 7(b), (c) show the breakdown achieved by the SN Rnoise ). The Thinklabs One shows a very high level of
SN Rlungsound and SN Rnoise metrics alone, respectively. noise suppression of the ambulance sounds (low SN Rnoise ),
As depicted in Fig. 7, it is clear that some devices perform but at the expense of a substantial amount of the frequency
well in quiet conditions, while others are built to withstand content of the lung sounds, removing the high pitch wheezes
noisy environments where it may be more important to suppress entirely (low SN Rlungsound ). The Eko Core shows a a high
Authorized licensed use limited to: Johns Hopkins University. Downloaded on September 30,2021 at 13:10:00 UTC from IEEE Xplore. Restrictions apply.2592 IEEE JOURNAL OF BIOMEDICAL AND HEALTH INFORMATICS, VOL. 25, NO. 7, JULY 2021
Fig. 8. Example of recordings from four different auscultation systems (JHUscope, ADC Adscope, Thinklabs One, and Eko Core) at three
simulated noise levels, to highlight the issues summarized in Fig. 7. Panel (a) represents the spectrogam of the reference recording of breaths
with expiratory wheezing, an abnormal lung sound signal. Panel (b) represents the simulated ambient noise spectrogram of nonstationary, transient
sounds (ambulance noises). Panels (c)–(e) show the pick-up signal for the three devices for SNRs −10 dB, 0db, and 10 dB, respectively. The
recordings from each device can be compared to the reference spectrograms to illustrate the SN Rlungsound and SN Rnoise metrics.
level of noise suppression (low SN Rnoise ), but adds noise in of the very low and very high frequencies [33]. The narrow
higher frequency bands, resulting in a low SN Rlungsound . The tubing and earpiece components are another source of sound
proposed JHUscope preserves the power of the abnormal lung alteration [34], [35]: sounds propagating through narrow long
sounds in all three scenarios (high SN Rlungsounds ) while also tubes have specific resonant frequencies and a decreased re-
being able to suppress the ambulance sounds (low SN Rnoise ). sponse to high frequency content. In addition to sound alteration,
the chestpiece and tubing may further incur ambient noise
leakage, especially in noisy environments. This can result in
V. DISCUSSION a contaminated propagating sound that drifts further away from
Three main points should be taken into consideration with the actual body sounds. Electronic system also have various
the current study. First, we note that there is expected to be sources of sound alteration. Electronic stethoscopes typically
variability across system performances that is driven by a variety utilize various types of electroacoustic contact transducers that
of factors including product design and the physical device, will influence the sensitivity and sound characteristic of the
system architecture and inherent signal processing, and signal pickup signal in a different manner than a diaphragm of an acous-
acquisition layout. The quality performance results presented in tic stethoscope [36]. Digital filters in electronic systems that
this work are based on the standalone capabilities of the included are geared towards lung sound auscultation typically suppress
devices, and do not include supplementary computer programs frequencies below 300 Hz and above 800–1000 Hz, and although
or phone applications in the analysis. these are deliberate design choices for attenuating external noise
Some well-known sources of sound alteration are the chest and promoting specific signal frequencies, they may also further
piece design and the attached tubing typically found in acoustic contribute to a decreased signal fidelity in certain electronic
stethoscopes and some electronic devices (e.g., ADC Adcope, stethoscopes.
Littmann Cardiology II, EKO Core, Littmann 3200), as well as Second, the performance curves should not be interpreted as
digital filters in electronic systems. The diaphragm of acoustic an absolute ranking of the various auscultation systems. Instead,
and electronic stethoscopes, by design, is meant to cut off some they provide an insight into the variability of each individual
Authorized licensed use limited to: Johns Hopkins University. Downloaded on September 30,2021 at 13:10:00 UTC from IEEE Xplore. Restrictions apply.MCLANE et al.: DESIGN AND COMPARATIVE PERFORMANCE OF A ROBUST LUNG AUSCULTATION SYSTEM FOR NOISY CLINICAL SETTINGS 2593
system when the level and type of the ambient noise varies. Note dynamic noise suppression design, and programmability to
that a system’s output can be sensitive to the amount of pressure tackle known shortcomings. Noise leakage and sound alteration
used when placed on the body or on top of the chest simulator. effects are evident among all compared systems. Although high
High pressure allows for better contact with the chest simulator noise suppression is generally desirable, it can incur signif-
and less ambient noise leakage via the chest piece. In our setup, icant sound alteration to the auscultated sounds. A balanced
the use of clamps to secure the chest piece of each device ensured solution is thus desirable which maintains the full spectrum
minimal setup variability; however, due to the different shapes of the sound while minimizing noise. Our experiments have
and sizes of the auscultation devices full elimination of pressure shown that the JHUscope delivers sound signals faithful to the
variability could not be guaranteed in a straightforward manner. reference body sounds, achieving increased pick-up sensitivity
In addition, there is a great deal of variability in setting choices and decreased noise leakage. The proposed system is proven to
including volume of each system. Although steps were taken to be a robust, powerful and versatile tool that can be used reliably
prevent such variability such as using the middle volume setting in challenging and noisy environments. This system can bring
for all electronic devices and choosing performance metrics to value to the clinicians in their traditional auscultation process,
be invariable to scalar multiplications of the signals, one could but can also add value to computer-aided auscultation systems
argue that the volume setting might still affect the end result: a (CAAS) that would benefit from a broader and more accurate
high volume setting might allow for less relative noise leakage representation of body sounds. Most CAAS approaches have
that can contaminate the pick-up signal or it could be the case mainly been validated in well-controlled or quiet clinical settings
that some systems process incoming sounds in a different way on adult subjects; there is yet to have a true impact on health-care
dependent on the input volume level. practices in various clinical settings [38]–[41].
Lastly, the objective metrics in this study reflect the systems’ Since lung auscultation remains an important component of
ability to preserve the reference emanating body sounds, but respiratory infection diagnosis with more predictive accuracy
should not be used to reflect an expert’s ability to form a diag- than an initial clinical assessment alone [5], a device that can
nostic opinion using these systems without further exploration. provide clinical workers with markedly improved signal quality
The present study compares the auscultated signals against the may be critical for increasing the accuracy of clinical diagnosis
true breath sounds driving the chest simulator through a metric of respiratory infections. Better still, the programmability of the
that quantifies the fidelity of the information contained in the JHUscope can enable deployment of real-time CAAS for clinical
auscultation signal rather than other metrics such as amplifi- decision support: previously-evaluated CAAS algorithms that
cation. Indirect measures that focus on sound quality rather can subsequently be introduced on this hardware device [42],
than fidelity can obscure any filtering, attenuation, or distortions [43] would be able to be deployed to both traditional and
applied by the stethoscope to abnormal body sound events. A non-traditional clinical settings and support the diagnosis of
direct correlation to the end-user’s ability to diagnose a body respiratory conditions, bringing patients closer to successful
condition based on the delivered sounds would require further treatments in resource-limited settings.
evaluation with expert listener panels and would depend on the
nature of the body sounds of interest. Competing Interests: The authors declare the existence of a
In future investigations, the real-time noise suppression algo- financial competing interest. Under a license agreement between
rithm should be validated against other noise reduction method- Sonavi Labs and the Johns Hopkins University, I.M. and the Uni-
ologies in a similar manner to further characterize and under- versity are entitled to royalty distributions related to technology
stand the limitations of the current methodology, such as the used in the study discussed in this publication. Additionally, the
use of the Short-time Fourier Transform. We should also do University owns equity in Sonavi Labs. I.M. is a founder of and
a full comparison of the cost, processing power, battery life, holds equity in Sonavi Labs and serves as the company’s Chief
and programmability against other available devices. To fully Technology Officer and a member of its Board of Directors. This
validate the signal quality of the device, we would also need arrangement has been reviewed and approved by Johns Hopkins
to consider real-life conditions. Although a preliminary study University in accordance with its conflict of interest policies.
has been conducted of a pairwise comparison of the JHUscope
and the Thinklabs One in a small pediatric population [37], REFERENCES
the JHUscope needs to be tested on a more extensive sets of
[1] T. Ferkol and D. Schraufnagel, “The global burden of respiratory disease,”
normal and abnormal lung sounds, a larger patient population Ann. Amer. Thoracic Soc., vol. 11, no. 3, pp. 404–406, 2014.
with various conditions, and in various real-life environmental [2] A. Sakula, “R t h laënnec 1781–1826 his life and work: A bicentenary
noise conditions. The system’s validation would also benefit appreciation.” Thorax, vol. 36, no. 2, pp. 81–90, 1981.
[3] J. S. Russotti, R. P. Jackman, T. P. Santoro, and D. D. White, “Noise
from evaluations for use with other body sounds, such as heart, reduction stethoscope for united states navy application,” Nav. Submarine
bowel, and joint sounds. Res. Lab, Groton, CT, Tech. Rep. 1214, 2000.
[4] World Health Organization, Revised WHO classification and treatment of
childhood pneumonia at health facilities. Geneva, Switzerland, 2014.
[5] F. Pervaiz et al., “Building a prediction model for radiographically con-
VI. CONCLUSION firmed pneumonia in peruvian children: From symptoms to imaging,”
This work describes a new digital stethoscope that brings Chest, vol. 154, no. 6, pp. 1385–1394, 2018.
[6] G. Nelson, “Stethoscope design for auscultation in high noise environ-
solutions to old and recurring problems of auscultation tools ments,” Ph.D. dissertation, Univ. Minnesota, Minneapolis, MN, USA,
by equipping the system with an advanced sensing mechanism, 2015.
Authorized licensed use limited to: Johns Hopkins University. Downloaded on September 30,2021 at 13:10:00 UTC from IEEE Xplore. Restrictions apply.You can also read