The SHL Verify Range of Ability Tests - Technical Manual - hrmforce
←
→
Page content transcription
If your browser does not render page correctly, please read the page content below
The SHL Verify™ Range of Ability Tests
                                                > Technical Manual

Version 2.0 Oct 2007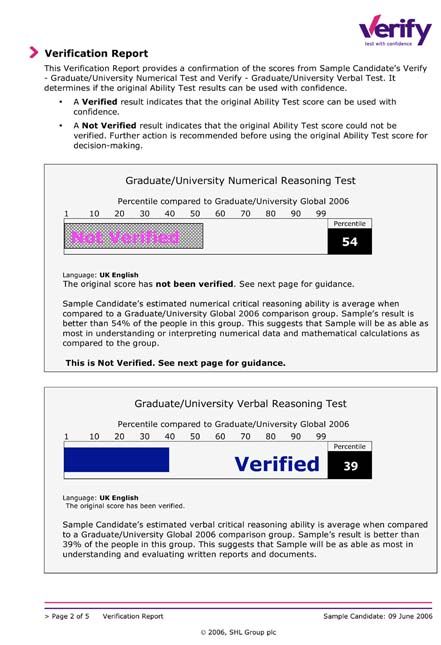
The SHL Verify™ Range of Ability Tests
                                                     > Technical Manual

                                           Eugene Burke, Gerianne van Someren,
                                                  Nicola Tatham & Kate Downey

                                                    © SHL Group Limited, 2007

                                                                   The Pavilion
                                                                 1 Atwell Place
                                                                Thames Ditton
                                                                        Surrey
                                                                      KT7 0NE
                                                               United Kingdom

Version 2.0 Oct 2007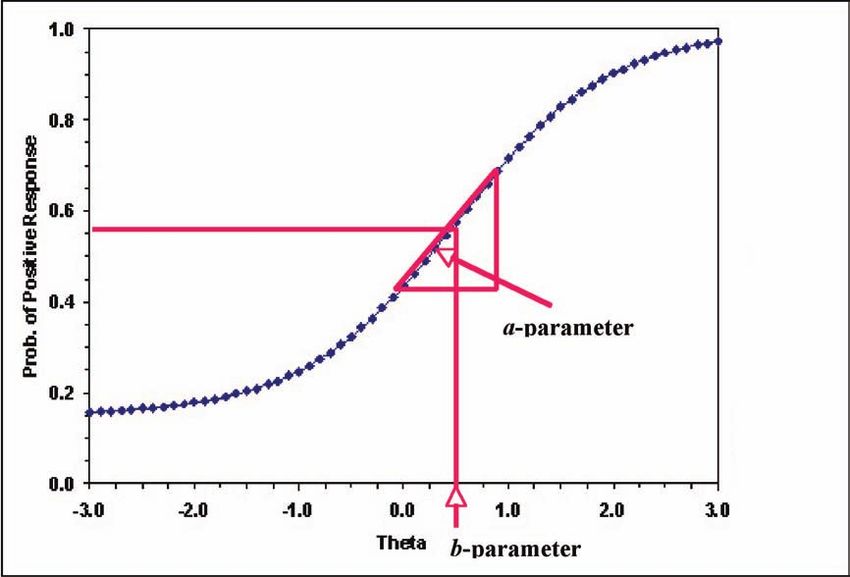
Contents

     Acknowledgements											                                                                             >3
     Introduction												                                                                                >4
      The issue of cheating, piracy and Internet testing								                                             >4
      What is the SHL Verify solution to online ability testing?							                                      >4
      What is the SHL Verify Range of Ability Tests?								                                                 >5
      What does the Verify Range measure?									                                                           >5
      Test Overview												                                                                              >5
      What is verification?											                                                                       >6
     Suitability of the SHL Verify Range for use in assessment							                                        >6
      How do I access the results from SHL Verify Ability Tests?							                                      >7
      What will I find in the rest of this manual?									                                                  >8
     The development of the SHL Verify item bank								                                                     >9
      Key concepts in IRT											                                                                         >9
      Applying IRT to the construction of SHL Verify item banks							                                       > 12
     The psychometric properties of scores obtained from the SHL Verify Range of Ability Tests			            > 13
      Randomised online ability testing										                                                            > 13
      Scoring of SHL Verify Ability Tests									                                                           > 13
      Accuracy and consistency of SHL Verify Ability Test scores							                                      > 14
      Scales for reporting ability test scores									                                                      > 16
     How psychometric verification preserves the validity of the SHL Verify Ability Test scores				          > 17
      The SHL Verify process of psychometric verification							                                             > 17
      Dealing with scores flagged as not verified									                                                   > 18
      How effective is the SHL Verify testing process in detecting cheats?						                             > 19
     Technical details of the verbal and numerical Verify tests by general level					                        > 25
      Verbal Test typifying the management and graduate levels							                                        > 25
      Verbal Test typifying the supervisor and operational levels							                                     > 25
      Numerical Test typifying the managemnet and graduate levels						                                      > 26
      Numerical Test typifying the supervisor and operational levels						                                   > 26
     Reliability of the Verbal and Numerical Test scores by level							                                     > 27
     Reliability of the Verbal and Numerical verification test scores and their relationships to Verify			   > 27
     Abiltiy Test scores
     Criterion validity of the Verbal and Numerical Test scores							                                       > 28
     Sample and analyses used for defining the Verbal and Numerical comparison groups				                    > 32
     Comparisons of the Verbal and Numerical Test scores by sex, ethnicity and age					                      > 35
     Technical details of the inductive reasoning test by general level						                                > 36
      Inductive Reasoning Tests typifying the management and graduate levels					                            > 36
      Reliability of the Inductive Reasoning Verification Test scores and their relationships to Verify			   > 36
      Ability Test scores
      Relationship between SHL Verify Inductive Reasoning and other measures					                            > 37
      Sample and analyses used for defining the Inductive Reasoning comparison groups				                    > 38
      Comparisons of the Inductive Reasoning Test scores by sex, ethnicity and age					                      > 38
     Where can I find out more information on SHL Verify?							                                             > 40
     References												                                                                                  > 41

>2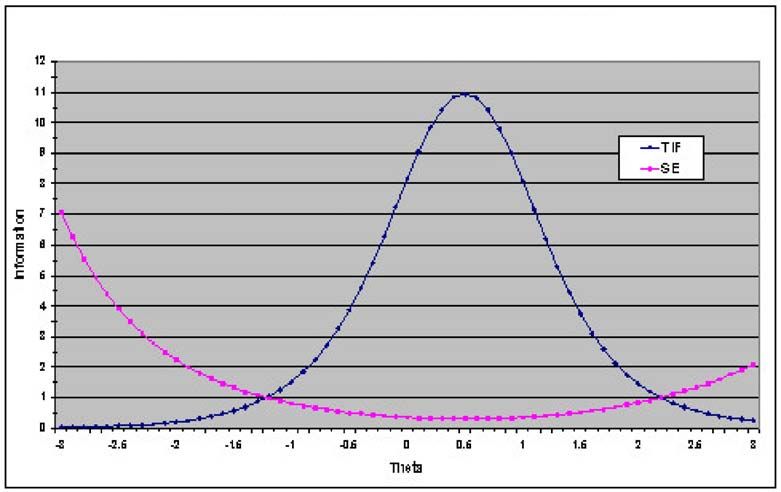
Acknowledgements

Many people were involved in the development of the SHL Verify Range of Ability Tests. We would like to thank
all the staff in the SHL Science & Innovation team whose dedication and hard work from November 2003 on
the psychometric programmes now supporting SHL’s test development processes made the SHL Verify Range
of Ability Tests possible.

As with any major product development programme, its success depends on a team effort. Space prohibits
mention of all of those involved in the programme, but your hard work and long hours have realised what we
believe to be an innovation in employment testing that will realise significant benefits for organisations and
candidates in delivering a better fit of people to the world of work.

                                                               The SHL Verify Range of Ability Tests - Technical Manual   >3
Introduction

     This manual describes the development of the SHL Verify Range of Ability Tests that form a key part of the
     SHL Verify solution to unsupervised online testing. This manual provides key details of the psychometric
     properties of these tests as well as the methods used and the logic behind the SHL Verify Range. It is one
     of several documents supporting the use of the SHL Verify Range that also include the associated User
     Manual, the Better Practice for Unsupervised Testing white paper and the Better Practice Guide for
     Unsupervised Online Assessment, which sets out the philosophy behind the SHL Verify solution, and the key
     steps that users should follow to secure the validity of ability tests administered online.

     This introduction covers an overview of the SHL Verify solution and the key features of the SHL Verify Range
     including the range of tests and comparison groups as well as the reports provided through the SHL Verify
     Range.

     The issue of cheating, piracy and Internet testing

     As evidenced in the debate described in the paper by Tippins, Beaty, Drasgow, Gibson, Pearlman, Segall and
     Shepherd (2006), the biggest concerns with unsupervised Internet testing are with cheating and the actions
     of content pirates to support cheating. Cheating represents a conscious
     effort to achieve an inflated score on an assessment and, thereby, to                  M\i`]p
                                                                                             @k\d
     improve the chances of successfully achieving an objective such as                     9Xeb
                                                                               JZ`\ek`]`Z
     a job offer (Cizek, 1999). On ability tests, it represents a false score    i`^fi
                                                                                                    K\Z_efcf^p

     on the test that is significantly higher than the person’s true ability.
     Cheating is inherently unfair in reducing the opportunities of those     M\i`]`ZXk`fe
                                                                                gifZ\jj
                                                                                                    ;XkXj\Zli`kp
                                                                                                     ]fi\ej`Z
     candidates who have taken the assessment honestly and whose                                      j\im`Z\j

     scores are above the score cut-off(s) used for decision making but                    =c\o`Yc\
                                                                                           k\jk`e^
     below those obtained by cheats.                                                       fgk`fej

     Organisations are moving increasingly to the Internet for
     administration of tests, and this raises the issue of potential cheating
     where such tests are not supervised by an administrator who is
     physically present.

     What is the SHL Verify solution to online ability testing?
                                                                                     Manage the security of your
     A key part of the solution offered by SHL Verify is the use of                        assessments
     unsupervised but cheat-resistant tests from which an accurate
     score can be obtained, and which are followed up by psychometric
     verification tests that are used to validate the first score.
                                                                                  Use cheat-resistant assessments
     The SHL Verify solution brings these components together in a
     systematic series of steps for better practice in online assessment
     (see Burke, 2006, for more details).

     The key steps proposed by SHL’s better practice are summarised             Build verification procedures into your
     on the right. A key step is the use of cheat- resistant assessments,                assessment process
     and the SHL Verify Ability Tests have been designed to meet that
     requirement.

     Another key step is the use of verification to provide checks on                 Establish and communicate
                                                                                      a clear assessment contract
     the validity of candidates’ scores. The SHL Verify Verification Tests                 with the candidate
     have been designed to serve this purpose.

>4      The SHL Verify Range of Ability Tests - Technical Manual
What is the SHL Verify Range of Ability Tests?

The SHL Verify Range of Ability Tests comprises reasoning tests designed for administration online and to be
resistant to cheating and piracy of content. SHL Verify consists of two stages:

1. The SHL Verify Ability Test (VAT) is intended for administration online and unsupervised. These tests are
   drawn from an item bank that provides different but equivalent tests administered randomly to candidates.
   This feature has been designed to minimise the ability of candidates to access answers to tests, and to
   reduce the ability of candidates to collude through the exchange of answers to items.

2. The SHL Verify Verification Test (VVT) is a short test that has been designed to offer an equivalent
   and supervised follow-up assessment to the VAT. This test checks the consistency of scores from the first
   unsupervised online test and flags inconsistent scores for follow up.

   Stage 1                                                    Stage 2
   Verify Ability Test                                       Verification Test
   Accurate Verbal / Numerical /                             Verifies candidate performance on
   Inductive reasoning test designed                         the Verify Ability Test
   to be administered online and
                                                             Verification Report output - no
   unsupervised
                                                             additional score, just a simple
   Ability Report output provides the                        Verified / Not Verified classification
   score that is then verified through
   the Verification Test

What does the Verify Range Measure?

The Verify Range of Ability Tests currently comprises 3 individual measures of reasoning; Verbal, Numerical
and Inductive Reasoning. The 3 tests can be administered either separately or in any combination driven by
the requirements for an assessment.

Both the Verbal and Numerical tests are examples of deductive reasoning measures. Broadly speaking, this
is the ability to work with problems that are bounded and where methods or rules to reach a solution have
been previously established. Inductive reasoning extends the range of assessments available from the Verify
range to include the ability to work with problems that are novel and that require individuals to work from first
principles in order to reach a solution.

Test Overview

                              Verify Ability Test                       Verification Test
                                   30 items                                 18 items
Verbal
                                17-19 minutes*                             11 minutes
                                   18 items                                 10 items
Numerical
                                17-25 minutes*                          14-15 minutes*
                                   24 items                                 7 items
Inductive
                                 25 minutes                                7 minutes

* Verify offers tests at different job levels and the time for Verify tests varies depending on the level of the
test used.

                                                                 The SHL Verify Range of Ability Tests - Technical Manual   >5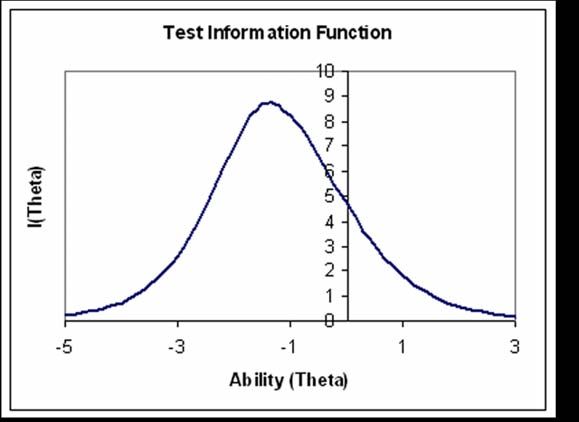
What is Verification?

     Verification procedures are checks on the consistency of scores using verification tests and other information
     that support or question the validity of a candidate’s test score(s). Background checks are used by many
     organisations to check the validity of résumés and CVs, and verification procedures follow similar principles in
     looking at several sources of data related to a test score to check its validity.

     Verification is distinct from authentication, which is concerned with confirming the identity of the candidate.
     We recommend that all assessment processes specify and include one or more stages at which the candidate’s
     identity is authenticated. Verification procedures are concerned with validating a candidate’s score on an
     assessment. These include:

     • The use of psychometric verifications such as the SHL Verify Verification Tests, which provide strong
       checks on the validity of scores by using equivalent content contained in short but accurate assessments.
     • The use of other assessments to check the candidate’s potential and fit to the role or job. Information
       from a reasoning test, a personality measure, assessment centre exercise and a well-structured interview
       can be used to contribute to an overall assessment of potential and fit. Assessments such as ability and
       personality measures administered unsupervised online would provide data on whether the candidate
       should be called forward for a second-stage assessment and, if they should, what areas need to be probed
       in more depth before an appointment decision can be made. Cross-referencing information from several
       assessments to focus on areas of inconsistency is another form of verification.
     • The use of other verifiable information related to the assessment being verified. For example, if
       the assessment is measuring numerical reasoning, then information on the candidate’s educational
       performance related to numerate subjects would be relevant and could be verified.

     Suitability of the SHL Verify Range for use in assessment

     Cognitive or reasoning ability has been shown by                         UCF DIMENSION
     a wide body of research to be the most consistent
     predictor of job performance (Schmidt and                     Presenting & Communicating Information
     Hunter, 1998). The SHL Verify Range is relevant                         Writing & Reporting
     to assessment where the following are critical
                                                                      Applying Expertise & Technology
     aspects of the job or role (these requirements
     are taken from the SHL Universal Competency                                 Analysing
     Framework or UCF and further details on the UCF                       Learning & Researching
     and its validity are available in Bartram, 2005):
                                                                            Creating & Innovating
     The Verify Ability Tests have been designed to                   Formulating Strategies & Concepts
     operate at six levels from manager and graduate
     through to supervisory and operational roles.

     The Verify Ability Tests have been developed to provide equivalent quality and levels of assessment to
     SHL’s Advanced Managerial Tests (AMT), the Management and Graduate Item Bank (MGIB), the Critical
     Reasoning Test Battery (CRTB), the Customer Contact Ability Series (CCAS) and the verbal and numerical
     reasoning tests contained in the Personnel Test Battery (PTB).

     Tailoring of the tests to meet user requirements has also been facilitated by the availability of Comparison
     Groups (norms) covering four industry sectors plus a general composite at each of the job levels. In total, the
     SHL Verify Range offers 70 comparison groups (test types by job levels by industry sectors) to support the
     valid interpretation of scores. These are summarised in the table overleaf. Please note that work is ongoing to
     update the range of comparison groups available through Verify and we will provide updates as the range of
     comparison groups is extended.

>6      The SHL Verify Range of Ability Tests - Technical Manual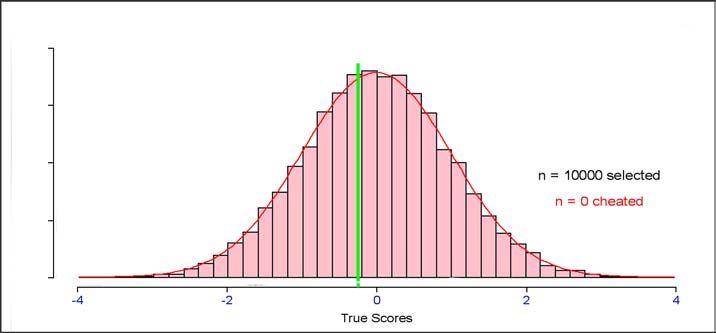
Job Level Verbal Numerical Inductive
Manager / Professional ✓ ✓ ✓
Graduate ✓ ✓ ✓
Junior Manager ✓ ✓
Senior Customer Contact ✓ ✓
Junior Customer Contact ✓ ✓
Administrator ✓ ✓
How do I access the results from SHL Ability Tests?
The SHL Verify Range provides two types of report for users:
1. The Verify Ability Test Report which is a computer-generated report providing a candidate’s score on the
VAT using the comparison group selected by the user. The user has the choice of using only one, two or all
three tests currently available. The VAT report caters for each of these three choices. An example of a VAT
report generated for a candidate who has completed a verbal and a numerical test is shown below:
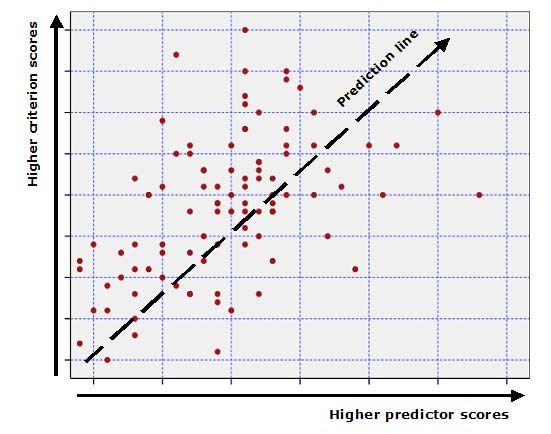
The SHL Verify Range of Ability Tests - Technical Manual >72. The Verification Report is a computer-generated report that provides the results of the psychometric
verification following the administration of a VVT. This is the report that indicates whether the candidate’s
scores from the VAT are consistent and are likely to be a valid indicator of the candidate’s ability, or
whether the candidate’s score is aberrant and, therefore, the validity of the VAT score is questionable and
should be verified further. An example of this report generated for a candidate who has completed a verbal
and a numerical test is shown below:
What will I find in the rest of this manual?
The remaining sections of this manual provide the reader with the following information:
• The development of the item banks that support the SHL Verify Range
• The psychometric properties of the SHL Verify Ability Tests and Verify Verification Tests
• Descriptions of the comparison groups used to interpret SHL Verify Ability Test Scores
• The criterion validity of the Verification Ability Test scores
• How psychometric verification preserves the validity of the Verify Ability Test scores
• Comparisons of Verify Ability Test scores by sex, ethnicity and age
>8 The SHL Verify Range of Ability Tests - Technical ManualThe development of the SHL Verify item bank
In contrast to traditional ability tests, the SHL Verify Range uses an item bank to construct tests on demand
for candidates. The SHL Verify item bank is a database that contains individual items and their psychometric
properties. Using Item Response Theory (IRT) as explained in more detail below, tests are constructed using
a series of rules such as length (number of items), total test time and the accuracy required of the test. This
enables different but equivalent tests to be randomly assigned to candidates thereby managing cheating and
piracy. This section explains the key principles and methods used to develop the SHL Verify item banks.
Key concepts in IRT
Traditional methods of constructing tests known as Classical Test Theory or CTT suffer from a number of
limitations, amongst the most significant of which are:
• That the estimates of the psychometric properties of an item are fixed in relation to other items in the test.
• That the estimates of item properties are fixed in relation to the samples of people from whom
psychometric data were gathered.
As such, data gathered from CTT limits the development of item banking and the use of randomised testing.
IRT, in contrast, does not suffer from these limitations as estimates of the properties of items are independent
of other items used in a trial form or an operational test. Furthermore, properties of items estimated through
IRT are also independent of the samples from which item data are gathered. A third property of IRT models
relevant to randomised testing is that the estimate of a candidate’s ability or theta score, θ, is independent of
any particular set of items used to estimate it.
These advantages of IRT do come with the key caveats that the samples used to estimate item and test
properties are sufficiently large to provide accurate estimates, that those samples are not substantially biased
in some systematic way, and that trial and operational forms of tests contain sufficient good quality items to
enable an accurate estimate of a person’s theta to be obtained (see Hambleton, Swaminathan and Roger, 1991,
for an introduction and more detailed explanation of these features of IRT models). The next page provides
a summary and comparison of the key parameters used in both CTT and IRT to describe the psychometric
properties of items and tests.
IRT models vary in the assumptions they make about an item and what it measures. As described in the
next table, IRT models include four key parameters: the theta or θ metric that describes the level of ability
and difficulty of items; the a-parameter that describes how well an item discriminates between lower and
higher abilities; the b-parameter that describes the level of ability at which the item provides maximum
discrimination; the c-parameter that describes the extent to which the item is subject to guessing the correct
answer.
The SHL Verify Range of Ability Tests - Technical Manual >9CTT Parameter Analogous IRT Parameter
Item difficulty (or facility) index or p = the proportion The b-parameter = the point on the ability or theta
of a sample who answer questions correctly where scale, θ, where the probability of getting an item
1-p is the proportion answering incorrectly correct is 50%
Item discrimination or item partial = the correlation The a-parameter = the slope of the item
between getting the item correct and the total score characteristic curve at the b-parameter for the item
on all other items
Correction for guessing as applied to number correct The c-parameter = the effect of getting the item
score and based on 1/n where n is the number of correct through guessing
response alternatives
Number correct score = an estimate of ability taken Theta or θ = the score obtained for a person based
from CTT based tests on the responses to items and the item parameters
Reliability = an index ranging from -1 through zero Information Function I(θ) = a scale indicating the
to +1 indicating the extent to which items in a test information value for an item at specific values of θ
or scale are functioning in a consistent way in
estimating a trait Test Information Function (TIF) = the sum of
information functions across items at key points of a
θ range showing where estimates of θ are likely to be
accurate and where those estimates are subject to
greater error of measurement
Standard Error of Measurement (SEM) = an index of Standard Error (θ) = the error associated with the
the range of number correct or transformed score point on the θ scale at which an ability or trait score
points within which a person’s true score is estimated is estimated for an individual
to lie
The following represent the three most widely used IRT models:
• 1-parameter or Rasch models assume that all items are equally discriminating or have equivalent
a-parameters, but items are assumed to vary in terms of difficulty or the b-parameter. The major
assumption here is that all items are equivalent in their representation of the construct or trait being
measured.
• 2-parameter models assume that items vary not only in terms of difficulty (or the b-parameter) but also in
terms of discrimination (the a-parameter).
• 3-parameter models assume that items vary in terms of the a and b-parameters, and also in a third
parameter, c, which represents the likelihood of guessing the answer correctly on an item.
> 10 The SHL Verify Range of Ability Tests - Technical ManualThe properties of an item are described in IRT through Item Characteristic Curves or ICCs. These describe
where on the ability metric or theta an item is located in terms of difficulty (the b-parameter) and over what
range of ability the item discriminates (the a-parameter). An example of a 2-parameter ICC for an item is
shown in the figure below.
a-parameter
a = 0.8
b = 0.5
b-parameter
The expected probability of answering an item correctly (Prob. of Positive Response) is shown as the Y-axis,
while the X-axis represents the theta, θ, scale or the level of ability. The function plotted in blue is the ICC
for this item showing how the probability of a correct answer varies by level of ability or θ. The difficulty or
b-parameter for this item lies at about a theta of 0.5 and is the point on the theta scale that corresponds with
the expected probability of a correct answer being 50%. The a-parameter is obtained by determining the
slope of the ICC at this point.
The SHL Verify Range of Ability Tests - Technical Manual > 11Applying IRT to the construction of SHL Verify item banks
The fit of 1, 2 and 3-parameter models to SHL Verify ability items were tested early in the SHL Verify
programme with a sample of almost 9,000 candidates. As expected, the fit of a 1 parameter model to items
was poor, but the expected gain from moving from a 2 to a 3-parameter model was not found to be substantial,
and for the majority of items evaluated (approaching 90%) no gain was found from moving to a 3-parameter
model. Accordingly, a 2-parameter model was selected and used for the calibration of verbal and numerical
item banks as generated for the SHL Verify Range.
The item development programme supporting the SHL Verify Range of Ability Tests extended over 36 months
during which items were trialled using a linked item design and with a total of 16,132 participants. Demographic
details of the sample used to evaluate and calibrate SHL Verify items are provided in the sections in this
manual that describe the SHL Verify comparison groups and the relationships between SHL Verify Ability Test
scores and sex, ethnicity and age.
Items were screened for acceptance into the item bank using the following procedure:
• A sensitivity review by an independent group of SHL consultants experienced in equal opportunities was
used to identify and screen out items that might be inappropriate or give offence to a minority group. This
was conducted prior to item trials.
• Once trial data was obtained, a-parameters were reviewed with items exhibiting low a-parameters being
rejected.
• Review of b-parameters with items exhibiting extreme values (substantially less than -3 or greater than +3)
being rejected.
• Review of item response times (time to complete the item) with items exhibiting large response times (e.g. 2
minutes) being rejected.
• Item distractors (alternate and incorrect answer options presented with the item) were also reviewed with
items being rejected where distractors correlated positively with item-total scores (i.e. indicators of multiple
correct answers to the item) or where the responses across distractors were uneven (the latter analysis
being conditional on the difficulty of the item).
Items surviving the above procedure were subjected to a final review in terms of a and b-parameters as well
as content and context coverage (i.e. that the item bank gave a reasonable coverage across different work
settings and job types). This final review also sought to provide a balance across the different response
options for different item types. That is, the spread of correct answers for verbal items avoided, say, the
answer A dominating over B and C correct answers across items in the SHL Verify item bank, and that the
spread of correct answers was approximately even for A, B, C, D and E options across numerical and Inductive
Reasoning items.
> 12 The SHL Verify Range of Ability Tests - Technical ManualThe psychometric properties of scores obtained from the
SHL Verify Range of Ability Tests
This section provides details of the accuracy of the Verify Ability scores. The operational length of any
test, and therefore its accuracy, is principally defined by two factors: the quality of the items and the time
considered practical for administration of a test.
In recent years, SHL has pursued a programme to improve the quality of items in a focused effort to reduce
the time required for test administration while still obtaining an accurate estimate of a candidate’s ability.
Reducing the length of a test also provides significant benefits when using randomised tests by minimising the
exposure of items contained in the item bank
Randomised online ability testing
A key innovation enabled by IRT models is that a candidate’s ability can be estimated using different
combinations of items. This is dependent on the items measuring the same construct and being calibrated
on a common scale. The scale used to calibrate items and to provide ability estimates is the theta (or θ) scale
which is explained in more detail below.
SHL Verify uses the advantages offered by IRT to provide a cheat resistant method of administering ability
tests online and unsupervised. Given that a candidate’s ability can be estimated using different combinations
of items from a calibrated item bank, when different candidates register for a Verify Ability Test they receive
a different but equivalent test. As such, the opportunity for candidates to collude by exchanging answers is
minimised, as is the opportunity to access and memorise the answers to items given the size of the SHL Verify
item bank. This cheat-resistant feature is then strengthened by the use of follow-up Verification Tests which
are described in more detail in a later section of this manual.
Scoring of SHL Verify Ability Tests
Ability tests are traditionally scored using the number correct model which is the simple sum of correct
answers to the items contained in a test. IRT uses the θ metric which can be interpreted as a standard normal
deviate or Z score with a mean of 0 and a standard deviation of 1. As such, a θ of -1 would indicate someone
scoring as well as or higher than the lowest 16% of candidates, a θ of 0 would indicate that a candidate has
scored as well as 50% of candidates, and a θ of +1 would place a candidate in the top 16% of scores.
θ is obtained through an iterative process which essentially operates, for 2-parameter models, as follows:
• A set of items for which a and b values are known are administered to the candidate.
• The candidate’s right and wrong responses to the items are obtained.
• An initial estimate of the candidate’s θ is chosen (there are various procedures for making this choice).
• Based on the initial θ used and knowledge of each item’s properties, the expected probability of getting the
item correct is calculated.
• The difference between the candidate answering an item correctly and the probability expected of the
candidate answering the item correctly, given the initial theta value, is calculated.
• The sum of these differences across items is standardised, and this standardised difference is added to the
initial θ estimate (negative differences reducing the estimated theta and positive differences increasing it).
• If the differences are non-trivial, then the new θ estimate obtained from the previous step is used to start
the above cycle again.
• This process is repeated until the difference between the value of θ at the start of a cycle and the value
obtained at the end of a cycle is negligible.
The SHL Verify Range of Ability Tests - Technical Manual > 13See Baker (2001) for a more detailed account of theta scoring with worked examples. This approach to scoring
is suited to the randomised testing approach where candidates receive different combinations of items. As all
the items are calibrated to the same metric, then this process also allows scores on different combinations of
items to be directly compared and treated as from the same underlying distribution of ability scores.
Accuracy and consistency of SHL Verify Ability Test scores
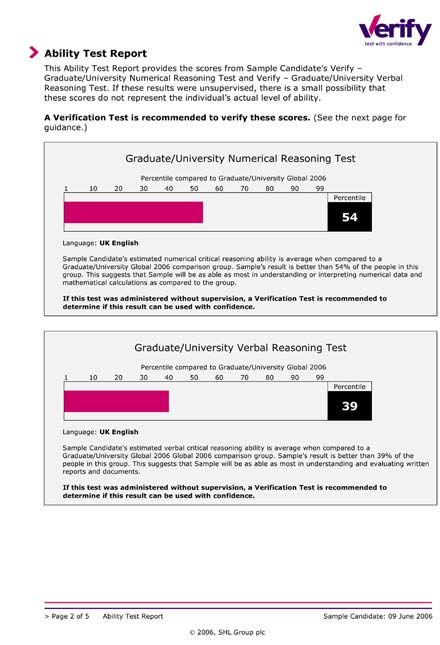
The information provided by an item and a test is indexed in IRT using the Information Function or I(θ). The
Information Function for an item is obtained by combining the expected probabilities of answering an item
correctly and incorrectly at each point on the theta scale, weighted by the a-parameter (discrimination) of
the item. I(θ)’s for items in a test can be summed to provide the Test Information Function. The TIF defines
the range on the theta distribution within which a test provides maximum information on a candidate’s
ability. This, then, tells us the range of ability or theta across which the test functions effectively and provides
accurate score information.
Score accuracy is indexed in IRT by the Standard Error of θ or SE(θ), which is given by 1/[I(θ)]1/2. For those
familiar with CTT indices, SE(θ) functions in a similar way to the Standard Error of measurement or SEM
described in more detail below. However, while the SEM in CTT is a constant across the score range, SE(θ)
is not and varies dependent on the properties of the items contained in a test and the range of θ under
consideration.
The following figure provides an example of a TIF and SE(θ) for a hypothetical test. As can be seen, TIF
reaches a maximum value at around 0.5 to 0.6 theta. SE(θ) reaches a minimum at this point on the theta scale
and increases substantially from -2 theta and below.
The analogous indices to the TIF and SE(θ) in CTT are the test score reliability and the SEM as mentioned
earlier. Using CTT models, reliability can be estimated in different ways depending on the question being asked
of the quality of test scores:
• To answer the question of how a test score is affected by the quality of the items in a test, reliability can be
estimated using the Internal Consistency Coefficient that reports the proportion of variation in scores that
can be attributed to consistency in the measurement properties of the items in the test.
> 14 The SHL Verify Range of Ability Tests - Technical Manual• To answer the question of how a test score is affected by variation in the measurement qualities of different
versions of a test (i.e. which version is administered to an applicant), reliability can be estimated using the
Alternate Forms Coefficient which reports the percentage of variation in scores that can be attributed to
consistent measurement across test versions.
• To answer the question of how consistent scores are over time, then reliability can be estimated by the
Test-retest or Stability Coefficient which reports the proportion of variation in applicants’ rankings on test
scores across two or more administrations at different times.
From the reliability estimated for a score, the standard error of measurement or SEM can be calculated using
the formula (1-rxx)1/2 x SD, where rxx represents the estimated reliability of the score and SD represents the
standard deviation of scores. The SEM is used to define a range within which a person’s true score is likely to
lie. For example, if the reliability of a test is estimated to be 0.8 for a test with an SD of 5, then the SEM for a
score obtained from that test is given by (1-0.8)1/2 x 5 or 2.24. If a person were to obtain a score of 10 on the
test, then there would be a 68% probability that the person’s true score lies between a score of 8 (nearest
whole score to 7.76 and 1 SEM below the observed score) and a score of 12 (nearest whole score to 12.24 and 1
SEM above the observed score).
As indicated by the formula for the SEM, reliability coefficients can be interpreted as the proportion
of variation in test scores attributable to true measurement rather than errors arising from poor test
construction, poor administration and other factors influencing the quality of an assessment. A reliability of
0.8 indicates that 80% of the variation in test scores is attributable to true measurement.
Both CTT and IRT indices of test score quality were used to evaluate the consistency in quality of the
randomised Verify Ability Tests. The procedures used were as follows:
• Based on knowledge of the properties of existing SHL test batteries, θ ranges were defined as those
typifying candidates at the managerial and graduate level, and candidates at the supervisory and operative
level.
• Using those θ ranges, 100 typical Verify Ability Tests were generated for each type of test and at each job
level, giving four sets of 100 or a total of 400 verbal and numerical tests for evaluation. A similar procedure
was applied to Inductive Reasoning tests at the managerial and graduate level.
• The internal consistency of each test was estimated using procedures similar to those described in duToit
(2003).
• The variability of reliabilities across each group of tests was then measured using the median and inter
quartile range. The results of this analysis are presented in the later sections of this manual describing the
psychometric properties of each Verify test. For the Verify Ability Tests, reliability estimates ranges from
0.77 to 0.84.
The SHL Verify Range of Ability Tests - Technical Manual > 15Scales for reporting ability test scores
As with any test or questionnaire, scores on the Verify Ability Tests are interpreted by converting theta scores
to standard scales. These include:
• Percentiles. A percentile score is a score below which a certain percentage of the members in the
comparison group fall. For example, the 90th percentile is the point below which 90% of the members of
the comparison group score. Percentiles are an example of ordinal measurement, which means that they
provide an indication of ranking by test score.
Percentiles have the advantage of being easily obtained and understood. However, they suffer the
disadvantage that they are not equal units of measurement. Accordingly, percentiles should not be
averaged.
• Standardised Score Scales. To overcome problems implicit within rank order scales such as percentiles
(i.e. measurement scales that do not have equal units of measurement) various types of standardised scales
have been developed. The following are among the most common used in employment settings.
The standard score or Z-score is based on the mean and standard deviation. It indicates how many
standard deviations a score is above or below the mean. Usually when standard scores are used they are
interpreted in relation to the normal distribution curve. One advantage of using the normal distribution as
a basis for comparison groups is that the standard deviation has a precise relationship with the area under
the curve. For example, one standard deviation above and below the arithmetic mean includes 68% of the
scores. The theta score obtained from the Verify Ability Tests can be treated as a Z-score.
In the SHL Verify Ability Test Report, two transformed standard score scales are provided: T-scores and the
Sten scale. T-scores are a transformation of the Z-score based on a mean of 50 and a standard deviation
of 10. They represent equal units of measurement and therefore may be manipulated mathematically (e.g.
summed or averaged).
Sten is an abbreviation of standard ten and divides the score range into ten units. It is based on a mean of
5.5 and a standard deviation of 2. Sten scores are taken to the nearest whole number with a minimum value
of 1 and a maximum value of 10.
> 16 The SHL Verify Range of Ability Tests - Technical ManualHow psychometric verification preserves the validity of
the Verify Ability Test scores
This section describes how the SHL Verify Range of Ability Tests incorporates psychometric verification in the
testing process, and the evidence supporting its accuracy in detecting cheating and correcting for it.
The SHL Verify process of psychometric verification
The SHL Verify testing process is described in the figure below. It includes an unsupervised ability test
followed by a supervised verification test, both of which are delivered online. At a point prior to or at the
point of administering the Verification Test, it is strongly recommended that the candidate’s identity is
authenticated. We recommend that authentication requires the candidate to provide identification by means
of a legal document containing photographic identification. Examples would include a passport, national
identification card or a driver’s license containing a photograph.
The point at which the Verification Test is administered may be decided by the user depending on candidate
volumes and when administration would be convenient in the assessment process. The following provides two
example scenarios:
• In larger volume processes involving several stages and using a suitable cut-score on the Verify Ability Test
score(s), candidates are sifted into call forward or reject groups. Verification Tests may be administered
towards the end of the process when numbers of candidates have been reduced, and with the results of the
Verification Test being made part of the conditions of employment offer.
• In smaller scale one-to-one assessments, verification might take place alongside other assessments used in
an assessment or development centre, or at a subsequent stage such as final interview or feedback point.
Psychometric verification as offered by the SHL Verify Range compares the candidate’s scores on the ability
and verification tests to obtain a Confidence Indicator or CI. The CI checks the likelihood of the difference
between the scores and, when that likelihood is small and statistically unlikely, flags the score(s) as not
verified in the Verify Verification Report.
A score that has been flagged in this way is known as aberrant and an aberrant score should not be
interpreted as automatic evidence of cheating. A not verified result may occur for various reasons such
as the candidate’s physical or psychological state when administered the Verification Test. An aberrant score
does represent a score that has low validity, that merits investigation and that may lead to the need for a
further Verify Ability Test administration.
The SHL Verify Range of Ability Tests - Technical Manual > 17Dealing with scores flagged as not verified
Before investigating an aberrant score, it is important to decide what the possible outcomes of that
investigation and discussions with the candidate could be. One option would be to administer another Verify
Ability Test in supervised conditions, and to use the score from that administration in place of the original
score flagged as aberrant. It is possible that, when more than one Ability Test are used, one, two or three
scores may be flagged as not verified. Where only one score has been flagged, then the user may administer
another corresponding Verify Ability Test under supervised conditions to replace the score that has been
flagged. Where two or all scores have been flagged, then the user is advised to administer corresponding
Verify Ability Tests under supervised conditions.
Prior to a discussion of aberrant scores with a candidate, it is worthwhile looking at other available
information that can help your understanding of why the scores may be so different. For example, is there
information on the candidate’s performance on related educational tests or exams? Is there information on
the candidate’s CV or résumé related to training and/or work experience of tasks involving general reasoning,
numerical or verbal abilities? Are there other assessment data such as simulation scores involving verbal
ability (such as in-trays, report writing, presentations, group discussions) or numerical ability (such as in-trays
or other exercises involving the analysis and interpretation of numerical data)? Are there patterns in scores
on other instruments such as the OPQ that are relevant such as the Evaluative Data Rational scales and
Conceptual Reasoning?
Investigating an aberrant score should be undertaken with sensitivity. Discussions with a candidate whose
score(s) have been flagged as not verified should begin by telling the candidate that the purpose of discussing
their score results is to ensure that the assessment is accurate and valid, and to ensure that the candidate has
a fair opportunity to proceed through the employment process.
When investigating a not verified score, the following possible reasons for aberrance should be explored:
• What was the candidate’s physical condition at the time of the Verification Test administration? Was this
significantly different to when the candidate sat the Verify Ability Test(s)?
• Were there any reasons why the candidate was unable to focus while taking the Verification Test such as
distractions or interruptions?
• Did the candidate attempt all of the items in the Verification Test or only a few? Were there reasons such as
physical or psychological factors that interfered with the candidate’s ability to work through the Verification
Test?
• Did the candidate make full use of the practice tests available prior to taking the Verify Ability Tests?
Did they go to www.shldirect.com to take the practice tests available there? Keep in mind that, as the
ability and verification tests are correlated 0.7 and above, then the candidate should have benefited from
familiarity obtained from sitting the Verify Ability Test(s) when sitting the Verification Test (i.e. familiarity
with the content, the interfaces and what is expected of them to answer the items).
• Why does the candidate think that performance on the two tests could be so different? Have they
experienced this before when taking tests and/or exams in the past, or on previous ability tests taken during
employment processes.
Notifying candidates at the start of the process that they are expected to take the tests honestly and that
verification procedures will be used will reduce the incidence of cheating. An important aspect of test security
is to establish a clear relationship with the candidate and to be clear about what the rules for assessment are
that all candidates are expected to abide by. See Burke (2006) for a more detailed discussion of these issues.
> 18 The SHL Verify Range of Ability Tests - Technical ManualHow effective is the SHL Verify testing process in detecting cheats?
One of the possible reasons for an aberrant score flagged as not verified is that the first score was obtained
through cheating, either by a proxy taking the test on behalf of the candidate or through collusion with others
such as assistance from a coach. Cheating has the effect of inflating the candidate’s test score which will be
reported as substantially higher than the candidate’s true ability.
A number of large-scale computer simulations were undertaken to evaluate how well the CI (Confidence
Indicator) detects cheating. Simulations are a well-established method for testing models in psychometrics
and the social sciences generally (see Mooney, 1997, for more details on the design and use of Monte Carlo
simulations).
A variety of scenarios were tested using the simulations including percentage of the candidate population
cheating, the type of cheating (by proxy or by collusion), the gain in scores from cheating (e.g. gains as much
as 2 standard deviations in scores), as well impacts at different cut-score levels (e.g. 30th percentile versus
70th percentile). The basic structure of the simulations was as follows:
• A normal distribution of theta scores with a mean of 0 and a standard deviation of 1 was generated for a
population of 10,000 candidates. These represent the true ability scores of the candidates.
• The IRT properties of SHL Verify items and tests were used to construct 100 tests assigned at random to
candidates. These represent the reported ability levels of the candidates which will be inflated for scores
achieved through cheating and when a candidate is assigned to the cheating group.
• A cheating condition was constructed such as cheating by proxy with cheats achieving a theta score of +2.
These represent the inflated estimates of ability as would be reported by a compromised test.
• Random assignment of candidates to the non-cheating (honest) group and cheating groups based on a
proportion of candidates cheating.
• Assignment to the cheating condition was also based on an assumed correlation between ability and the
propensity to cheat of -0.3 (see Cizek, 1999, for information on research supporting this assumption). Thus,
the probability of assignment to a cheating group was conditioned on the candidate’s true ability.
• The results from the simulated cheating condition were then compared with results obtained from a
matching simulation in which all candidates took the assessment honestly.
The SHL Verify Range of Ability Tests - Technical Manual > 19To evaluate the effect of cheating and the returns obtained from using the verification tests, a benefits
ratio was constructed. This benefits ratio is based on the cross-classification as shown below of true and
reported scores (although the example shows the 40th percentile as the basis for decisions, these ratios
were computed for a range of cut-scores and the figure shows just one example of the cut-scores evaluated).
The effect of cheating would be expected to increase the proportion of candidates classified as cell B (false
selections) relative to the proportion of candidates classified as cell D (correct selections). The benefits ratio
was defined as the ratio of D to B. For example, if the ratio of correct selections (D) to incorrect selections (B)
for a sample of 120 is 100 : 20, then the benefits ratio (the measure of the benefit of using a test score) is 5 : 1.
Benefits ratios were computed for both the Verify Ability Test stage and forthe verification stage.
:Xe[`[Xk\
j
Kil\8Y`c`kp
C\jjk_Xe+'k_ +'k_g\iZ\ek`c\
g\iZ\ek`c\ fi^i\Xk\i
84Zfii\Zkcp :4`eZfii\Zkcp
C\jjk_Xe+'k_ ZcXjj`]`\[Xj ZcXjj`]`\[Xj
g\iZ\ek`c\ ZXe[`[Xk\jkf ZXe[`[Xk\jkf
Y\i\a\Zk\[ Y\i\a\Zk\[
:Xe[`[Xk\
j
I\gfik\[8Y`c`kp
94`eZfii\Zkcp ;4Zfii\Zkcp
+'k_g\iZ\ek`c\
fi^i\Xk\i ZcXjj`]`\[Xj ZcXjj`]`\[Xj
ZXe[`[Xk\jkf ZXe[`[Xk\jkf
Y\XZZ\gk\[ Y\XZZ\gk\[
Results across simulation scenarios were consistent and the following provides a typical set of results for a
simulation of verbal scores where one-in-five candidates cheat by proxy, achieve a substantial gain in scores
placing them well into the top 5% of scores on the first test, and where a cut-score of the 40th percentile is
used to bring candidates forward to a subsequent stage or to reject candidates. The effects from cheating are
compared to a matching simulation of honest test taking (i.e. no-one cheats).
> 20 The SHL Verify Range of Ability Tests - Technical Manual:Xe[`[Xk\
j
Kil\8Y`c`kp
C\jjk_Xe+'k_ +'k_g\iZ\ek`c\
g\iZ\ek`c\ fi^i\Xk\i
C\jjk_Xe+'k_ 84*#+)' :4-,,
Efe$Z_\Xk`e^ g\iZ\ek`c\
*+
.
_fe\jk
Zfe[`k`fe :Xe[`[Xk\
j
I\gfik\[8Y`c`kp
+'k_g\iZ\ek`c\ 94-** ;4,#)0)
fi^i\Xk\i
-
,*
:Xe[`[Xk\
j
Kil\8Y`c`kp
C\jjk_Xe+'k_ +'k_g\iZ\ek`c\
g\iZ\ek`c\ fi^i\Xk\i
C\jjk_Xe+'k_ 84)#',+ :4+/'
:_\Xk`e^ g\iZ\ek`c\
)'
,
[`j_fe\jk
Zfe[`k`fe :Xe[`[Xk\
j
I\gfik\[8Y`c`kp
+'k_g\iZ\ek`c\ 94(#0/0 ;4,#+..
fi^i\Xk\i
)'
,,
Before discussing the honest versus cheating scenario comparisons, the reader may have noted two aspects
of the results. First, there are a number of those with true ability above the 40th percentile who are rejected
at the first stage of both scenarios (7% and 5%). This reflects the false negative rate that is a result of the
test not having perfect reliability. The correct classification rates in both scenarios can be computed by
the formula (A + D)/N, where N is 10,000, the total population size. In the honest condition, this is (3,420 +
5,292)/10,000 or 87%. In the cheating scenario, this is (2,054 + 5,477)/10,000 or 75%, which is substantially
lower than the honest condition but still a reasonable correct classification rate. However, note that the
incorrect classification rate almost doubles in the cheating scenario when compared to the honest test-taking
scenario (25% as compared to 13%).
The second aspect is that the results of the two scenarios report different percentages for cells C and D,
indicating variations across the two simulations. This is a consequence of the tests having high but not perfect
reliability, and the fact that both simulations were run independently allowing the generation of true abilities
and the assignment of simulated candidates to different Verify Verbal Ability Tests in each scenario to reflect
variations in real world testing.
The SHL Verify Range of Ability Tests - Technical Manual > 21In the honest condition, the benefits ratio from using the ability score at the first stage is 5,292 : 633 or
around 8. In other words, the return to the user is 8 correct decisions to every incorrect decision. The fact
that the totals of those called forward, 633 + 5,292 or 5,925 (59% of candidates), is less than 6,000 (or 60%)
again reflects the simple fact that Verify Ability Test scores are accurate but not perfectly reliable. In the
cheating condition, we can see the inflation of Cell B as expected, and the benefits ratio has decreased to
5,477 : 1,989 or around 3.
The next step in the simulations was to administer the verification tests to those candidates brought forward
in the honest and cheating conditions. The properties of the verification tests reported in this manual were
used for this stage of the simulations. These results are summarised in the next set of tables which show that:
• In the non-cheating (honest) condition, 107 or 17% of the 633 candidates incorrectly brought forward from
the first stage have their scores flagged as not verified. This compares to 265 of the 5,292 or 5% of those
correctly brought forward who do not have their scores verified. The latter occurs because, while they are
accurate and correlated with the ability scores, the Verification Tests are not perfectly reliable. The ratio
of those with true ability above the 40th percentile who are called forward and whose scores are verified
to those whose scores are verified but their true ability is less than the 40th percentile is 5,027 : 526 or
around 10. This is a 25% increase over the benefits ratio of 8 obtained at the first stage.
• In contrast, for the cheating condition 1,465 or 74% of the 1,989 incorrectly brought forward from the first
stage have their scores not verified. This compares to 509 or 9% of the 5,477 correctly brought forward
and who do not have their scores verified (we will come back to this below). The benefits ratio at the
verification stage in this cheating scenario is given by 4,968 : 524 or around 10, a three-fold increase on the
benefits ratio of 3 obtained from the first stage where cheating has had a significant impact on the numbers
getting through that stage.
Why do 9% of those who were correctly brought forward from the first stage have their scores not
verified? The simulations allow us to know who in the population of candidates were cheats. As the propen-
sity to cheat is negatively correlated with ability, this means that some of the candidates whose true ability is
above the 40th percentile and did not need to cheat, did, nonetheless, cheat.
> 22 The SHL Verify Range of Ability Tests - Technical Manual=`ijkJkX^\
JZfi\
@eZfii\Zkcp :fii\Zkcp
j\c\Zk\[ 9 j\c\Zk\[ ;
JZfi\jm\i`]`\[ ,)- ,#').
Efe$Z_\Xk`e^
_fe\jk
Zfe[`k`fe M\i`]`ZXk`feK\jkI\jlck
JZfi\jefk ('. )-,
m\i`]`\[
=`ijkJkX^\
JZfi\
@eZfii\Zkcp :fii\Zkcp
j\c\Zk\[ 9 j\c\Zk\[ ;
JZfi\jm\i`]`\[ ,)+ +#0-/
:_\Xk`e^
[`j_fe\jk
Zfe[`k`fe M\i`]`ZXk`feK\jkI\jlck
JZfi\jefk (#+-, ,'0
m\i`]`\[
The following table shows the breakdown of not verified scores by cheats and non-cheats.
Breakdown of not verified Incorrectly brought forward Correctly brought forward
scores from first stage from first stage
Non-cheats 50 (2%) 254 (13%)
Cheats 1,415 (72%) 255 (13%)
As we can see, around 50% of those who were correctly brought forward in the cheating scenario and flagged
as not verified were, in fact, cheats (255 of the 509 with true abilities above the 40th percentile). Overall,
1,670 (1,415 + 255) or 85% of the 1,974 candidates not verified were cheats. Of the 1,989 brought forward
in error (their true abilities were below the 40th percentile), 1,465 or 74% were correctly identified through
the verification test as not having a true ability above the cut-score used. Of these 1,465, 1,415 or 97% were
cheats.
The SHL Verify Range of Ability Tests - Technical Manual > 23In addition to offering detection of cheating, the verification stage also acts to correct errors at the first
stage (as demonstrated by picking up false selections in the honest scenario described above). This correction
can be seen by looking at the distributions of scores at each stage of the process for the cheating scenario.
These are shown below.
Distribution of true
ability (θ) for the
population of 10,000
(green vertical line
shows 40th percentile
cut-score)
Distribution of true
ability (θ) for those
passing the first stage
Distribution of true
ability (θ) for those
whose first stage score
is verified
Summary
This section has described the process of psychometric verification offered by the SHL Verify Range of
Ability Tests. As shown by the example taken from the extensive and large-scale simulations used to test
the Verify process, psychometric verification is effective in identifying those brought forward from a first
stage of assessment in error, and in identifying cheats. However, a score flagged as not verified in the Verify
Verification Report should not be interpreted automatically as indicating cheating behaviour, and the possible
reasons for an inconsistent and aberrant score should be investigated systematically and with sensitivity.
> 24 The SHL Verify Range of Ability Tests - Technical ManualTechnical details of the verbal and numerical Verify tests
by general level
The Verify Range of Ability Tests currently comprises 3 individual measures of reasoning; Verbal, Numerical
and Inductive Reasoning. The 3 tests can be administered either separately or in any combination, driven by
the behaviours to be assessed.
Both the Verbal and Numerical tests are examples of deductive reasoning measures. Broadly speaking, this is
the ability to work with problems that are bounded and where methods or rules to reach a solution have been
previously established.
Verbal Test typifying the management and graduate levels
The figure below shows the θ range of the tests used to evaluate consistency in the quality of SHL Verify
Verbal Ability Tests at this level. For a test operating with a CTT reliability of 0.8, the target TIF value is 5. This
defines a θ range for effective functioning of tests typifying the upper end of difficulty in the SHL Verify verbal
item bank as lying between θ’s of -2 to +0.5.
For the 100 verbal tests generated in this range, the median reliability (internal consistency) was 0.81 with an
inter quartile range of 0.79 to 0.82, indicating a high level of consistency within and across verbal tests.
Verbal Test typifying the supervisor and operational levels
The figure below shows the θ range covered by the tests used to evaluate consistency in the quality of SHL
Verify Verbal Ability Tests at this level. The θ range of -3 to -0.8 defines the range for effective functioning of
verbal ability tests at this level.
The SHL Verify Range of Ability Tests - Technical Manual > 25For the 100 verbal ability tests generated, the median reliability (internal consistency) was 0.78 and the inter
quartile range was 0.77 to 0.80, indicating a high level of consistency within and across the tests generated.
Verify Numerical Reasoning is designed to measure a candidate’s ability to make correct decisions or
inferences from numerical or statistical data. The test is intended to measure the ability to work with
numerical data in a realistic workplace context. Further details of the validation studies for Verify Numerical
Reasoning can be found later on this manual.
Numerical Test typifying the management and graduate levels
The next figure shows the θ range used to evaluate the SHL Verify Numerical Ability Tests at the manager
and graduate levels. A theta range of between -1.5 and +1 was identified as defining effective functioning for
numerical tests at these levels. For the 100 numerical tests generated in this range, the median reliability
(internal consistency) was 0.83 and the inter quartile range was 0.81 to 0.84, again indicating a high level of
consistency within and across typical numerical tests at this level.
Numerical Test typifying the supervisor and operational levels
The next figure shows the θ range used to evaluate the SHL Verify Numerical Ability Tests at the supervisor
and operational levels for which a θ range from -2.5 to -0.9 defines effective functioning of numerical tests at
this level.
> 26 The SHL Verify Range of Ability Tests - Technical ManualYou can also read