The Simulated Sky: Stellarium for Cultural Astronomy Research - arXiv
←
→
Page content transcription
If your browser does not render page correctly, please read the page content below
RESEARCH

The Simulated Sky: Stellarium for
Cultural Astronomy Research
Georg Zotti
Ludwig Boltzmann Institute for Archaeological Prospection and Virtual Archaeology, Vienna, Austria
Georg.Zotti@univie.ac.at

Susanne M. Hoffmann
Friedrich-Schiller-Universität Jena, Michael-Stifel-Center/ Institut für Informatik and Physikalisch-
Astronomische Fakultät, Jena, Germany
susanne.hoffmann@uni-jena.de

Alexander Wolf
Altai State Pedagogical University, Barnaul, Russia
alex.v.wolf@gmail.com

Fabien Chéreau
Stellarium Labs, Toulouse, France
fabien.chereau@gmail.com

Guillaume Chéreau
Noctua Software, Hong Kong
Guillaume.chereau@gmail.com

Abstract: For centuries, the rich nocturnal environment of the starry sky could be modelled only
by analogue tools such as paper planispheres, atlases, globes and numerical tables. The immer-
sive sky simulator of the twentieth century, the optomechanical planetarium, provided new
ways for representing and teaching about the sky, but the high construction and running costs
meant that they have not become common. However, in recent decades, “desktop planetarium
programs” running on personal computers have gained wide attention. Modern incarnations are
immensely versatile tools, mostly targeted towards the community of amateur astronomers and
for knowledge transfer in transdisciplinary research. Cultural astronomers also value the possibili-
ties they give of simulating the skies of past times or other cultures. With this paper, we provide

JSA 6.2 (2020) 221–258 ISSN (print) 2055-348X
https://doi.org/10.1558/jsa.17822 ISSN (online) 2055-3498
222 Georg Zotti et al.

 an extended presentation of the open-source project Stellarium, which in the last few years has
 been enriched with capabilities for cultural astronomy research not found in similar, commercial
 alternatives.

 Keywords: astronomical simulation; desktop planetarium; Stellarium; sky culture research;
 virtual archaeoastronomy

 Introduction
 Artificial illumination has utterly changed the human experience of the nocturnal sky
 in large parts of the world. As much as 80% of North Americans and 60% of Europeans
 cannot see the Milky Way from their homes (Falchi et al. 2016), and the current generation
 of children living in cities and towns may never have experienced a natural (or at least a
 largely natural) night sky dominated by the light of the Moon and stars and the sublime
 glow of the Milky Way, which since ancient times has evoked the proverbial “Ultimate
 Question of Life, the Universe and Everything” (Adams 1979). The extent to which an
 awareness of the skyscape and its past cultural significance has diminished can be seen
 in frequent questions at public stargazing events along the lines of “What? You can really
 see the planets without a telescope?” Yes, you can – and this is what has inspired many
 philosophers and early scientists (Starlight Initiative 2007). At the same time, however,
 those areas of the world most affected by light pollution are where computer screens,
 mobile phones and other electronic gadgets offer broad educational potentialities for
 educational simulations of nature, including the night sky. While no present simulation
 can completely recreate the natural outdoor experience with its solemn nocturnal
 impressiveness, at least some visual components can be replayed and can hopefully keep
 a principal interest in the sky awake.
 Simulated skyscapes are also crucial tools for researchers in the fields of history of
 astronomy, archaeoastronomy and ethnoastronomy when attempting to interpret the sky
 in combination with human-made structures, for example floor plans of excavated build-
 ings and monuments or remains of former cave dwellings. Over centuries and millennia,
 both the slight change in tilt, and to a greater extent, precessional movement of the Earth’s
 axis have changed the orientation of the sky relative to the horizon. In addition, the proper
 motion of stars has significantly changed the position of a handful of bright ones since
 their place was catalogued in antiquity. This means that even under the best conditions
 without light pollution, today’s natural sky over old structures does not provide the same
 view the builders of these structures would have seen with their own eyes.
 The open-source desktop planetarium software Stellarium was created in response
 to problems such as these, and in recent years it has gained great significance in the field
 of cultural astronomy. Most readers may already be familiar with it and or use it in their
 research, including to illustrate papers and books – which we as its creators welcome,
 especially when properly acknowledged. In the Journal of Skyscape Archaeology we have
 so far published only a few brief “Software Notes” (Zotti and Wolf 2017; 2018), and in this
 paper we want to provide more detailed insights about how and why Stellarium was
 created, what it can be used for (as of version 0.20.4 – see Stellarium 2020), how accurate

 © 2021 EQUINOX PUBLISHING LTD
The Simulated Sky 223

we consider it to be and how users can help to improve and further extend it. For context,
we begin with a brief overview of historical astronomical technology, after which we
present a brief history of the project and its uses for virtual archaeoastronomy, which also
drove much of the project’s recent efforts for increased accuracy. We then discuss the
application of exchangeable “skycultures”, a feature which was originally geared mostly
towards use in local communities but is attracting increasing interest by researchers in
ethnoastronomy and even astrophysics. We then conclude with a brief discussion.

Learning the Constellations: A Short History of Simulated Skyscapes
From the seventeenth to the twentieth century, astronomers working in the Western
tradition were familiar with the application of planispheric star maps made from card-
board, the simplified descendants of the medieval planispheric astrolabe. These interac-
tive maps make it possible to learn the constellations, identify what stars would be visible
on a particular date, or even find a good estimate for rising or setting times, by aligning a
star map surrounded by a circularly enclosing date scale with a horizon mask that shows
a circularly enclosing time scale. They are easy to transport but have disadvantages: for
example, they are only computed for a particular geographical latitude, the part of the
sky revealed by the horizon mask appears heavily distorted and the planet positions are
not displayed but have to be taken from a yearly almanac. A more luxurious instrument,
which was mostly confined to indoor study, was the celestial globe (Mokre 2008; Hoff-
mann 2017), the concept of which had been described by Ptolemy (Almagest 8.3–6) in
antiquity. Some globes were large, such as the 4 m Coronelli globes created for Louis XIV
(Coronelli 1683; Milanesi 2018) and the Globe of Gottorf, built in 1664 (Meier 1992; Lühning
1997), and there were also great walk-in globes, such as the now-lost “Pancosmos” of
Erhard Weigel that was installed at the city palace of Jena (Jenaer Stadtschloss) in 1661
(Meier 1992; Kratochwil 2011), and later examples that could be experienced by the public
at the World’s Fairs in London in 1851 and Paris in 1889 (Geppert 2010).
 The twentieth century saw the development of an immersive environment in which
the sky and the movements of its various features – Sun, Moon, planets, fixed stars and so
on – could be experienced by urban populations. This was the optomechanical projection
planetarium (for example, Firniss 1980; Meier 1992; Boyce-Jacino 2018), first developed
in the 1920s. This system simulates a view of the upper hemisphere of our environment
projected onto a dome. A variety of projection systems was developed during subsequent
decades, progressing from tilted domes to omnitheatres with auxiliary projectors at the
periphery and domes that dispense with a central projector and use video projectors
at various angles. In their attempts to produce an almost perfect simulation of the real
sky, all systems have their pros and cons (Rienow 2013 and references therein), but sky
simulation above the mathematical horizon is reasonably complete in modern projection
planetariums. In early installations, the local horizon was usually modelled with a card-
board or sheet metal skyline silhouette of the respective city, with dim lights shining from
behind around the horizon even simulating the horizon brightening caused by urban
light pollution. In the 1980s, the development of new projection systems allowed these
fixed panoramas to be replaced by images cast by auxiliary projectors.

© 2021 EQUINOX PUBLISHING LTD
224 Georg Zotti et al.

 An advantage of the dome planetarium is the way that the immersive experience
 makes science accessible to wide audiences. This includes historical astronomy: a popular
 show of the 1970s in Vienna’s planetarium (and many other planetaria) was a presenta-
 tion about the “Star of Bethlehem” and its interpretation by Ferrari d’Occhieppo (1969;
 inspired by Johannes Kepler) as a triple conjunction of Jupiter and Saturn as they met
 three times within a few months in 7 BC. The mechanical planetarium projector had
 been found to be accurate enough for this kind of presentation (Mucke 1967), but it
 required many hours of supervised backward winding of the planetary gears. A more
 significant limitation is that planetarium domes are scarce and rarely available for pure
 research, both due to the costs involved – planetariums are usually private enterprises –
 and the training required to work with them. Also, there is a drawback with the classical
 hemispherical dome and a projector optimised to keep spherical angles correct when
 projected onto it: a foreground which could provide archaeological contexts such as the
 foundations of a prehistoric monument cannot be displayed on a domed screen that cuts
 off the view at the mathematical horizon (Zotti et al. 2006). Only the latest generation of
 digital planetaria can create the required foreground context by digitally contracting
 the sky and projecting a field of view larger than 180° onto the hemispherical screen, so
 that enough of the ground becomes visible along the edge of the dome and still aligns
 correctly with the – now intentionally distorted – celestial geometry.
 The early era of home computers in the 1970s and 1980s allowed the development of
 software for astronomy enthusiasts (Meeus 1988; 1998; Montenbruck and Pfleger 1989).
 First limited to numerical data output, the arrival of interactive graphics output, much
 of which was driven by the computer games industry, also allowed the development of
 various star-mapping programs. Popular astronomy magazines provided programming
 columns, and finally the World Wide Web simplified the distribution of programs and
 data. By the late 1990s, these programs provided a fairly realistic representation of the sky
 which could be set for any location on Earth or even on other planets. Some allowed the
 representation of mountains or houses along the local horizon to intensify the sense of
 immersion, first by use of polygonal obstruction masks and later by a panorama photo-
 graph. Many such programs represented the sky as a hemispherical view in stereographic
 projection known from earlier printed material, while others used the perspective view
 more common to photographic and video cameras and computer games. This view
 makes it possible to zoom in on particular objects, whereas very wide-angle perspective
 views are extremely distorted and can never show the full sky. Such programs, also based
 on improved models of planetary motions like VSOP87 (Bretagnon and Francou 1988),
 finally provided views and a simulation accuracy approaching, or even in some ways
 surpassing, the quality of the projection planetarium (although lacking the immersive
 quality of the dome) and thus invited their application in historical research which had
 hitherto been based on numerical tables (for example, Hunger 1994; 1997).
 In recent years, the mostly portable telescopes used by amateur astronomers have
 been augmented with computer control for locating and tracking objects, and some of
 today’s amateurs can now create photographs that regularly surpass the best professional
 results achieved with much larger instruments only a few decades ago. Computer soft-

 © 2021 EQUINOX PUBLISHING LTD
The Simulated Sky 225

ware, often included as components of desktop planetarium programs, can aid in setting
and controlling telescopes and instrumentation. For observation planning, and during
observation in the field, computer desktop planetarium programs, and more recently
also programs running on smartphones and tablet computers, have largely superseded
the classical cardboard planisphere and often also the classical printed sky atlas.

A Brief History of Stellarium
In the summer of 2000, one of us (FC) as a student started a project that was both a hobby
and connected with his studies. The aim of his “Stellarium” was to provide a realistic
simulation of the sky, using state-of-the-art 3D computer graphics technology. At that
time, OpenGL, a programming library for real-time computer graphics, had started to be
supported by affordable consumer graphics cards on the three major desktop platforms
of Linux/X11, Microsoft Windows and Apple Macintosh. He soon decided to make the
program’s source code publicly available under the GNU Public License and invited fellow
developers to join the project (Stellarium 2020). The project then started to take off,
especially among astronomy enthusiasts and planetarium owners, and by 2006 a team
of four to five volunteer developers distributed around the globe was very active on the
project. Each member contributed specialist expertise, bringing in major features such
as large star catalogues, various sky projections, improved planetary accuracy, a scripting
feature and a modular plugin (extension) system, as well as a revamped GUI based on
the Qt programming framework (Qt 2020) and a new website and user guide. The project
then quickly gained visibility, grew its user base to an estimated 10–15 million users and
won several awards such as being elected “Project of the Month” on sourceforge.net
in May 2006 (Stellarium 2006). In 2007, Fabien started to work full-time on Stellarium as
part of his work at the European Southern Observatory (ESO), where he extended Stel-
larium to enable browsing and displaying professional astronomical observations made
by large observatories such as the Very Large Telescope (VLT – Kapadia et al. 2008). This
sponsorship also permitted the costly refactoring without which such quickly growing
C++ projects often become impossible to maintain.
 By 2010, this first team of developers had developed Stellarium into a stable program
with an unconventional but intuitive user interface that surpassed the visual quality
of most other astronomical simulators. It could control several types of computerised
telescopes, simulate the view through ocular equipment and identify the locations of
artificial satellites. Most user complaints had to do with graphical issues, and in most of
these cases users had not installed the appropriate graphics drivers. However, numerical
accuracy was also criticised, especially when simulating historical skies, and indeed,
a chain of improvements on this issue has been made in the versions that have since
appeared.
 One major leap forward was support for ΔT, the difference between Terrestrial Time
(TT) and Universal Time (UT) caused by the irregular slowdown of Earth’s rotation, intro-
duced in version 0.12.0 (2013) – to our knowledge, Stellarium is the only program so far
to even include support for many models of ΔT, which allows users or researchers to
visualise the effects of the application of particular models or to research a custom model

© 2021 EQUINOX PUBLISHING LTD
226 Georg Zotti et al.

 by assigning the coefficients for the common quadratic formula to compute ΔT. Adding
 the computation of ΔT greatly improved the accuracy of visualisation for solar eclipses
 in the program. However, ΔT is known only from solar eclipse records that date back to
 the first millennium BC, so that a simulation of solar eclipses, and any conclusions that
 are based on a “virtual observation” of a solar eclipse from a particular location at some
 much earlier date, should be regarded with much caution. This uncertainty of ΔT is not a
 problem for Stellarium in particular, but for all known simulations.
 The other major improvements in accuracy were the adoption of a long-time model
 for the precessional motion of Earth’s axis (Vondrák et al. 2011; 2012) in version 0.14.2
 (2015) and access to the DE430/431 ephemerides (Folkner et al. 2014) since version 0.15
 (2016).
 A major internal change was the upgrade of Qt (a C++ programming library and the
 framework for cross-platform development of the user interfaces used by Stellarium),
 which reflects Stellarium’s step from version 0.12 (the last series based on Qt4) to 0.13
 (based on Qt5). Many users were still running old hardware and demanded many more
 years of support for the technically obsolete 0.12 series. Unfortunately, after the switch to
 Qt5 most of the original team members decided to leave the project, and since around
 2014 Stellarium has mostly been developed further by a team of only two (AW, GZ), with
 major contributions in functionality developed in collaboration with students from TU
 Wien (Vienna University of Technology – Zotti 2016; Zotti et al. 2017), other students
 sponsored by the European Space Agency’s Summer of Code in Space programme and,
 mostly for various telescope control features, by several other external contributors.
 Additionally, operating and development systems have continued to evolve and years
 after Windows XP had been officially retired, Stellarium also had to stop supporting its
 use on that system. We will likely face a similar upgrade challenge to Qt6 next year (2021),
 but cannot currently say in detail what will change.
 An Astronomical Calculations (AstroCalc) window was introduced in version 0.15.0
 (2016) as a simple tool to compute planetary phenomena and ephemerides in tabular
 form and also as plotted curves in the sky. This tool has been greatly enhanced in succes-
 sive versions. It is aimed at amateurs, for planning their own observations, and at educa-
 tors and researchers who wish to obtain some quick advanced computations, such as
 relations between magnitude (brightness) and phase angle for planets over several years
 (simultaneous visualisation of two functions of time in a separate panel), the horizontal
 positions of the Sun observed on any Solar system object during a year (visualisation of
 the analemma) or a plot of the path of a comet on the sky (ephemeris).

 Spinoffs, Forks and Related Projects
 Nowadays, the name “Stellarium” is used in several contexts. The desktop version (on
 which this paper is focused) is currently the most complete system. However, by 2006
 its high visual appeal was already sufficient for use of the program in small planetarium
 domes. One early contributor separated and “forked” a project called NightShade, from
 which later Stellarium360 (2012) and SpaceCrafter (2016) were derived. Another digital

 © 2021 EQUINOX PUBLISHING LTD
The Simulated Sky 227

planetarium fork is ShiraPlayer (2013). All of these have been developed with the particular
needs for planetarium shows in mind (for example, a dome video player). However, each
fork means leaving the main developing line, and new features found in Stellarium
cannot be expected to be available automatically in the spinoff projects and vice versa.
The upcoming era of smartphones invited another official fork by one of us, “Stellarium
Mobile”, which is based on version 0.13 and runs on most Android smartphones.
 Further development of network infrastructure and the ubiquity of internet access
invited the creation, in 2017, of an entirely new project, Stellarium Web, initiated by
Guillaume Chéreau. The goal of this project was to create a new version of Stellarium,
light enough to run directly in a web browser. This was achieved by re-coding the low-
level part of the engine from scratch, almost exclusively in pure C language without any
external dependencies, and converting it into a JavaScript library using the emscripten
compiler (emscripten 2020). The new engine was also designed to handle large amounts
of online imaging and sky object catalogues instead of relying on local file-based data.
The version currently online (Stellarium Web 2020) has a binary size of less than 2 MB
(allowing fast download and start-up), runs at 60 fps (frames per second) on most recent
computers and can display most celestial objects with a magnitude brighter than 20.
However, despite these exciting capabilities, this web version still has only a limited set
of features and the accuracy of planetary computations for times in the distant past or
future is not yet on a par with its desktop counterpart. It is therefore not recommended
for use in archaeoastronomy, although this may change in the future.

Stellarium for Cultural Astronomy
On the surface, archaeoastronomy combines the skills of both archaeologists and
astronomers – researchers dealing with material evidence of past human cultures on the
ground or buried in the soil versus those observing and studying celestial phenomena
and, more recently, the underlying physics. One important field in archaeoastronomy is
concerned with the orientation of architecture, like temple axes or building entrances,
towards particular phenomena observed in past skies, such as solstitial sunrises or
sunsets, extreme points in the path of the Moon or the rising and setting points of
particularly bright stars. Most aspects of this research, and also most studies about the
astronomies of other cultures, require only classical positional astronomy and rarely deal
with the physical nature of celestial objects.
 An exception is the question of the nature of “transients” (short-lived unexpected
celestial phenomena, e.g. comets, or stars flaring up as novae or supernovae) among
historical observations – a field which builds a bridge between historical astronomy and
astrophysics. As there are individual data points some hundred or even some thousand
years ago, these observations could possibly contribute to the research on and modelling
of the long-term evolution of close binaries such as symbiotic stars, cataclysmic vari-
ables, supernova remnants, black holes, star mergers and other objects from high-energy
astrophysics. Therefore, the correct and proper simulation of past views of the sky and of
the various sky cultures is crucial for these fields of research (see below).

© 2021 EQUINOX PUBLISHING LTD
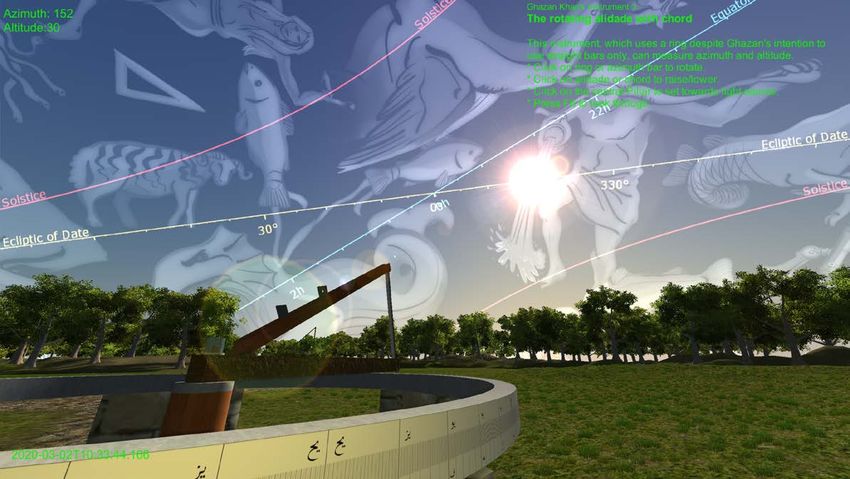
228 Georg Zotti et al.

 Virtual Archaeology
 Many archaeologists nowadays use CAD (Computer-Aided Design) or GIS (Geographical
 Information System) software to document their sites. Survey points measured in the
 field are stored in a database and can be displayed together with outlines of features
 identified during excavation or even in images created from geophysical prospection
 in digital maps. The terrain, all-important for horizon and orientation studies, is now
 surveyed with airborne laser scanning (LiDAR), from which high-resolution digital surface
 models (DSM) and digital elevation models (DEM) can be computed. For the latter,
 vegetation and built structures can be filtered out from the data quite easily, which also
 allows a detailed view even under tree canopies. These surveys at least provide data
 about present-day topography, and larger or human-made changes or the effects of
 natural slow erosion or landslides can partially be modelled backwards. Further, simple
 3D models of past architecture can be created as visualisation aids just from vertically
 extruded feature polygons. Teams which include 3D artists and architects can recreate
 whole cities from antiquity on the screen. “Game engines” – software frameworks for 3D
 computer game technology – allow the creation of lively scenes enriched with sounds,
 animated objects or creatures in virtual environments that can be explored interactively.
 To keep the displayed reconstruction in line with scientific knowledge and to separate
 scientific knowledge clearly from hypothetical reconstruction (which may also include
 reconstruction variants for discussion), standards like the London Charter (Denard 2009)
 and the Seville Principles for Virtual Archaeology (Carrillo Gea et al. 2013) have been
 established.
 Most architectural computer reconstructions of the past are shown under a daylight
 sky. Rendering can be controlled with sunlight that can be configured to any location
 in the sky. When the model’s geographic location is known to the rendering system, a
 sky module may be able to compute the Sun’s position from a calendar interface. This
 is useful for contemporary architectural simulation, to analyse the impact of a planned
 building’s shadow on its vicinity, but is frequently limited to dates close to the present
 time.
 Unfortunately, most architectural simulation systems or game engines have no built-
 in support for the current night sky and even less for that of past times: at best they
 simply show a static “skybox” with the starry night sky at some unspecified time. The
 slight variation of solstitial points or a rotating starry sky which undergoes precessional
 motion has to be created by the modelling team.
 In the last few years Stellarium has therefore been extended with unique features
 geared towards research and demonstrations in Virtual Archaeoastronomy.

 ArchaeoLines
 Stellarium’s functionalities can be extended with optional modules, called plugins. One
 of these plugins, ArchaeoLines, shows the diurnal tracks or, more accurately, the declina-
 tions of the Sun on the dates most often considered as important for archaeoastronomy:

 © 2021 EQUINOX PUBLISHING LTD
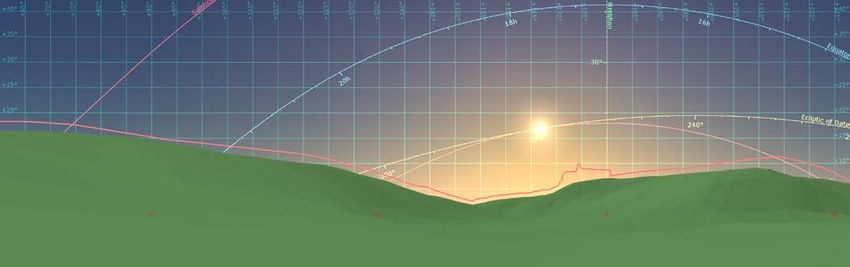
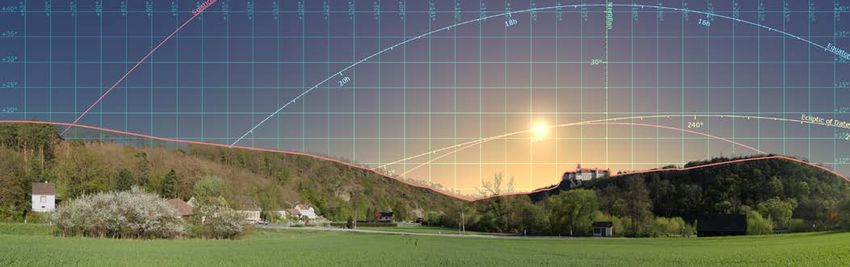
The Simulated Sky 229

the Sun’s paths at the solstices, equinoxes and the “cross-quarter” dates. These “cross-
quarter” dates still exist as alternative season markers in our calendar. If we re-define the
seasons to not begin with equinoxes and solstices, but instead to be centred on those
key dates, in terms of cultural festivals in the West spring begins on Candlemas (2nd
February), summer begins on May Day (1st May) and winter on All Saints’ Day/Samhain
(1st November). A line in the sky indicating the path of the Sun on those dates is defined
in the program by the Sun reaching the following ecliptical longitudes:
 � � 45° � � 90°, �0,1,2,3�.
 This can simplify the process of finding a correlation between architecture axes and
sunrise or sunset points in the horizon. In a similar way, the Moon exhibits extreme points
in its orbit at the declinations of major and minor standstills. These are the outermost
and innermost turning points of the monthly declination range of the Moon. The Moon
reaches its extreme declinations and outermost rising or setting points that represent the
intersection of declination arc with the visible horizon with a periodicity of about 18.6
years, whereas it passes the declination of the innermost turning points basically every
month. The displayed arcs highlight the maximum declinations the lunar centre can have
at the mathematical horizon. The arcs are actually shown twice: the Moon is so close that
the difference in distance when at apogee (farthest point from Earth’s centre) or perigee
(closest point) causes a noticeable difference in its horizontal parallax. It should also be
noted that the declination of the Moon as it transits the meridian during the major stand-
still day may exceed the displayed arc slightly, caused by the effect of diurnal parallax.
 The plugin can also show the diurnal track of the current declinations for a planet,
any selected object or arbitrary declinations and azimuths. Also, declination arcs of zenith
and nadir transit and the current azimuth and hour angle for the selected object can be
displayed. To mark the direction towards a geographical target like a sacred place, the
azimuth, or vertical arc into the direction of two such places, can also be displayed.

The Landscape Horizon
Computing rising and setting points of celestial objects along the mathematical horizon
is not difficult, but is rather pointless when we are investigating a site which does not
have a flat horizon. In the northern hemisphere, every hill or mountain visible along the
horizon shifts the apparent rising or setting azimuth of any celestial object towards the
south. An archaeoastronomical site survey must therefore crucially take care to record
the horizon altitudes into the relevant view directions (Figure 1). Stellarium can show
polygonal lines along the horizon derived from such measurements, or display horizon
images which optimally have been recorded on the spot of interest and carefully assem-
bled into panorama photographs. It is also possible to overlay the polygonal line derived
from measurement over the photo-based panorama. How to create such panoramas by
stitching photographs taken from a single point of view with the free and open-source
Hugin panorama maker (Hugin 2019) is documented in the Stellarium User Guide (Zotti
and Wolf 2020b).

© 2021 EQUINOX PUBLISHING LTD
230 Georg Zotti et al.

 b
 a

 © 2021 EQUINOX PUBLISHING LTD
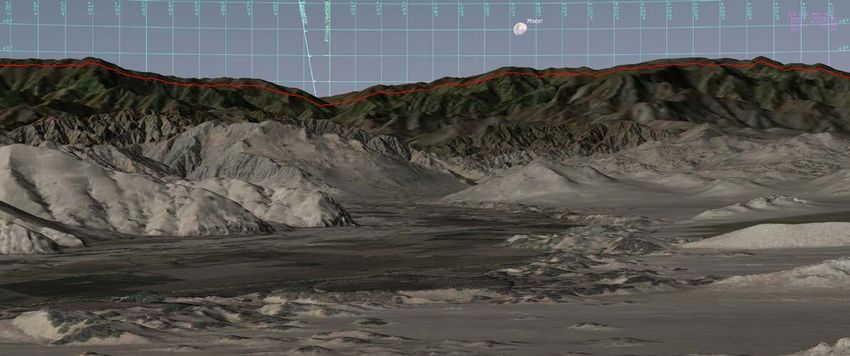
c

© 2021 EQUINOX PUBLISHING LTD
 d
 The Simulated Sky

 FIGURE 1. Comparison of artificial vs. measured horizons or “landscapes” in Stellarium for the site of the Neolithic circular enclosure near Rosenburg, Lower
 Austria. From top: (a) created by HeyWhatsThat – HoriZONE provides the same shape, but with more complete location data; (b) created with Horizon 0.13c
 from SRTM1" data; (c) created from artificial photo-like screenshots in Google Earth – note the contrast with SRTM1”, especially with the hill shape near the
 right image edge (image copyright: Google); (d) photo-based panorama created during the ASTROSIM project (Zotti and Neubauer 2015) – the polygonal line
 represents measurements with a total station, which helped adjust the panorama and was copied into solutions b and c for better comparison. The measured
 line, however, is influenced by vegetation and should be expected to show differences from the artificial solutions.
 231
232 Georg Zotti et al.

 In recent years a new kind of investigation, especially for preliminary work, has been
 established which can best be performed before actual site visits, and is based on digital
 data only. This is concerned with the application of GIS software to create the horizon
 polygon that defines the visual border between sky and ground. In addition, there are
 dedicated web services which can deliver such data based on SRTM3" (~90m) or even
 SRTM1" (~30m) digital surface models. One example is HeyWhatsThat (Kosowsky 2014),
 which also provides a gazetteer to identify the names of mountain peaks surrounding a
 site. Another dedicated web service named HoriZONE appeared recently which converts
 the HeyWhatsThat results into a polygonal landscape for Stellarium, allowing the addi-
 tion of more information such as author, description or timezone in the process (Doyle
 2019). Since summer 2020 HeyWhatsThat has provided its own direct download option
 for Stellarium landscapes (without the addition of these details). These horizon polygons
 define which parts of the sky are covered by some terrestrial feature, but do not reveal
 the distance to – or details in the appearance of – the horizon.
 A visually more appealing option to create an artificial landscape horizon has been
 presented by Andrew Smith. His program Horizon (Smith 2020) can compute a landscape
 panorama from SRTM (3" or 1") and other DSM or DEM raster formats, and optionally also
 augment it with the diurnal tracks also found in the ArchaeoLines plugin mentioned
 above. Its internal viewer reveals the distance to a location under the mouse pointer. The
 artificial rendering can also be configured to give visual hints on elevation (by colour-
 coding) and distance (by reducing colour intensity) and the program can directly export a
 fully configured landscape package (terrain panorama rendering and a polygonal horizon
 line) for Stellarium.
 Yet another option is provided by a workflow (Zotti 2013) that creates artificial pano-
 ramas from photo-like ground views in Google Earth (Google 2020). In some usually
 urban areas, the terrain is available with 3D details and even shows buildings and trees. It
 can be a valuable exercise to combine this manually with a polygonal landscape created
 by on-site measurement or one of the abovementioned methods to gain additional hints
 and insights about the appearance and quality of each method. In the optimal case,
 the polygonal line derived with one method should run along the seam between earth
 and sky visible in the picture derived with another method, unless the foreground is
 represented in higher detail.
 SRTM is known to contain some elevation errors (see, for example, Ferranti 2014 and
 links from there), and the online services may use various solutions or even their own
 improved data sets to deal with such data errors or insufficient spatial resolutions. Each
 of the digital methods should be expected to show differences, especially in close-by
 areas. While these methods in general provide good background information for a
 distant horizon (when this is not perceivably damaged by a larger data error), in the near
 surroundings of our site of interest these SRTM-based DSMs are in general not accurate
 enough to represent possibly crucial detail. (Note that a 1 m vertical error causes a
 1 arcminute lift or drop in over 3 km distance, and of course larger errors if closer.) The
 horizon line from HeyWhatsThat (Figure 1a) suffers most from lack of resolution in the
 SRTM data, which causes artificial steps that the other methods appear to interpolate.

 © 2021 EQUINOX PUBLISHING LTD
The Simulated Sky 233

There are also notable differences with respect to today’s treeline. In Figure 1d, trees were
painted semi-transparent in an area where glimpses of sky were visible through the trees,
indicating lower ground which seems to be represented well in the Google Earth-based
panorama (Figure 1c). The rendering of the Horizon program seems to be somewhat
lower, at least in the vicinity of this site, but we cannot say whether this is caused by
a difference in elevation data or by a processing error. Of note is the difference in the
topography on the right foreground hill between Horizon/SRTM1" and Google Earth,
indicating that elevation raster data used by Google Earth is different from the “official”
SRTM. Therefore, currently we cannot give a clear preference or recommendation for
one of these methods, apart from clearly stating which method and data were used. A
panorama photograph taken on the spot of interest and carefully aligned with a surveyed
horizon polygon, or at least adjusted to match the distant parts of an artificial panorama,
usually provides higher detail and should reveal which parts of the scene appear to be
important, at least when the archaeological monument in question is still at a minimum
partially visible and when horizon altitudes formed by vegetation (treelines) have not
changed significantly.
 The inclusion of horizon panoramas in celestial simulation software is a valid approach
to analysing the sky as observed from a few predefined viewpoints like temple corners,
centres, main axes, entrances or similar well-defined spots. We may identify or confirm or
disprove presupposed assumptions, but it is not easy to investigate further and address
questions such as “what happens to visibility a few steps away from that spot?” Likewise,
when we observe a potentially interesting solar alignment or shadow phenomenon
during a short site visit today, we may ask ourselves “on which other days in the year does
this phenomenon occur?” To answer these questions, we need at least three-dimensional
mobility in our virtual location.

Four-Dimensional Virtual Archaeoastronomy
The most ambitious improvement towards developing modern tools useful for virtual
archaeoastronomy was the addition of a 3D rendering plugin, Scenery3D (Zotti 2016),
which allows interactive walkthroughs of virtual landscapes. Meanwhile, the model
rendering module was even made time-aware (Zotti et al. 2018), so that georeferenced
and time-annotated (phased) site reconstructions can be combined with the simulated
skies of past millennia. The simulation always shows the astronomically correct sky over
the reconstruction of a site at the selected date, and can also simulate shadows cast by
the Sun, the Moon or even the planet Venus. Rendering of model components that do
not fit the current date can be suppressed. The user can walk around in the virtual scene
in first-person perspective with a configurable eye height above ground: if the scene is
configured properly, the survey coordinates of the virtual eye point can be seen in the
display and bookmarks can be set for interesting views. In the first-person perspective,
building axes and the effects of light and shadow governed by windows or natural caves
can be simulated in combination with what the sky would have looked like to the users
of the original sites in question, making available views that cannot be experienced today
even under the most pristine skies because the stars have shifted due to precession. For

© 2021 EQUINOX PUBLISHING LTD
234 Georg Zotti et al.

 technical reasons, non-perspective rendering modes (for example, stereographic, fish-
 eye or cylindrical views) have to be rendered on six sides of a cube and then re-projected
 into the scene, which imposes a performance bottleneck for large models.
 The rendering is suitable not only for scientific analysis, where a simple model may
 be sufficient, but is of a high quality that can also be used for architectural models geared
 towards public outreach. Small details in larger sculpted surfaces like walls decorated
 with inscriptions can be shown with normal maps, which can save computing operations.
 An average contemporaneous notebook PC can work with landscape models or models
 derived from laser scanning or image-based modelling with several millions of triangles.
 In the following examples we include performance values from one such notebook, an
 Acer Aspire V15 Nitro with Intel Core i7-6700HQ CPU, 16 GB RAM and Nvidia Geforce
 960M with 4 GB dedicated GPU RAM, produced in 2016.

 Example 1: Vienna Sterngarten
 The regular installation of Stellarium includes two 3D sceneries. One, aptly called “Test-
 Scene”, is a little example of configuration options. The other is the model used while
 several phenomenological aspects of Stellarium were being developed and cross-checked:
 the “Sterngarten” (Star Garden) is a modern skywatching platform built 1997–2001 in the
 southwestern outskirts of Vienna by the late astronomy populariser Hermann Mucke
 (1935–2019) and the Austrian Astronomical Society (Mucke 2002). This public observing
 and teaching facility includes comprehensive architectural details for astronomical naked-
 eye phenomenology, especially as regards horizontal directions (azimuths) – a subject
 frequently discussed in archaeoastronomical contexts (Figure 2). It consists of a stepped
 pyramid platform which raises the observer over the local vegetation. The ideal observer
 should then be located standing in its centre. Most adult visitors should actually crouch
 slightly to match all indicated angles perfectly: a railing 1.5 m above the platform level
 forms the mathematical horizon. Two pillars to the north and south mark the meridian and
 bear altitude marks. Three plates on the southern pillar additionally indicate solar noon
 elevations for the solstices and equinoxes. Six outlying pillars indicate the geometrical
 azimuths for sunrise and sunset at the equinoxes and solstices on the mathematical
 horizon. (The western horizon is elevated, so that the real sunset will be seen earlier and
 farther south.) Short arms extending from each pillar along the mathematical horizon
 towards the north bear a notch which indicates the apparent location where first or last
 light of the Sun can be expected when refraction is taken into account. The outliers extend
 to 6° altitude, which can be mentally inverted to 6° depression where the Sun is positioned
 at the end (evening) or beginning (morning) of civil twilight, respectively.
 The north pillar bears a disk with a hole, indicating the northern celestial pole. The
 disk itself covers the pole star to indicate that it is not exactly at the pole. To the north
 of the platform, the noon shadow of the pierced disk casts a diffuse spot of light inside
 an unsharp shadow ring onto a date scale along the local meridian. The shadow figure
 during the winter half of the year is cast onto an inclined mast, so that it is raised above
 any possible snow cover. This mast is parallel to the Earth’s axis and simultaneously forms
 a giant gnomon for a sundial. One critical date is the equinox, when the disk’s shadow

 © 2021 EQUINOX PUBLISHING LTD
The Simulated Sky 235

FIGURE 2. The “Sterngarten” modelled in Stellarium, viewed from the southwest. The real installation is
surrounded by shrubs of a “suburban wilderness”. In this display, the small terrain clip is surrounded by the
“zero horizon” landscape, which only covers the ground below the mathematical horizon in green. The eye
height in this view is configured to be 1.5 m above the platform centre, so that the railing and the side arms
which extend from the outlying pillars are aligned with it.

falls on the foot point of the inclined mast. Figure 3 shows a simulation for this date,
compared to a photograph. The shadow can be rendered unsharp by several methods
found in the computer graphics literature. The most ambitious of those, PCSS (Fernando
2005), blurs shadows as a function of the distance from the shadow caster, allowing a
fairly good simulation of the distance-dependent vanishing saliency of shadows cast by
thin objects.
 The model was created on a small flat piece of terrain and a static landscape was
exported before the 3D module was available to allow development and testing, and
later demonstration of the effects of atmospheric refraction. Most other models should

a b

FIGURE 3. The meridian transit of the shadow figure of the disk on top of the central pillar marks local noon
and the date. On equinox days, it transits at the foot of the inclined mast: (a) photograph taken by G. Zotti
on 20th March, 2010; (b) faithful Stellarium representation of the solar shadow’s blurred appearance,
created by using the PCSS algorithm.

© 2021 EQUINOX PUBLISHING LTD
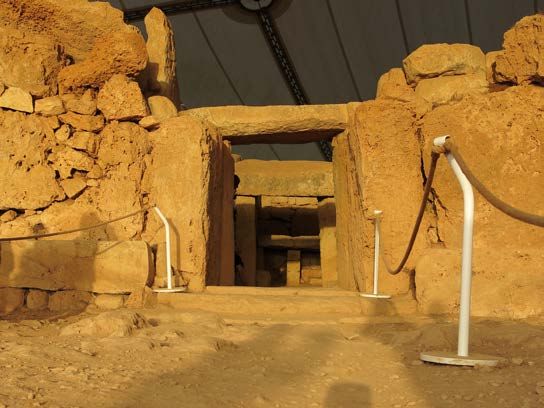
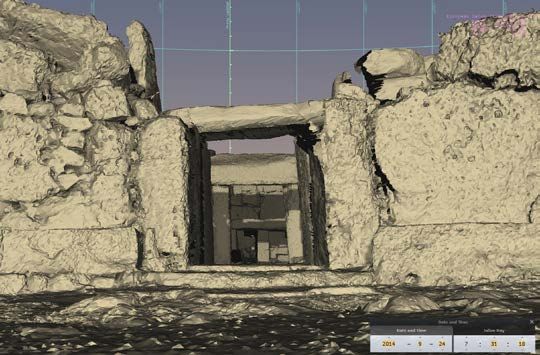
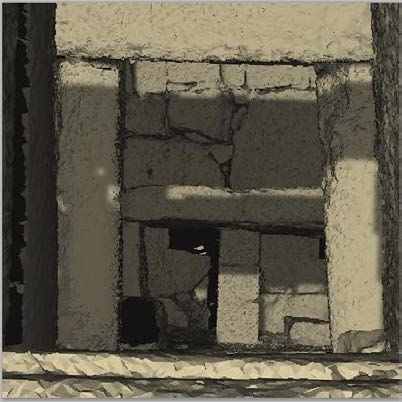
236 Georg Zotti et al.

 include more of the surrounding terrain and also a landscape panorama which should
 model the parts of the horizon which do not change perceivably when the observer
 moves within the central region of interest.
 The Scenery3D plugin is slowly gaining attention, but while astronomical research
 data can usually be found online shortly after collection, high-resolution geodata, and
 more importantly archaeological and cultural heritage data, usually cannot just be down-
 loaded, reconfigured and re-published in a different research context for free, but are
 stored away in the archives of its creators or their customers, or shown online in a format
 or with restrictive licensing that prevents download or further use. After the ASTROSIM
 project (Zotti and Neubauer 2012) and the study of the “Antinoeion” in Hadrian’s Villa at
 Tivoli (Frischer et al. 2016), the first author (GZ) was asked for assistance in further projects
 which were welcome as stress tests with real-world data.

 Example 2: Mnajdra Temple
 The prehistoric temples of Malta have been described extensively in the archaeoas-
 tronomical literature (see for example, Hoskin 2001; Ventura and Hoskin 2015). For an
 ongoing study (Lomsdalen 2014), laser scans of the Mnajdra temples, created before it
 was tented over to protect it from the elements, were provided by Heritage Malta, and
 aerial photography and laser scanning (LiDAR) data (digital elevation model, or DEM) by
 the Malta Planning Authority. Terrain analysis in ArcGIS 10.4 (Esri 2020) helped identify
 which part of the island was visible from the surroundings of the temple and therefore
 had to be included in the 3D model (Zotti 2019). From this part of the raster DEM a textur-
 ised triangulated irregular network (TIN) or “3D mesh” was created in ArcGIS 10.4 and
 exported with bespoke conversion tools into the widespread “Wavefront OBJ” format
 used by Stellarium’s 3D rendering module. For technical reasons the vertex coordinates
 of the model cannot represent full UTM coordinate values (Universal Transverse Mercator,
 the currently most widespread survey coordinate system – Snyder 1987, 57–64), but must
 be shifted into a numerical domain appropriate for single-precision floating point arith-
 metic. The offset to the original UTM coordinates is stored in the scene configuration file.
 The temple scans were converted from their obsolescent native data format and
 combined with the DEM mesh in the free and open-source 3D modelling program
 Blender (Blender 2020) into a single OBJ file which, together with the terrain model,
 consists of more than 10 million triangles which can be displayed at more than six frames
 per second in perspective rendering mode. However, the memory requirements for more
 than 1000 photo-based textures were too much for the laptop used for the test (the Acer
 Aspire V15 Nitro described above) and prevented shadow simulation, so a model with
 a monochromatic stone colour was created. The loss in visual quality – in this case of a
 limestone monument – should be bearable.
 The user can move freely in this model and explore all rooms and cavities that were
 recorded by the laser scanning. We made no further attempt to clean up the scans or
 simplify the geometry, as further evaluation of this model is not our task. The question
 for us at this time was mostly as follows: how well does virtual archaeoastronomy with
 Stellarium work, and how large (in terms of model detail) can a model be handled and

 © 2021 EQUINOX PUBLISHING LTD
The Simulated Sky 237

still remain useful? We cannot observe the sky of Malta’s prehistory, and therefore we had
to reformulate the question: how accurate is astronomical simulation of a highly detailed
3D model with Stellarium? This requires, of course, comparison with data taken during
a site visit. This model was tested against photographs taken during an early-morning
visit which formed an excursion highlight of the 2014 European Society for Astronomy
in Culture conference (SEAC 2014). The first rays of the rising equinox Sun, when it rises
over a little ridge east of the temple, enter the central axis of the southern temple (Figure
4, with central sections enlarged in Figure 5).

 a

 b

FIGURE 4. Sunrise in the southern temple of Mnajdra: (top) photograph taken on 24th September, 2014,
by G. Zotti during the SEAC conference in Malta; (bottom) the same scene simulated at the same second
of time in Stellarium 0.20.1. Compare the shadows cast along the stones into the inner sanctuary. Some
differences stem from scanning errors (missing surfaces). Laser scan data courtesy of Heritage Malta.

© 2021 EQUINOX PUBLISHING LTD
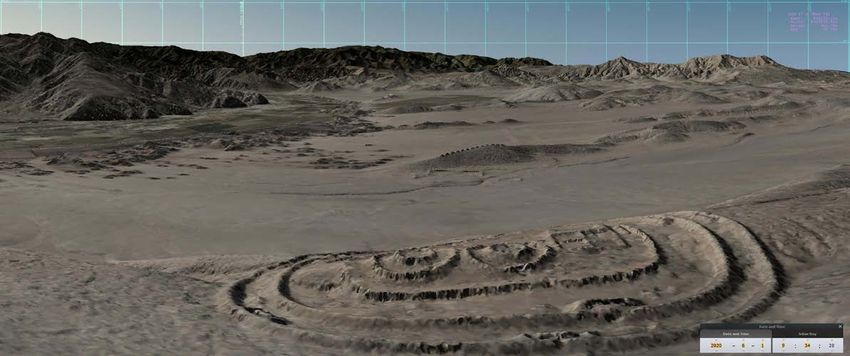
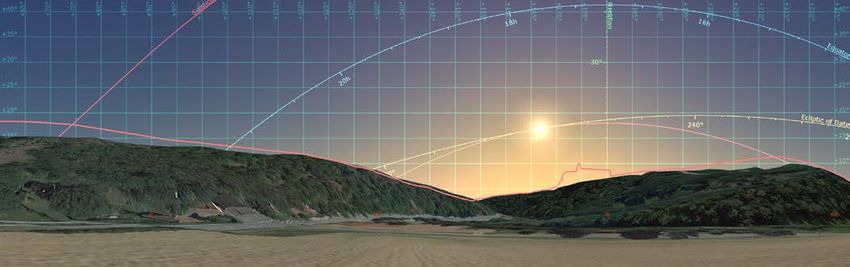
238 Georg Zotti et al.

 a b

 FIGURE 5. Enlarged central section of (a) the photograph and (b) the rendering from Figure 4. Some
 spots of light on the left vertical stone pillar are caused by data errors (holes) in the laser scan model. The
 placement of other shadows appears correct.

 There are still noticeable differences in the scene appearance. However, most seem to
 relate to a slight lack of geometric resolution or missing geometry in the scan data, which
 leads to holes in the displayed walls which may then also cast wrong spots of light into
 shadowed areas. The natural Sun was dimmed by slight fog, so that the shadow contour
 of the ridge immediately at sunrise was not clearly discernible on the ground. Of course,
 the Sun’s appearance as a disk means that the natural shadow does not have a sharp
 edge. In the simulation, we have tried several methods to soften or blur the hard shadow
 edges depending on distance to the geometry edge that casts the shadow, but some
 blocky appearance of the shadow edges can hardly be avoided for larger landscapes,
 due to technical restrictions of the shadow map texture size. Despite this, the light and
 shadow edges when the Sun finally cast discernible shadows into the temple are very
 closely simulated in the Scenery3D plugin (Figure 5). From this we gain confidence that
 the simulation should give similarly accurate results for light and shadow interaction for
 other dates, including Malta’s temple era.

 Example 3: Chankillo
 The archaeological landscape of Chankillo, south of the Casma River near the coast of
 Peru, is a spectacular site dominated by two monumental structures (Ghezzi and Ruggles
 2007; 2015). Observed from a particular corner in the remains of a building structure in
 the valley, 13 towers built along a ridge seem to mark the range of declinations which
 the rising Sun can reach during the year. To the west, a “fortified temple” overlooking
 the valley shows a very peculiar architecture of straight and circular walls. Site visits are
 costly, many viewpoints may have to be visited at the same time or over the course of
 the year to observe sunrises and sunsets, and the extended site, now mostly covered in

 © 2021 EQUINOX PUBLISHING LTD
The Simulated Sky 239

sand, may even be too fragile to be explored by motorised vehicles. As such, the ques-
tion was whether a 3D model could be used to explore the landscape in a walkthrough
or low flyover mode to allow a simple illustration of the known interpretation and an
investigation of further ideas around the archaeoastronomical concepts to be found in
the landscape.
 The immediate area around the 13 towers and the fortified temple has been recorded
by aerial photography and LiDAR with a 1 m raster grid width, from which again a
textured TIN was created in ArcGIS 10.4 and converted into the required georeferenced
OBJ format. However, the mountains which form the eastern and northern horizon were
not included. The SRTM 1" digital surface model (DSM) with its 1 arcsecond grid spacing
(which is approximately equal to a 30 m grid spacing in the north–south direction; the
actual east–west grid spacing depends on latitude) was used to compute a 3D mesh of
terrain data where vertical accuracy and detail are not as important as in the near vicinity.
However, high mountains may be visible to distances of almost 100 km and a fine-
meshed TIN would easily become too large for the average PC. Given the need to include
only higher parts of the mountains but not having details of valleys hidden by closer
mountains which form the visible horizon, we created in the GIS an “area viewshed”, an
estimate of the terrain visible from any point in the central area of interest, and only then
created the TIN from this visible part of the landscape. This reduced the triangle count
significantly, but of course also limited the scope of the model, so that it could be viewed
only from the valley area around the 13 towers, from the area of the fortified temple and
not too high above ground. Even so, the highest-resolution model consisted of over 14
million triangles. The 2016 notebook PC can display this model including shadow simula-
tion with over 10 frames per second (fps) on a wide 3440 × 1440 display in perspective
mode. Using other projections, such as fisheye or cylindrical, again requires rendering the
model on six sides of a foreground “cubemap” which is then re-projected into the scene,
which in this case dropped the frame rate to below 3 fps while moving. This is too slow to
be used comfortably interactively, but it can still be used for illustrations like those shown
in Figures 6 and 7. With a setting of “lazy cubemap re-rendering” we can however look
around with a higher frame rate from a fixed point, because the foreground needs only
to be re-created when we are moving, or when the illumination changes. For even more
detail, laser scans or image-based models of the temples and towers could still be added
to the scenery, but this may require a more powerful graphics card with more memory
than that in the laptop used here.
 The very large extent of this model, however, shows a noteworthy limitation currently
present in the landscape modelling’s original intent (Zotti and Neubauer 2012), which
is that it was intended to visualise a small piece of terrain with some archaeological or
architectural artefact to be investigated in three dimensions, surrounded by a static
representation (photographic, surveyed or artificial rendering) of the far-away mountains
that does not perceivably shift when the observer moves around the site by a few metres.
The central 3D scenery is currently modelled in Cartesian coordinates on a plane tangen-
tial to the Earth’s surface and slightly rotated at loading time around the vertical axis to
compensate for the local deviation of the survey grid axes (usually UTM) from the cardinal

© 2021 EQUINOX PUBLISHING LTD
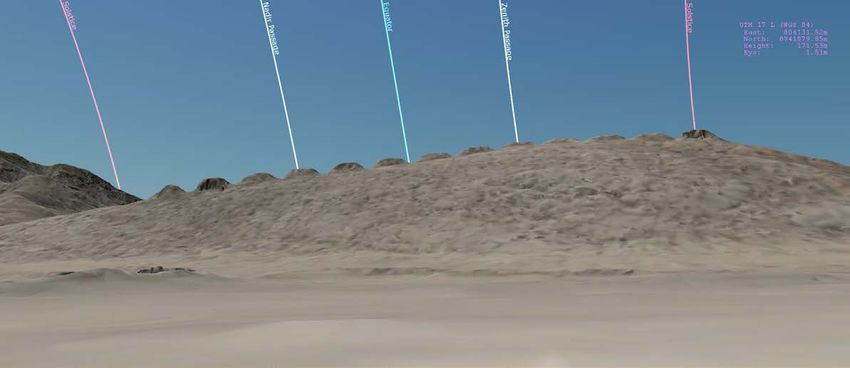
240

© 2021 EQUINOX PUBLISHING LTD
 Georg Zotti et al.

 FIGURE 6. A simulated low-altitude aerial view overlooking the Chankillo 3D landscape model in Stellarium. The “fortified temple” is in the foreground,
 while the ridge with 13 towers and the “observation building” in front are visible in the valley below. The user can explore the whole archaeological area
 and inspect or discover new viewpoints of archaeoastronomical interest. The scene includes mountains almost 70 km to the east (LiDAR data courtesy Iván
 Ghezzi and Clive Ruggles).
© 2021 EQUINOX PUBLISHING LTD
 The Simulated Sky

 FIGURE 7. A Stellarium view from the “Western Observing Point” over the 13 towers in Chankillo visible in the LiDAR data, closely matching Figure 62.7a
 in Ghezzi and Ruggles (2015). The ArchaeoLines plugin is used to display diurnal tracks of the Sun at the solstices, celestial equator and zenith/nadir
 (antizenith) declinations in 300 BC. The leftmost tower has been smoothed in the LiDAR data and is somewhat higher in reality.
 241
242

© 2021 EQUINOX PUBLISHING LTD
 Georg Zotti et al.

 FIGURE 8. A close-up view towards the eastern horizon from the “Temple of the Pillars” in the Lidar-based 3D scenery of Chankillo. The red polygonal line
 was created from the same location with Horizon version 0.13c and is plotted over the model for clarity. The rising Moon and azimuthal grid (width 1°) are
 shown for comparison. This example shows an extreme case to illustrate the effect of not taking Earth’s curvature into account. Distant mountains should
 preferably be included using a panorama that can be created with Horizon or actual survey data.
The Simulated Sky 243

directions caused by meridian convergence (Zotti 2015). It therefore does not correct the
scene for the Earth’s curvature. In the case of this site, the farthest mountains seen from
the “fortified temple” are somewhat short of 100 km to the north and 70 km to the east.
We can estimate the error that results from planar modelling: for an observer at sea-level
on the curved Earth, a mountain peak 1000 m high sinks below the mathematical horizon
at a distance of about 113 km. In the planar model, this mountain in the same distance
appears to be about 0.51°, or about a full solar diameter, high. In addition, the local azimuth
of the horizontal axis in UTM coordinates deviates from the east–west direction depending
on geographical latitude and distance from the UTM zone’s central meridian. This means
that azimuths of far mountain peaks seen in the planar model also deviate slightly.
 Another effect which counteracts the apparent depression of mountains is caused
by the Earth’s atmosphere, where terrestrial refraction can raise far-away mountains by
several arcminutes, or more under exceptional atmospheric conditions. These effects are
currently not modelled.
 For comparison, the above-mentioned program Horizon (Smith 2020) was used to
create a horizon panorama and polygon (from the same SRTM 1" data) as seen from the
“Temple of the Pillars” (the right rectangular structure visible in Figure 6) in the fortified
temple complex. The red horizon polygon created by the Horizon program is drawn after
the 3D scenery to show where the “true” landscape horizon (actually, also only a digital
approximation, but one that claims to correct for curvature!) should be visible when
correcting for curvature (Figure 8). For distant mountains like in this example, the static
panorama corrected for the Earth’s curvature is clearly more accurate and this deviation
should definitely not be neglected, but the impact on any proposition resulting from
studying the virtual landscape in combination with celestial targets depends on the use
case.

Limitations
The considerable size allowed for the OBJ 3D models in Stellarium invites the creation
of large terrain models. As shown in the Chankillo example this approach has limitations
caused by not modelling the curvature of Earth. Therefore, the recommended approach
is to use a site of limited extent which is locally modelled in 3D and enclosed by a classical
horizon panorama that should provide a representation of mountains far enough away
so that their location does not shift perceivably when the observer moves inside the
limited area of the site in question.

Game-Like Interaction
Another limitation of the 3D rendering module when compared to the typical user
experience in today’s first-person perspective 3D computer games is the static nature
of the scene and lack of interaction possibilities with scene objects. The 3D plugin was
developed strictly for the purpose of representing architectural and geological features,
whereas in a computer game plants may move in the wind, animals or virtual characters
controlled by algorithms or other simulation participants may move around and the

© 2021 EQUINOX PUBLISHING LTD
You can also read