The Suez Canal after the expansion Analysis of the traffic, competitiveness indicators, the challenges of the BRI and the role of the Free Zone - SRM
←
→
Page content transcription
If your browser does not render page correctly, please read the page content below
The Suez Canal after the expansion
Analysis of the traffic, competitiveness indicators,
the challenges of the BRI and the role of the Free Zone

                                                       2018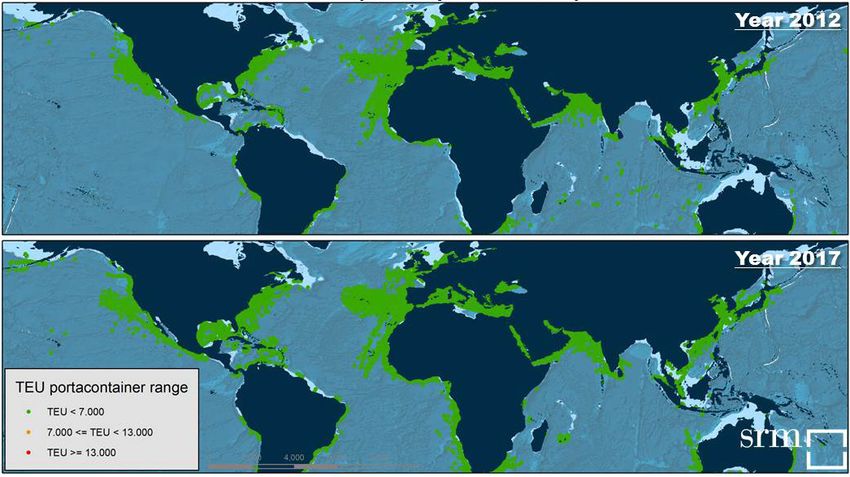
“The Suez Canal after the expansion. Analysis of the traffic, competitiveness indicators,
the challenges of the BRI and the role of the Free Zone”
is a research carried out by SRM and AlexBank within
the Permanent Observatory on Maritime Transports and Logistics
www.srm-maritimeconomy.com

RESEARCH TEAM

Directors of the Research:
Massimo DEANDREIS, General Manager SRM
Dante CAMPIONI, CEO AlexBank

Coordinators:
Alessandro PANARO (SRM)
Mohamed RAEF (AlexBank)

Researchers:
Anna Arianna BUONFANTI (SRM)
Luca FORTE (SRM)
Samer HALIM (AlexBank)
Dario RUGGIERO (SRM)

Editorial & Graphic design:
Marina RIPOLI

Publication based on data information available at October 2018.

The analyses contained in this extract do not commit or represent in any way the views and opinions of
the founding and ordinary partners of SRM. The paper is solely for illustrative and informative ends, and
cannot be intended in any way as an opinion, an investment suggestion, or as expressing judgment on
the companies or persons mentioned. Any form of distribution or fruition and the faithful reproduction
of this text, even partial, cannot be carried out without the authorization of SRM.
The illustrations and visualisation data present in this paper should be considered as images and not as
maps, therefore the equivalence of areas and borders, for instance, is not respected.
The use of this report and of the information herein contained is only allowed for the purpose of studying
and researching the industry and shall be carried out quoting the source.

2                                                            www.srm-maritimeconomy.com
TABLE OF CONTENTS

Executive Summary      4

Canal’s traffic trends after the Suez Canal expansion   6

International performance indexes: Egypt ranking and
its maritime and logistics connection   19

The Belt & Road Initiative and the Role of
the Mediterranean countries     28

Suez Canal Economic Zone      39

Bibliography    48

www.srm-maritimeconomy.com                                  3
EXECUTIVE SUMMARY
    Traffic through Suez is growing both in terms of number of ships and tons of goods.

    Containerships are the most numerous vessels that made full transits through the Suez
    Canal (5,568 on the total of 17,550). Thanks to the enlargement, in 2017 the average size
    of transiting containerships grew by 21% on 2014 (year before the enlargement).

    Transiting goods traffic amounted to 909 million tons, registering a record growth equal
    to 10.9% on 2016. Southbound goods amounted to 478 million tons, increasing by 19.3%,
    while Northbound goods were 431 million tons (+2.9%).

    The Suez Canal, together with the 200-mile long SUMED Pipeline, are the 3rd transit rou-
    te in the world for crude oil and refined products with 5.5 million b/d (barrels per day).
    These two routes combined accounted for about 9% of the world’s seaborne oil trade.

    LNG flows through the Suez Canal in both directions were 1.2 trillion cubic feet (Tcf)
    amounting to 9% of total worldwide LNG trade.

    Egypt’s Shipping connectivity is on the growth, especially after the Suez Canal expansion.
    Some improvement in logistics is expected.

    Based on the LSCI (Liner Shipping Connectivity Index), Egypt has a good transport connecti-
    vity. In 2018, with an index of 70.3, Egypt ranked 18th in the world (China holds the 1st posi-
    tion), 3rd among the MENA countries and 2nd among South Mediterranean countries.

    In 2004 (first available year) Egypt’s LSCI was 42.9. It increased significantly after 2015
    (Suez Canal expansion), from 61.5 to 70.3. The linear trend shows 1.5 points more every
    year in Egypt’s LSCI.

    Based on the LSBCI (Liner Shipping Bilateral Connectivity Index), Egypt has the best mari-
    time connections with Italy, Spain, France, China and Malaysia. Among MENA countries,
    Turkey is the one with which Egypt has the highest LSBCI.

4                                                         www.srm-maritimeconomy.com
In 2018, Egypt placed 67th in the LPI global ranking and 9th among the other MENA coun- tries. The World Bank’s Survey, LPI domestic index, shows that Egypt’s operators, in general, have a good assessment as for ports and airports infrastructure and services, while their quality perception is lower for road and rail. 113 countries are somehow involved in the Chinese Belt & Road Initiative (BRI), almost 50 more than the countries that were originally part of the project. As of September 2017 China had already signed cooperation agreements with 74 countries. The amount of fi- nancial resources devoted to the project are expected to reach $ 8,000 billion over the entire investment period. North Africa as a pivotal area in the framework of the BRI: North African countries can serve: a) as a production area for European markets; b) as a logistic gate for both Europe and sub-Saharan Africa; c) as an energy hub for oil, gas and renewable energies. In the competition among North African countries to attract Chinese investments, each country should take advantage of: 1) the strategic geographic position; 2) a friendly bu- siness climate; 3) political stability. Egypt in north-east Africa and Morocco in the nor- th-west are one step ahead in this competition. Energy is a target sector for Chinese investment within the BRI. China is thirsty for ener- gy: in the forecast to 2040 Chinese oil imports are expected to grow to 12.4 mb/d (million barrel per day) from 7.5 in 2016, while LNG imports will quadruple. Although decreasing, the share on MENA countries on Chinese oil imports is still high: 65%. www.srm-maritimeconomy.com 5
Canal’s traffic trends after the
Suez Canal expansion
This focus analyzes the impact of the New Suez Canal on the shipping in the Mediterranean. As
a matter of fact, after the enlargement, traffic through the Canal has increased in double figures.
This part will analyze the ships and cargo traffic by type (containers, dry and liquid bulk, etc). The
most significant routes of international traffic of ships passing through the Canal and the number
of ships with tonnage will be analyzed to highlight the phenomenon of “gigantism”.
The new Geo-maps of SRM will also be used to track the new long-haul routes of Megaships by
origin and destination.

Foreword. The Suez Canal: features and traffic capacity
The Suez Canal is an artificial sea-level waterway running north to south across the Isthmus of
Suez in Egypt to connect the Mediterranean Sea and the Red Sea.
It was built in 1869 and was 164 km long, 8 mt deep, 53 mt wide and it allowed the transit of ships
with 6.7 mt of draught. In 2015 some parts of the Canal were enlarged and today it is 193.30 Km
long, 24 mt deep and 205/225 mt wide. The completion of this enlargement allows the transit of
ships with 20.12 mt of draught. Transit time is about 15 hours. In 2014, before the enlargement,
the daily average of transits was 46,98 ships and transiting net tonnage was 2,637.7 thousand
tons. In 2017 the daily average of transits increased to 48.08 ships and that of net tonnage went
up to 2,853.6 thousand tons.
The figure below shows traffic trend of the Canal since 2011:

Ships and cargo through the Suez Canal. Trend 2011-2017
                                                                                                17.6
                            18    17.8                          17.1            17.5   16.8            1000
                                         17.2    16.6
                            17                                                                 908.6   900
                                                                822.3          822.9   819.2           800
                            16           739.9   754.5                                                 700
 Vessel Number (thousand)

                                 691.8
                            15                                                                         600
                            14                                                                         500
                                                                                                              Cargo ton (mln)

                            13                                                                         400
                                                                                                       300
                            12
                                                                                                       200
                            11                                                                         100
                            10                                                                         0
                                  2011   2012    2013           2014            2015   2016    2017

                                                   Vessel (number)      Cargo ton

Figure 1 - Source: SRM on Suez Canal Authority (SCA)

6                                                                             www.srm-maritimeconomy.com
Ships traffic evolution
In 2017, 17,550 ships made full transits through the Suez Canal in two directions, recording an
increase of 4.3% on 2016. Transiting net tonnage was 1,041 million, recording an increase of 6.9%.
The figure below shows that containerships are the most numerous (5,568) vessels with a 32%
share and they are followed by tankers (4,537) with 26% and bulk carriers (3,288) covering 19%
of the total.
Traffic by ship type (number)
7000
6000
5000
4000
3000
2000
1000
0
Container ships Tankers Bulk carriers General cargo Car carrier LNG Ships Ro-Ro Others
2014 2015 2016 2017
Figure 2 - Source: SRM on SCA
The ratio between net tonnage of transiting ships and number of vessels by type shows that the
biggest ships passing through the Canal are containerships (average size 105.74 thousand net
ton), followed by LNG. It is also interesting to notice the comparison that this figure makes with
the year preceding the enlargement. Thanks to this improvement, the size of transiting container-
ships has grown following the trend of naval gigantism, which is increasingly gaining importance
in the containership sector.
www.srm-maritimeconomy.com 7Average net ton by ship type. Comparison 2014-2017
105.74
Container ships +21%
105.73
LNG Ships -3%
62.92
Car carrier +6%
41.46
Tankers +3%
34.62
Bulk carriers -2%
24.1
Ro-Ro -14%
10.43
General cargo -11%
0 20 40 60 80 100 120
Thousand net tonnage
2017 2014
Figure 3 - Source: SRM on SCA
This statistical data is also confirmed by some elaborations made by SRM using innovative geo-sur-
veys of the positioning of the ships.
Containerships – daily movement report (>13,000 TEUs)
Figure 4 - Source: SRM
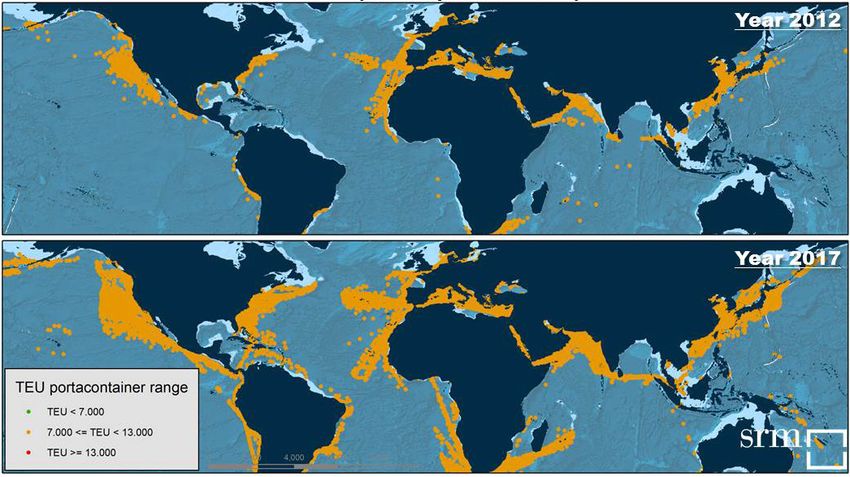
8 www.srm-maritimeconomy.comSince 2012, these maps show that: a) the presence in the Mediterranean of containerships over 13,000 TEU has increased by 37%, b) the number of vessels between 7,000 and 13,000 TEU has grown by 51.6% and c) ships in the 3,000- 7,000 TEU size have decreased by 18.7%. Containerships – daily movement report (7,000-13,000 TEUs) Figure 5 - Source: SRM Containerships – daily movement report (3,000-7,000 TEUs) Figure 6 - Source: SRM www.srm-maritimeconomy.com 9
Cargo traffic
Transiting goods traffic in 2017 was 909 million tons registering a record growth equal to 10.9%
on 2016.
Southbound goods amounted to 478 million tons, increasing by 19.3%, while Northbound goods
were 431 million tons (+2.9%). The most important areas in terms of goods traffic north of the
Canal were: a) “North, West Europe & UK” with a 25.5 % share of the total goods transits via Suez
Canal and b) “East, S.E. Med” with a 20.5% share; the main destinations south of the Canal were
“South East Asia” (31.1 %) and the Arabian Gulf (27.6 %)1. The following figure represent an analy-
sis of the destination of goods transiting through the Canal and show an increase in the period
2001-2017 in both directions: Southbound and Northbound.

2001-2017 growth of Southbound cargo traffic through Suez by markets of origin and destination

                                                                                     SUEZ CANAL    ORIGIN     DESTINATION

        NORTH WEST
        EUROPE, U.K.                                                             2017
                            +139%                BLACK SEA                       Cargo: 910 mln tonnes (10.9%)
                      NORTH MED                                                  Ships number: 17,550 (+4.3%)
                                                              +228%
                                                                                 Net ton (1,000,000): 1,042 (+6.9%)
        +96%

                                                                                                    SOUTH EAST ASIA

                                                 RED SEA                            ARABIAN GULF

                                                   +148%                                +431%                   +73%

     477.9
    mln tons

                                                                                                              MARKET
               22%              18%             16%                      44%                                  SHARE
                                                                                                               (origin)

    North West Europe, UK   Black Sea   North Mediterranean             others

Figure 7 - Source: SRM on SCA

1
 In this regard, it is appropriate to specify that according to the opinion of Assoporti - the Italian port Association - the
Suez Canal Authority’s data related to the regions of origin and destination of goods transiting through Suez have been
elaborated considering only the origin/destination places of the goods just before and after crossing the Canal.
Giannotti O., Giordano A. (Assoporti), Il Mar Mediterraneo. Scenari geo strategici della portualità italiana nel quadrante
Mediterraneo-Mar Nero, July 2018.

10                                                                       www.srm-maritimeconomy.com
The figure above illustrates the significant increase in goods destined for the Gulf (+431%) and
coming from the Black Sea (228%). In terms of volumes, 41% of the Southbound cargo (in 2017)
is from the Mediterranean ports, a share that grows to 59% if the Black Sea is also taken into ac-
count.
2001-2017 growth of Northbound cargo traffic through Suez by markets of origin and destination
SUEZ CANAL ORIGIN DESTINATION
NORTH WEST
EUROPE, U.K.
NORTH MED
SOUTH EAST MED
+16% +171%
+544%
SOUTH EAST ASIA
RED SEA ARABIAN GULF
+340% +200% +61%
431
mln tons
MARKET
35% 34% 12% 17% SHARE
(origin)
South East Asia Arabian Gulf Red Sea others
Figure 8 - Source: SRM on SCA
Northbound cargo showed a significant growth too, in particular towards the South East Med
(+544%) and from the Red Sea (+340%). In terms of volumes, Mediterranean ports received 57%
of the Northbound cargo in 2017, a figure that goes up to 57.7% if Black Sea ports are taken
into account. As for the type of goods in transit, containerized cargo and Oil & Products account
for 76.1% of the total: these categories recorded an increase of +7.1% and +17.7% respectively
compared to 2016. In particular, crude oil recorded a growth of 16.1%. The third type of goods
transported through the Suez Canal are cereals and they have also set a new historical peak of 48
million tons, with an increase of 2.5% on 2016.
The figure below illustrates the volume and shares of goods transited in both directions during
2017.
www.srm-maritimeconomy.com 11Suez Canal traffic by cargo type (million tons) in 2017
Fabricated Metals Others
21 118
2% 13%
Ores & Metals Oil & Products
30 220
4% 24%
Cereals
48
5%
Containerized cargo
471
52%
Figure 9 - Source: SRM on SCA
The Suez Canal is therefore an important transit route for crude oil and derived products, together
with the 200-mile long SUMED Pipeline, or Suez-Mediterranean Pipeline, that transports crude
oil through Egypt from the Red Sea to the Mediterranean Sea. Based on the latest U.S. Energy In-
formation Administration data, total oil flows via SUMED and the Suez Canal were 5.5 million b/d
(barrels per day) in 2016, 100,000 b/d more than in 2015.
The Suez Canal and the SUMED Pipeline are therefore the 3rd transit route in the world for crude
oil and refined products.
Volume of crude oil and petroleum liquids transported through world chokepoints, 2011-2016
(million barrels per day)
Location 2011 2012 2013 2014 2015 2016
Strait of Hormuz 17 16.8 16.6 16.9 17 18.5
Strait of Malacca 14.5 15.1 15.4 15.5 15.5 16
Suez Canal and SUMED Pipeline 3.8 4.5 4.6 5.2 5.4 5.5
Bab el-Mandeb 3.3 3.6 3.8 4.3 4.7 4.8
Danish Straits 3 3.3 3.1 3 3.2 3.2
Turkish Straits 2.9 2.7 2.6 2.6 2.4 2.4
Panama Canal 0.8 0.8 0.8 0.9 1 0.9
Cape of Good Hope 4.7 5.4 5.1 4.9 5.1 5.8
World maritime oil trade 55.5 56.4 56.5 56.4 58.9 na
World total oil supply 88.8 90.8 91.3 93.8 96.7 97.2
Table 1 - Source: SRM on EIA, 2017
12 www.srm-maritimeconomy.comThe Suez Canal and the SUMED pipeline are strategic routes for Gulf oil and natural gas shipments
to Europe and North America. These two routes combined accounted for about 9% of the world’s
seaborne oil trade.
In 2017, crude oil and refined products and LNG accounted for 24% and 3% of total Suez cargoes,
measured by net metric tonnage, respectively. The 2015 enlargement of the Canal allows more
than 60% of all tankers to transit the Canal.
In 2017 Oil & Products (crude oil and refined products) Northbound flows increased by 2.3% to
117.4 million tons, and Southbound grew by 42.3% to 102.7 million tons. Also, increased refined
products exports from Russia to Asia contributed to higher Southbound traffic.
Oil exports from Russia accounted in fact for the largest share (23%) of Suez Canal Southbound
oil flows, followed by Netherlands (13%) and Turkey (10%). The largest importers of Suez South-
bound oil flows were Asian countries, with Singapore, China and India accounting for more than
58% of the total.
Oil exports from Gulf countries (Iran, Iraq, Saudi Arabia, United Arab Emirates, Kuwait, Qatar,
Oman) accounted for 86% of Suez Canal Northbound oil flows. The largest importers of North-
bound oil flows through the Suez Canal in 2017 were European countries (62%) and the United
States (9%).
The figure below shows that after a few years of stability in oil shipments, in 2017 total traffic
through the Canal increased significantly (+18%). This reflects increases in OPEC production and
exports, including Iraq and Saudi Arabia, as well as the growth in exports from Iran following the
lifting of sanctions.
“Oil & Products” traffic through the Suez Canal (000 tons). Trend 2013-2017
220,183
2017
187,047
183,004
178,876
2016
2015
2014
Figure 10 - Source: SRM SRM on SCA, 2018
www.srm-maritimeconomy.com 13Suez Canal and SUMED pipeline flows of oil and liquefied natural gas (LNG) 2011-16
(million barrels per day)
2011 2012 2013 2014 2015 2016
Total oil flows via the Suez Canal
3.8 4.5 4.6 5.2 5.4 5.5
and SUMED pipeline
Suez Canal total flows:
crude oil 0.7 1.4 1.5 1.8 1.6 1.8
refined products 1.4 1.6 1.7 2 2.2 2
Total oil 2.2 2.9 3.2 3.7 3.8 3.9
LNG (Tcf per year) 2.1 1.5 1.2 1.2 1.3 1.2
SUMED pipeline crude oil flows 1.7 1.5 1.5 1.5 1.6 1.6
Table 2 - Source: SRM on EIA, 2017
LNG flows through the Suez Canal in both directions were 1.2 trillion cubic feet (Tcf) in 2016, ac-
counting for about 9% of total LNG traded worldwide. Southbound LNG transit mostly originates
in Nigeria, France (as re-exports), and Trinidad and Tobago, mostly destined for Egypt, Jordan, and
Japan, which combined account for more than 65% of the total southbound LNG imports throu-
gh the canal. Nearly all of the Northbound transit (99%) is from Qatar and is mainly destined for
European markets. The rapid growth in LNG flows through the Suez Canal after 2008 explains the
expansion of LNG exports from Qatar.
LNG flows through the Suez Canal in both directions have declined from their peak of almost 2.1
Tcf in 2011. The decrease mostly reflects the fall in Northbound LNG flows and is consistent with
LNG import data for the United States, which show that total LNG imports fell dramatically betwe-
en 2011 and 2016. U.S. LNG imports from Qatar fell from 91 billion cubic feet in 2011 to zero in
2014 and have remained at this level since then. The changes reflect growing domestic natural
gas production in the United States, a decrease in LNG demand in some European countries, and
strong competition for LNG in the global market. As a result, Suez LNG flows amounted to 9% of
total worldwide LNG trade in 2016, a figure that shows a dramatic fall compared to the 2011 share
(18%).
14 www.srm-maritimeconomy.comThe economic effects of the Suez Canal traffic on maritime trade
in the Mediterranean sea and in Italy
This focus analyzes the policies implemented by the Suez Canal Authority to attract traffic
and the impact these have on the shipping sector in the Mediterranean area and in Italy.
The marketing pricing policies adopted by the Suez Canal Authority: key implications
The Suez Canal Authority is adopting a flexible marketing policy and offering toll rebates to
meet the wish of shipowners and operators using the Suez Canal and to encourage more
ships to transit it.
Their rationale for tolls is based on the following:
1. Considering the earning capacity of the transiting vessel.
2. Comparing the ship cost through the Suez Canal route with other alternative routes.
3. Enlarging the number of potential canal transit beneficiaries as a step to increase the
canal revenues.
4. Giving due consideration to market condition and economic variants.
5. Considering vessel type and size, loading condition and cargo type.
6. Maintaining the application of non-discriminatory measure.
Some examples of these marketing policies concern a tariff line with the 45-55-65% di-
scounts to containerships on some routes from the East Coast ports of the Americas and di-
rected to South and South-East Asia. These rebates shall remain in force until 31/12/20182
and might force carriers to choose to lengthen journey times in order to achieve savings.
This is mainly a marketing tool aimed at attracting cargo traffic potentially interested in the
Panama Canal.
A specific analysis conducted by specialized research firm Alphaliner on the choices of
shipping companies that offer services for container traffic on the route between the Far
East and the East Coast of the United States, showed that out of the 19 services offered in
2
Suez Canal Authority Circular 2/2016.
In detail the rebates concern:
1. Container ships coming from port of Norfolk and its northern ports heading to the ports of Port Kelang and
its eastern Ports shall be granted a reduction of 45% of the Suez Canal normal tolls.
2. Container ships coming from ports south of port of Norfolk heading to:
a) Ports of Port Kelang and its eastern ports shall be granted reduction of 65% of the Suez Canal normal tolls.
b) Ports of Colombo and its eastern ports located just up to port of “Port Kelang” shall be granted reduction
of 55% of Suez Canal normal tolls.
Condition of applying the Circular is that the ship must not call any port in between port of origin and port of
destination for commercial purposes.
www.srm-maritimeconomy.com 15July 2018 14 were via Panama and 5 via Suez. Average vessel size on the FE-USEC services
via Panama has increased rapidly since 2016, and will reach 8,800 TEUs by September
2018 compared to less than 4,600 TEUs prior to the opening of the neo-panamax locks
in June 2016. Average vessel size via Suez will reach 9,100 TEU by September 2018, the
highest average ever achieved.
Given the situation, the pricing policies adopted by the SCA have an important impact on
the choices of carriers regarding the routes to follow.
In recent years, a number of ships of various types has travelled the Northern Sea Route
passage, helped by light icing conditions. These included multipurpose cargo vessels and
an increasing number of purpose-built ice-class LNG ships. The latter became more com-
monplace after Russia started to exploit some of its northernmost gas fields.
As far as container ships are concerned, the NSR currently has very little ‘mainstream’ ap-
peal. While it shortens the distance between the Far East and Europe, it is not navigable
year-round and it does not serve any markets along the way. However, the NSR could come
in handy for occasional ad-hoc trips. In August 2018, for example, the Russian Arctic Route
between the Far East and Europe was navigated by a fully cellular container vessel for the
first time in history. Maersk Line has decided that its 3,596 teu newbuilding VENTAMAER-
SK will be operational in Europe and serve the NSR, linking Europe’s main ports with the
Baltic Sea Region. Compared to the normal 10,600 nm routing via the Suez Canal, the trip
via the Russian Arctic, on the so-called Northern Sea Route (NSR), saves some 2,800 nm of
steaming distance.
The marketing policies adopted by the Suez Canal Authority are addressed to other sectors
of maritime transport too.
Some examples of these marketing policies concern a tariff line with the 45-65-75% di-
scounts to Crude Oil Tankers (Laden or Ballast), coming from ports of the US Gulf, Caribbe-
an area and Latin America heading to Asian ports3.
3
Suez Canal Authority Circular 1/2018.
In detail the rebates concern:
1. Crude Oil Tankers coming from ports of the US Gulf, Caribbean area heading to:
a) Ports West of Indian subcontinent starting from Karachi to Cochin shall be granted a reduction of 45% of
the Suez Canal normal tolls.
b) Ports located East of Cochin shall be granted a reduction of 75% of Suez Canal normal tolls.
1. Crude Oil Tankers coming from ports of Latin America Starting from Colombia (San Andres Island - Latitude
12o 34’ 40’’ N) and its south heading to:
a) Ports West of Indian subcontinent starting from Karachi to Cochin shall be granted reduction of 65% of the
Suez Canal normal tolls.
b) Ports located East of Cochin shall be granted a reduction of 75% of Suez Canal normal tolls.
Condition of applying the Circular is that the vessel must not call any intermediate ports during its voyage
between origin port and destination port for commercial purposes.
16 www.srm-maritimeconomy.comOther toll payment reductions are planned for: a) ships transiting the Suez Canal due to
repair or maintenance to be carried out in the SCA Shipyards or its affiliated companies4;
b) LNG Carriers transiting Suez Canal with large gas quantities5; c) super tankers transiting
the Canal partially loaded after lightering part of their cargo through the SUMED pipeline6.
The Impact of Suez traffic on the portuality of the Med and of Italy. The role of SEZ
The policy of attracting traffic through Suez has significant implications in the portuality of
the Mediterranean. Over the last 10 years, cargo transiting in both directions has grown
by 25.7% but it is also important to highlight that in the same period containerised goods
have increased by 37%. The importance of this sector has therefore increased dramatical-
ly, which, to a certain extent, has resulted in increased movement of containers by Short
Sea Shipping in the Mediterranean (+37%)7. Also, according to UNCTAD forecasts, global
maritime transport will grow by 3.8% in the period 2018-2023. Considering that, the Me-
diterranean sea accounts for 20% of the world seaborne transport, this area is expected to
follow a similar trend, which is bound to affect port throughput.
In fact, between 2007 and 2017, the throughput of containers in the ports of the Medi-
terranean and the Black Sea has grown from 44 million TEUs to 57 million, showing a 30%
increase8. In Italy, the increase amounted to a mere 1%, a result that was probably affected
by the growth of ports on the South and East banks of the Mediterranean Basin. If our port
system had shown a similar performance to the average of the Mediterranean ports, it
could have handled 3 million TEUs more in 2017.
Our gap with competitor ports does not depend only on quantities handled but also on the
quality of industrial and logistic processes. The main issue seems to be that in our country
we do not work with the content of containers as these are not logistically handled but
simply moved or transhipped from a vessel to the other. Handling the content of a con-
tainer generates approximately € 2,300 while the mere movement of the same container
only results in a € 300 gain. Since 37% of our container traffic is transhipped, a shift from
moving to handling would result in an extra € 8.5 billion for our economy.
4
Suez Canal Authority Circular 5/2011.
5
Suez Canal Authority Circular 3/2011.
6
Suez Canal Authority Circular 5/2004 & Circular 2/2013.
7
In this case we are referring to SSS container traffic of EU 28 countries in the Mediterranean basin and in the
Black Sea. The period analysed is 2008-2016 (last available year). Eurostat (April 2018), Short Sea Shipping of
goods.
8
Assoporti (2018), Il Mar Mediterraneo. Scenari geo strategici della portualità italiana nel quadrante Mediter-
raneo-Mar Nero.
www.srm-maritimeconomy.com 17Another important indicator affecting container traffic is Special Economic Zones. A pre-
vious study from SRM conducted on a sample of 10 Med ports with a SEZ illustrated that
over the last 10 years this kind of traffic showed average annual increases of 8.4% (it is
useful to highlight that in Italy this growth only amounted to 1%). If we managed to follow
the aforementioned high growth trend also in Italian ports, this would result in volumes to
grow until 11.5 million TEUs. This traffic increase would also bring as a consequence some
positive impacts concerning the logistic handling with added value.
SEZ are also important in terms of their attractiveness to foreign investment. As thoroughly
explained in the chapter about the Suez Canal Zone, the Egyptian canal’s surrounding area
is witnessing such a high concentration of significant foreign investment that it has been
necessary to identify a “Chinese Zone” and a “Russian Zone”.
18 www.srm-maritimeconomy.comInternational performance indexes: Egypt ranking and its maritime and logistics connection This chapter analyzes Egypt’s features in terms of shipping connectivity (regular shipping servi- ces for the import and export of manufactured goods) and logistics performance (customs, infra- structures, shipping rates, logistic services, consignments, timeliness). These two elements are important for facilitating the business of manufacturing companies, and, more in general, to im- prove efficiency in trade and supply chains. According to the LSCI (Liner Shipping Connectivity Index), Egypt has a good transport connectivity. In 2018, with an index of 70.3, Egypt ranked 18th in the global table (China is 1st in the world), 3rd among the MENA countries and 2nd among South Mediterranean countries. In 2004 Egypt’s LSCI was 42.9, much lower than in 2018 (70.3), and it is easy to notice how sharply it increased after 2015 (Suez Canal expansion), from 61.5 to 70.3. Since 2004, the linear trend shows an increase of 1.5 points every year for Egypt’s LSCI. However, Egypt’s potentials are even more considerable. In fact, some MENA countries (e.g., Morocco and the UAE), thanks to their big investments in ports and related infrastructures, have dramatically improved their transport connectivity and the same may happen for Egypt. Based on the LSBCI (Liner Shipping Bilateral Connectivity Index), which analyzes connectivity between two countries, Egypt is well connected with Italy, Spain, France, China and Malaysia. Among MENA countries, Turkey is the one with which Egypt has the highest LSBCI. Morocco, Rus- sia, Slovenia, Viet Nam and Lebanon are the countries with which Egypt’s LSBCI increased more in the period 2006-2016. In 2018 Egypt had an LPI of 2.8 and ranked 67th in the global table. Some MENA countries show a better LPI than Egypt’s. In particular, in 2018 Egypt ranked 9th among the other MENA countries. A more detailed analysis, taking into account the LPI domestic index, shows that Egypt’s operators generally rate highly their port and airport infrastructure and services, while their assessment of quality is less positive when it comes to road and rail. Therefore, on the whole, Egypt’s logistic system needs improvements, especially in the road and rail system. Anyway, investments in the maritime sector are needed as well to improve Egypt’s shipping connectivity and give the country a more prominent role in international trade, as Morocco’s and UAE’s experiences show. www.srm-maritimeconomy.com 19
Liner Shipping Connectivity Index (LSCI): a comparison with
other MENA countries
Every Country’s access to global markets depends largely on their transport connectivity, espe-
cially as regards regular shipping services for the import and export of manufactured goods. UN-
CTAD’s Liner Shipping Connectivity Index (LSCI) aims at capturing a country’s level of integration
into global liner shipping networks. The current version of the LSCI is generated from five com-
ponents: (a) the number of ships; (b) the total container-carrying capacity of those ships; (c) the
maximum vessel size; (d) the number of services; and (e) the number of companies that deploy
container ships on services from and to a country’s ports.9
Based on the LSCI, Egypt has a good transport connectivity. In 2018 Egypt, with an index of 70.3, it
ranked 18th in the global table (China is 1st in the world, followed by Singapore and South Korea),
3rd among the MENA countries (After the UAE and Morocco) and 2nd among South Mediterranean
countries (after Morocco).

Egypt’s LSCI in 2018: a comparison with MENA countries

90      83.9
80
               71.5      70.3
70                               66.6
                                                63.0
                                                       59.7
60

50                                                              47.2
                                                                          42.5   41.7
                                                                                         38.1      37.8      37.0
40

30
                                                                                                                        23.6
20
                                                                                                                               11.7    11.4     10.4      8.8     7.9
10                                                                                                                                                                        6.3

    0
                         Egypt

                                 Saudi Arabia

                                                                Lebanon

                                                                                 Qatar

                                                                                         Bahrain

                                                                                                                                                Algeria
                                                                                                             Djibouti

                                                                                                                               Libya
        UAE

                                                Oman

                                                                                                   Jordan

                                                                                                                        Iraq

                                                                                                                                       Kuwait

                                                                                                                                                                          Tunisia
                                                                                                                                                          Syria

                                                                                                                                                                  Yemen
                                                       Turkey
               Morocco

                                                                          Iran

Figure 11 - Source: SRM on Unctad data

It’s interesting to analyze the trend of Egypt’s transport connectivity over the years. Unctad’s data
show that in 2004 (first available year) Egypt’s LSCI was 42.9, much lower than in 2018 (70.3),
and it is also easy to notice how sharply it increased after 2015 (Suez Canal expansion), from 61.5

9
 The index is generated as follows: for each of the five components, a country’s value is divided by the maximum value
of that component in 2004, and for each country, the average of the five components is calculated. This average is then
divided by the maximum average for 2004 and multiplied by 100. In this way, the index generates the value 100 for the
country with the highest average index of the five components in 2004.

20                                                                                                          www.srm-maritimeconomy.com
to 70.3. Since 2004, the linear trend shows an increase of 1.5 points every year for Egypt’s LSCI.
However, Egypt’s potentials are even higher. Some MENA countries, thanks to their big invest-
ments in ports and related infrastructures have dramatically improved their transport connectivi-
ty over the past 15 years. Take Morocco, for example: its LSCI in 2004 was 9.4, 78th in the global
ranking, 12th among MENA countries. In less than a decade, it climbed the ranking and in 2010 it
placed 18th, with an LSCI of 49.4. In 2018 Morocco ranked 17th in the global rank, 2nd among MENA
countries. Let’s consider now the UAE: among MENA countries, It was 2nd in LSCI ranking in 2004,
but over the years it has increased its LSCI more significantly than Egypt. Since 2010 the UAE has
ranked 1st among the MENA countries. In conclusion, Morocco and the UAE show how impor-
tant is investing in ports to increase shipping connectivity. Egypt has lost positions from 2004 up
till 2015, but, after the Suez Canal expansion and thanks to further infrastructural investments,
Egypt’s LSCI has increased a lot. Probably, further improvement will occur over the next years.
Egypt’s LSCI trend 2004-2018
75
y = 1.5098x + 42.588
70
65
60
55
50
45
40
2004 2005 2006 2007 2008 2009 2010 2011 2012 2013 2014 2015 2016 2017 2018
Figure 12 - Source: SRM on Unctad data
LSCI: First 5 MENA countries dynamic
2004 2010 2015 2018
1° Egypt 42.9 UAE 63.4 UAE 70,4 UAE 83.91
2° United Arab Emirates 38.1 Saudi Arabia 50.4 Morocco 68,3 Morocco 71.5
3° Saudi Arabia 35.8 Morocco 49.4 Saudi Arabia 64,8 Egypt 70.28
4° Turkey 25.6 Oman 48.5 Egypt 61,5 Saudi Arabia 66.62
5° Oman 23.3 Egypt 47.6 Turkey 52,0 Oman 62.97
Table 3 - Source: SRM on Unctad data
www.srm-maritimeconomy.com 21The liner shipping bilateral connectivity index (LSBCI) is an extension of UNCTAD’s country-level
Liner Shipping Connectivity Index (LSCI) and is based on a proper bilateralization transformation.
It shows the level of liner shipping connectivity between two countries. The current version of the
LSBCI includes 5 components. For any pair of countries A and B, the LSBCI is based on:
1. the number of transshipments required to get from country A to country B;
2. the number of direct connections common to both country A and B;
3. the geometric mean of the number of direct connections of country A and of country B;
4. the level of competition on services that connect country A to country B;
5. the size of the largest ships on the weakest route connecting country A to country B.
The LSBCI aims to answer the following question: which country is Egypt better connected with?
If we take into account all the countries in the world it is Italy, Spain, France, China and Malaysia
that have the higher LSBCI with Egypt, more than 0.64 points (the index can range between 0,
minimum value, and 1, maximum value). Morocco, Russia, Slovenia, Viet Nam and Lebanon are
the countries with which Egypt’s LSBCI increased more in the 2006-2016 period. Liberia, Tonga,
Comoros, Yemen and Sierra Leone are the ones with a decreasing LSBCI.
Among MENA countries, Turkey is the one with which Egypt has the highest LSBCI, followed by
Saudi Arabia, the UAE and Lebanon, with an LSBCI higher than 0.55. Over the past decades, Egypt’s
LSBCI with Turkey, UAE and Lebanon has remarkably increased.
Egypt’s LBSCI: countries with the best LSBCI, with an increasing LSBCI and with a decreasing LSBCI
0.3
Morocco
Increasing LSBCI Russian Federation
Slovenia
0.2 Lebanon
LSBCI - difference 2006-2016
Viet Nam
China Best LSBCI
0.1 Malaysia Spain
Italy
France
0
0 0.1 0.2 0.3 0.4 0.5 0.6 0.7 0.8
Tonga Liberia
-0.1 Comoros
Yemen
Sierra Leone
Decreasing LSBCI
-0.2
LSBCI in 2016
Figure 13 - Source: SRM on Unctad data
22 www.srm-maritimeconomy.comEgypt’s LBSCI with MENA countries (2016)
0.70
0.62 0.61 0.61
18
0.60 0.56
0.54
16 0.52
0.50 0.46
14 3,1 mb/d
0.42
0.40 0.37
12 0.36
0.32 0.32 0.31
10
0.30 0.27 0.27
4 mb/d 0.25
0.22
8 0.18
0.20
6 12,4 mb/d
0.10
4 7,5 mb/d
0.00
2
Morocco
Jordan
Syria
UAE
Lebanon
Oman
Djibouti
Turkey
Bahrain
Algeria
Tunisia
Saudi Arabia
Libya
Yemen
Iraq
Qatar
Kuwait
Iran
0
2016 2040
Souther Med Countries Other MENA Countries
Figure 14 - Source: SRM on Unctad data
Egypt’s LSBCI: First 10 MENA countries dynamic
2006 2010 2016
1° Saudi Arabia 0.50 Turkey 0.52 Turkey 0.62
2° Turkey 0.49 Saudi Arabia 0.51 Saudi Arabia 0.61
3° UAE 0.45 UAE 0.48 UAE 0.61
4° Lebanon 0.40 Oman 0.46 Lebanon 0.56
5° Oman 0.39 Djibouti 0.44 Oman 0.54
6° Syria 0.38 Lebanon 0.42 Morocco 0.52
7° Jordan 0.35 Morocco 0.41 Djibouti 0.46
8° Iran 0.34 Jordan 0.40 Jordan 0.42
9° Algeria 0.32 Syria 0.36 Syria 0.37
10° Djibouti 0.32 Iran 0.36 Bahrain 0.36
Table 4 - Source: SRM on Unctad data
Logistics Performance Index (LPI): a comparison with other MENA countries
The Logistics Performance Index (LPI) is an interactive benchmarking tool created to help coun-
tries identify the challenges and opportunities they face in their performance on trade logistics
and what they can do to improve their performance. The LPI 2018 allows for comparisons across
160 countries. It is based on a worldwide survey of operators on the ground (global freight forwar-
www.srm-maritimeconomy.com 23ders and express carriers), providing feedback on the logistics “friendliness” of the countries in
which they operate and those with which they trade.
It measures performance along the logistics supply chain within a country and offers two different
perspectives: a) international and b) domestic.
a) International LPI: provides qualitative evaluations of a country in six areas by its trading part-
ners—logistics professionals working outside the country.
The six core components are:
• The efficiency of customs and border clearance (“Customs”).
• The quality of trade and transport infrastructure (Infrastructure”).
• The ease of arranging competitively priced shipments (Ease of arranging shipments”).
• The competence and quality of logistics services (“Quality of logistics services”).
• The ability to track and trace consignments (“Tracking and tracing”).
• The frequency with which shipments reach consignees within scheduled or expected delivery
times (“Timeliness”).
b) Domestic LPI: provides both qualitative and quantitative assessments of a country by logistics
professionals working inside it. It includes detailed information on the logistics environment, core
logistics processes, institutions, and performance time and cost data.
In 2018 Egypt ranked 67th in the world with an LPI of 2.8, a figure that showed a slight improve-
ment on the 2007 performance (LPI 2.3, 97th position in the world). Egypt’s LPI trend also showed
a peak of 3.2 in 2016 (49th) and then fell to 2.8 in 2018, making it the 67th country in the world and
the 9th in the MENA area. The following MENA countries showed better performances in terms of
LPI (higher than 3.0): the UAE, Qatar, Oman and Turkey.
Egypt’s LPI compared to other MENA countries
4.5
4.0
4
3.5
3.5 3.2 3.2
3.0 2.9
3 2.9 2.9 2.8 2.7 2.7 2.6 2.6 2.5 2.5
2.5 2.3 2.3 2.2 2.1
2
1.5
1
0.5
0
Qatar
Saudi Arabia
Bahrain
Lebanon
Algeria
Kuwait
Egypt
Djibouti
Libya
UAE
Oman
Iran
Jordan
Tunisia
Syria
Turkey
Yemen
Iraq
Morocco
Figure 15 - Source: SRM on World Bank data
24 www.srm-maritimeconomy.comIf we break the LPI down into its 6 components, Egypt shows a better index as for 1) The quality of
trade and transport infrastructure and 2) The competence and quality of logistics services.
Egypt’s LPI breakdown of its 6 components (ranking in the global table)
LPI Rank
90
80
70
Timeliness 60 Customs
50
40
30
20
10
0
Tracking & tracing Infrastructure
Logistics competence International shipments
Figure 16 - Source: SRM on World Bank data
In order to further investigate Egypt’s logistic performances, it is necessary to analyze the Dome-
stic LPI, which includes detailed information on the logistics environment, core logistics processes,
institutions, and performance time and cost data.
Domestic LPI performances data analyze export and import distance and lead time as for the port
and the land supply chain. Export distance in Port or airport supply chain in Egypt is 349km, less
than the MENA average, but more than the LPI top performer (Germany). Lead time is not high (2
days, like Germany’s lead time). Some difficulties emerge as for Land supply chain, for which ave-
rage distance (792km) and lead time (5 days) are higher than both the Top Performer (Germany)
and the MENA average. As for goods in imports, lead time is high both for the Port and airport sup-
ply chain (5 days/2 days in Germany) and for the Land supply chain (6 days/3 days in Germany).
The World Bank’s domestic LPI survey gives some information on local logistics professionals per-
ception in terms of fees/charges, Quality of trade and transport related infrastructure, Quality of
service delivered, Sources of Major Delays, Changes and developments in the logistic system.
Fees and charges are considered too high by local operators in Egypt: the percent of respondents
answering high/very high charges is 67% for port (vs 47% for MENA average and Germany), 50%
for airport (vs 34% for MENA and 58% for Germany), 33% for road (vs 15% 27%) and 0% for rail
transport (vs 6% and 25%).
Quality of trade and transport related infrastructure gets different perceptions depending on the
infrastructure considered. As for ports, percent of respondents answering low/very low is 17%, in
www.srm-maritimeconomy.com 25line with MENA countries average, but higher than Germany’s one, where no professionals con-
sider the quality of ports low. As for airports, data are similar. As for roads, and especially for rail,
the percent of professionals answering low/very low is much higher, respectively 33% (vs 11% in
MENA and 14% in Germany) and 50% (vs 58% and 23%).
A similar assessment can be made for the quality of services delivered. 67% of respondents say
the quality is high/very high for air transport (vs 44% for MENA average and 95% for Germany)
and maritime transport (vs 69% and 95%). On the other hand, only 33% of respondents consider
the quality of services delivered in road transport is high or very high (vs 54% and 95%) and 20%
in rail transport (vs 16% and 62%).
Compulsory warehousing/transloading is a source of delay for 17% of respondents, while Pre-shi-
pment inspection for 50% (compare it with 32% in MENA countries and 5% in Germany).
However, a good chunk of respondents see improvement in the logistics system in Egypt. In par-
ticular, 50% of respondents see improvement in trade and transport infrastructure, and 67% in
private logistics services, in line with MENA and Germany. Finally, only 33% of respondents con-
sider customs clearance procedures improved or much improved (vs 56% for MENA average and
Germany).
Egypt’s Domestic LPI - Performances
Egypt Middle East & North Africa Top Performer 2018 (Germany)
Export time and distance / Port or airport supply chain
Distance (kilometers) 349 km 577 km 212 km
Lead time (days) 2 days 2.8 days 2 days
Export time and distance / Land supply chain
Distance (kilometers) 792 km 700 km 569 km
Lead time (days) 5 days 4.1 days 2 days
Import time and distance / Port or airport supply chain
Distance (kilometers) 452 km 540km 350 km
Lead time (days) 5 days 4.5 days 2 days
Import time and distance / Land supply chain
Distance (kilometers) 554 km 740 km 559 km
Lead time (days) 6 days 5 days 3 days
Table 5 - Source: SRM on World Bank data
26 www.srm-maritimeconomy.comEgypt’s Domestic LPI - Environment and Institutions Fees and Charges - Percent of respondents Egypt (%) Middle East & North Africa Top Performer 2018 answering high/very high (%) (Germany) (%) Port charges 67 47 47 Airport charges 50 34 58 Road transport rates 33 15 27 Rail transport rates 0 6 25 Quality of trade and transport related infrastructure - Percent of respondents answering low/very low Ports 17 21 0 Airports 17 10 0 Roads 33 11 14 Rail 50 58 23 Quality of service delivered - Percent of respondents answering high/very high Road 33 54 95 Rail 20 16 62 Air transport 67 44 95 Maritime transport 67 69 95 Sources of Major Delays - Percent of respondents answering often or nearly always Compulsory warehousing/transloading 17 18 0 Pre-shipment inspection 50 32 5 Maritime transshipment 0 10 5 Changes - Percent of respondents answering improved or much improved Customs clearance procedures 33 56 56 Trade and transport infrastructure 50 52 45 Private logistics services 67 67 70 Table 6 - Source: SRM on World Bank data www.srm-maritimeconomy.com 27
The Belt & Road Initiative and the Role
of the Mediterranean countries
The BRI and the Chinese development strategy for the future
The Chinese Belt & Road Initiative (BRI) is probably the most important investment project
worldwide since the Marshall Plan that followed World War 2 in terms of number of countries
involved in the project and amount of financial resources devoted to the initiative10.
The BRI
Silk Mari me
Road Silk Road
MOSCOW
ROTTERDAM
DUISBURG
ALMATY HUOERGUOSI
VENICE BISHKEK
URUMQI
ISTANBUL SAMARKAND
LANZHOU
ATHENS XIAN
DUSHANBE
TEHERAN
FUZHOU
CALCUTTA BEIHAI
QUANZHOU
ZHANJIANG
HANOI
GUANGZHOU
HAIKOU
COLOMBO
KUALA
LAMPUR
NAIROBI JAKARTA
Figure 17 - Source: SRM
10
The Marshall Plan financial resources are estimated at about $130 billion at 2016 dollar values ($13bn originally),
compared to the total resources devoted to the BRI estimated between $1 and $8 trillion, depending on the timeline.
Steinbock D, “How the Belt and Road could change the 21st Century”, in China Daily, May 15 2017.
28 www.srm-maritimeconomy.comBased on official statements and documents by Chinese officials and agencies, the project aims to
implement the following:
1. an inland Silk Road economic belt connecting West China with Europe via Central Asia, Rus-
sia and Northeast Europe, as well as with the Indian Ocean through Pakistan. A network of
railway lines, highways and pipelines will form the inland economic belt.
2. a maritime Silk Road to connect the Southeastern coastline of China to the Mediterranean
Sea through the South China Sea, the Indian Ocean and the Suez Canal. The project involves
investments in port areas and inland logistic and industrial facilities along these maritime rou-
tes.
The BRI was officially launched by President Xi Jinping in a speech at Nazarbayev University in Asta-
na (Kazakhstan) in September 2013. It originally involved 65 countries11 in Asia, Europe and Africa
and will be wholly completed by 2049. According to some estimates, China will spend around
$1,000 billion in the next ten years to implement the initiative. The financial resources required
would total around $8,000 billion over the entire investment period12.
The GDP in these 65 countries considered as a whole represents around 1/3 of the entire world’s
GDP and over 60% of the world’s population.
Furthermore, since its launch many other countries have expressed interest in the project, by
joining the Asian Infrastructure Investment Bank (AIIB)13 or planning and developing transport
infrastructures in cooperation with China.
In fact, 48 other countries – besides the 65 countries officially involved in the BRI since its launch
– have been identified so far. They are likely to become active participants in the project. As of
September 2017 China had already signed cooperation agreements with 74 countries14.
The project will probably extend to other areas of the world, involving countries in Oceania and
South America as well.
Table 7 is a list of European and MENA countries involved in the BRI (in bold type, the countries
with shores on the Mediterranean Basin).
43 European countries and 19 countries of the MENA region are involved in the BRI or have shown
interest in the project. Among these, there are 22 countries with shores on the Mediterranean
Basin, 13 of them are European countries and 9 of them fall within the MENA region.
11
Industrial Cooperation between Countries along the Belt and Road, China International Trade Institute, August 2015.
12
Hillman J.E., “How Big Is China’s Belt and Road?”, April 3, 2018, Center for Strategic and International Studies.
13
AIIB, a multilateral development bank crated in 2016, is one of the most important financial pillar of the BRI. It has 86
approved members as at October 2018.
14
Keynote speech of Chinese President Xi Jinping at the opening ceremony of the Belt and Road Forum (BRF) for Inter-
national Cooperation in Beijing, May 14, 2017.
www.srm-maritimeconomy.com 29European and MENA countries involved in the BRI
Europe MENA
Albania Georgia Poland Algeria Syria
Austria Germany Portugal Bahrain Tunisia
Armenia Greece Romania Djibouti UAE
Azerbaijan Hungary Russia Egypt Yemen
Belarus Iceland Serbia Iran
Belgium Italy Slovak Republic Iraq
Bosnia and H. Latvia Slovenia Israel
Bulgaria Lithuania Spain Jordan
Croatia Luxembourg Sweden Kuwait
Cyprus FYR Macedonia Switzerland Lebanon
Czech Republic Malta Turkey Morocco
Denmark Moldova Ukraine Oman
Estonia Montenegro United Kingdom Qatar
Finland Netherlands Saudi Arabia
France Norway Palestine
Table 7 - Source: SRM on World Bank data
The underlying logic of the BRI
• Maintaining sustained and long-lasting economic growth for China;
• Solving the Chinese internal economic imbalance between coastal regions and inland lagging
areas;
• Taking advantage of the BRI as a transition tool that can allow China to move from an economic
model based on low cost manufacturing to a new economic model based on high value added
production.
• Using Chinese overcapacity in the steel and cement industries for investment in infrastructures
in recipient countries along the route.
• Securing sufficient energy sources for the Chinese economy in the coming years.
The analysis of the impact of such a complex strategy and ambitious project on Mediterranean
countries is the main goal of this chapter.
China economy’s growth rate has shrunk in recent years when compared to the period 2000-
2010, due to the increase of labour cost: the BRI can open new markets for Chinese companies
and give a new impetus to China’s economy.
30 www.srm-maritimeconomy.comThe huge internal imbalance between lagging western regions and developed coastal areas is one of the main problems that the Chinese authorities wish to solve. It is not only a matter of contrasting levels of economic development but also the fact that the imbalances can put at risk the cohesion of the country itself. The choice of the Xinjiang region as the starting point of the inland economic belt connecting China with Europe is a huge opportunity of development for west China and for Central Asian countries as well. These areas had been cut out of the maritime commercial routes that had facilitated the economic development of the coastal regions in south- east China at the beginning of the opening process undertaken in the last decade of XX Century. The aim of the Chinese authorities is to make China the global leader in the field of new technologies, specifically Artificial Intelligence and Semiconductors, in just seven years’ time, by 2025. The Chinese authorities are planning to shift from a developing model based on a huge manufacturing sector and driven by low cost exports – “China as the factory of the world” – to a new model that is services-led and based on rising consumption and domestic demand: “China as the laboratory of the world”. The growing presence of China in the Mediterranean: economic cooperation and investments The attractiveness of Chinese investments has grown among European countries since the outbreak of the Euro crisis in 2011; over the last decade increasing Chinese investments have taken place in several Mediterranean countries. Take the example of Greece, a country heavily hit by the financial crisis, where the acquisition of the Port of Piraeus by the Chinese shipping company Cosco in 2011 was a major relief for the public budget. Intense competition between Mediterranean countries for attracting Chinese investments has emerged in recent years. In response to the Chinese maritime strategy of investing in several port infrastructures in the Mediterranean Basin, the Med countries on both the northern and the southern shore of the Basin are promoting themselves as a priority gate for inland countries and territories. The increase of ship size of the main container carriers has had a significant impact on global maritime routes. In fact, not all Mediterranean ports are equipped to accommodate 19k to 21k TEUs ships and few of them can offer the required level of logistic efficiency and connection. Moreover, in the view of Chinese authorities the presence of industrial zones, logistic facilities and tax-free areas serving port infrastructures can play a very important role in boosting the efficiency of the maritime industry and thus they are considered as positive factors by investors. On the southeastern shore of the Mediterranean, Turkey has received significant funds to improve its infrastructures. The city of Kars, close to the border with Armenia, is the terminal of the BTK www.srm-maritimeconomy.com 31
(Baku-Tbilisi-Kars), a railway line linking Azerbaijan to Turkey through Georgia. This 838 km long
line will shorten the usual route between China and Europe by 7,000 km. Near the Bosphorus
Strait there are other big infrastructure projects linked to the BRI: the rail tunnel of Marmaray
and the third bridge over the strait – the Tavuz Sultan Selim Bridge . The Turkish coastline is also a
staging post to the Maritime Silk Road.
North Africa, thanks to its strategic position between the Middle East and Europe, plays an
important role within the BRI project. The five countries of the area have different strategies
concerning economic partnership and alliances within the African continent. While Egypt, Libya
and – from last April – Tunisia are part of the COMESA (Common Market for Eastern and Southern
Africa), Morocco joined the CEDEAO (Economic Community of West African States) in 2018 and
Tunisia gained the status of observer member of this organization in November 2017. Algeria,
on the other hand, joined the CEMAC (Central African Economic and Monetary Community) a
choice consistent with the new Trans-Sahara Highway connecting Lagos in Central Africa to
Algiers. The highway may serve as a strategic infrastructure to connect the southern shore of the
Mediterranean to Central Africa.
All North African countries are directly involved in the Belt & Road Initiative, even if only Egypt has
been part of the project since its launch back in 2013. Their geographic position on the southern
shore of the Mediterranean in an asset for investors in ports and logistic facilities in the framework
of the maritime silk road.
Following the “string of pearl” strategy for the maritime silk road, Chinese investors have planned
to take control of a series of port infrastructures along the maritime route from southeast China
to the Mediterranean through the Indian Ocean and Suez.
Complementarities between the Chinese strategy underlying the BRI project and North African
countries are rather evident:
•    Following the strengthening of commercial ties between China and Europe – which is among
     the main purposes of the BRI – the economies of the southern Mediterranean can play an
     active role within the supply and value chains that will be created.
•    One of the priorities for Chinese authorities is to secure the energy needs of the country in the
     coming years, considering the expected sharp increase of China’s energy consumption. As it
     will be pointed out further on in this chapter, China focuses its energy strategy on the Middle
     East, and specifically on Persian Gulf countries, while investments in North Africa are mainly
     directed to the RES project.
•    North African countries greatly need improved infrastructures to fuel their economic
     development and solve the strong imbalances between coastal areas and inland regions: this
     is a strategic issue for countries like Tunisia and Egypt where the lack of financial resources can
     open the way for Chinese investors; China, for its part, can use its overcapacity in the domestic
     building sector for infrastructure projects in Northern Africa.

32                                                           www.srm-maritimeconomy.com
You can also read