GLOBAL DDOS THREAT REPORT - 2019 REVIEW IN ASSOCIATION WITH NETSCOUT - THINK BIG BUSINESS
←
→
Page content transcription
If your browser does not render page correctly, please read the page content below
T SA | GLOBAL DDoS THREAT REPORT

                           GT SA | E TISAL AT GLOBAL DDoS THREAT REPORT

GLOBAL DDoS
THREAT REPORT

2019 REVIEW

In association with NETSCOUT

                                                                     A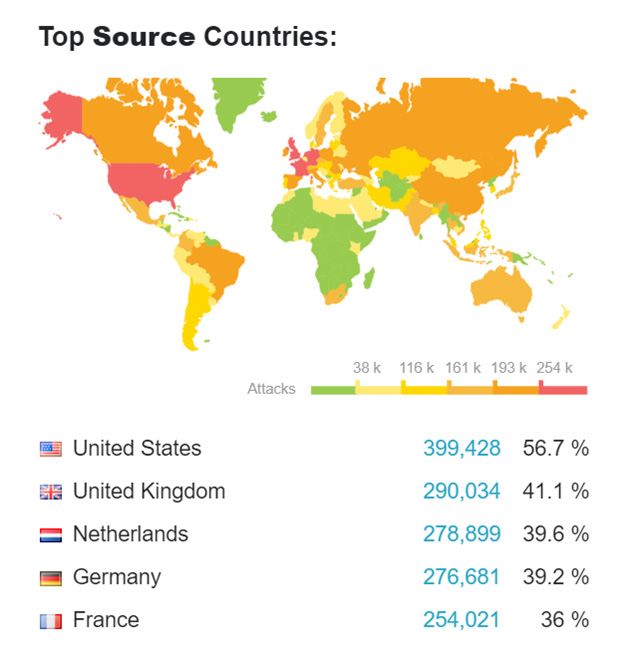
T SAT |SAGLOBAL
                                                                                                 | E TISAL ATTHREAT
                                                                                                        DDoS  GLOBALREPORT
                                                                                                                     DDoS THREAT REPORT

TELCO SECURITY ALLIANCE
AT&T, Etisalat, Singtel, SoftBank & Telefónica jointly formulated the Global Telco Security Alliance to unify their
capabilities & security best practices and help global customers access to cybersecurity expertise & experience
from other markets.

The alliance continuously collaborates at all levels to accelerate the creation of cutting-edge security services
and share security business best practices. The TSA have embarked on multiple complex initiatives over the last
12 months to produce new services that leverage many of our common existing security investments combined
with our now global expertise and experience.

As part of the thought leadership initiatives from the TSA, this jointly produced report provided insights,
commentary and detailed statistics of DDoS network events at both a global and a regional viewpoint. The
data and expertise comes both from the TSA and our report partner Netscout who operate a globally scoped
network anomaly collection tool called the Advanced Threat Level Analysis System (ATLAS). This ATLAS dataset
combined with the TSA’s exclusive global partnership is what enables this unique report to be created.

NETSCOUT Systems, Inc., is the market leader in carrier-class DDoS protection, mobile service assurance, and
performance management, solving the toughest problems for the world’s largest enterprises and service
providers. Our market and technology leadership stems from combining our patented Smart Data technology
with smart analytics to deliver smart answers in real time.

In the following report all charts and table data are sourced from NETSCOUT Advanced Threat Level Analysis
System (ATLAS) with analysis excerpted from the NETSCOUT Threat Intelligence Report.
For the full report, please refer to: https://www.netscout.com/threatreport

                                                                                                                        1
T SA | GLOBAL DDoS THREAT REPORT

                          GT SA | E TISAL AT GLOBAL DDoS THREAT REPORT

TABLE OF
CONTENTS

           EXECUTIVE SUMMARY                                       3

           GLOBAL DDOS TRENDS AND HIGHLIGHTS                       4

           GLOBAL DDOS SITUATION                                   9

           REGIONAL DDOS SITUATION                                 15

           • EMEA DDOS SITUATION                                   16

           • APAC DDOS SITUATION                                   18

           • LATAM DDOS SITUATION                                  20

           • NAMER DDOS SITUATION                                  22

           CONCLUSION                                              24

                                                                    2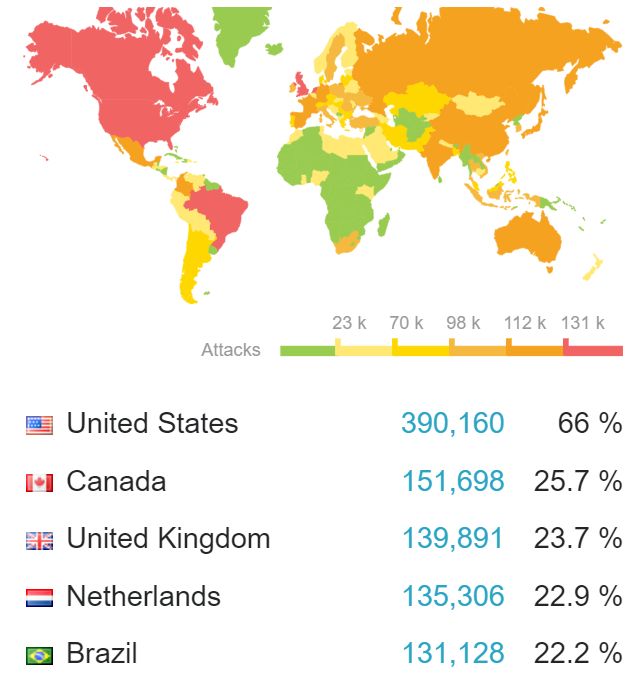
T SA | GLOBAL DDoS THREAT REPORT

                                    GT SA | E TISAL AT GLOBAL DDoS THREAT REPORT

EXECUTIVE SUMMARY
Globally, Distributed Denial of Service (DDoS) attacks have become more
prevalent, powerful and sophisticated. Attackers continue to see great
success from using DDoS attacks as a major attack vector to achieve
their objectives.

It is estimated that approximately 7.7 million new devices are added
to the Internet everyday of which, a significant number of devices
are either deficient or even non-existent with any preferred levels
of security. These devices end up being controlled by cybercriminals
who in turn weaponize them in order to unleash cyberattacks in an
unprecedented order of magnitude.

Telecom service providers play a significant role in delivering availability
and performance on your networks, by protecting your Internet
traffic from impending DDoS attacks. They have deployed capacity
and capability to deliver proactive mitigation and protection against
DDoS attacks. With data from this report, local expertise, services and
partnerships, businesses are still able to protect themselves and reduce
the risk of having online business disruptions.

The alliance of large communications companies from various regions
that form the TSA, together with partners like Netscout, bring
comprehensive and reliable information that helps us all to understand
the DDoS landscape. We share this knowledge to raise awareness and
at the same time help businesses and institutions to deal with this type
of threat. The sophisticated attack methods that are being reported by
TSA SOC teams, along with growing regional geopolitical issues predict a
challenging 2020 for us all.

The Global DDoS Threat Report 2019 provides detailed expert analysis
of the global DDoS threat landscape and provides factual data on
monitored global and regional attacks seen by Netscout’s Advanced
Threat Level Analysis System.

                                                                               3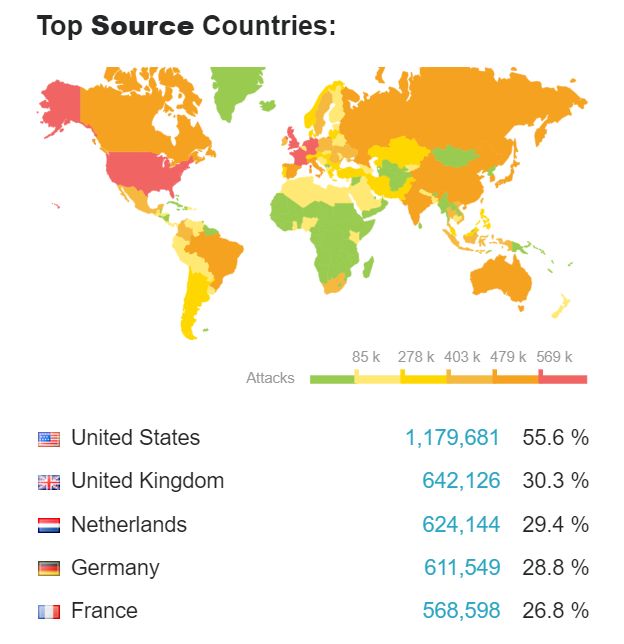
GLOBAL DDoS TRENDS
AND HIGHLIGHTS
2019 Review

This section provides details of the security highlights witnessed during 2019 and detailed
statistics of DDoS attacks
T SA | GLOBAL DDoS THREAT REPORT

                                    DDoS attacks targeted at the online presence and infrastructure of businesses has been
                                    for many years, and we think will remain, one of the top five reported threats for online
                                    organisations around the globe. The TSA have provided solutions to customers to protect
                                    themselves from these attacks and in doing so has built up a significant expertise in this

      DDoS                          area. The highlights of 2019 we have below just show how inventive and determined
                                    attackers are. These attacks and the extortion that often follows, suggest that until the
                                    money derived from these attacks dries up, our report will never open with the statement
                                    “All quiet on the DDoS front".

                                               Key Highlights
                                                                H1 2019 vs H1 2018

                                               Attacks in the range or 100-400Gbps are considered large because they can disable large
AT TACK FREQUENC Y GROWS                       parts if not entire ISP networks but are the “juicy middle” ground between the very regular
AGAIN .                                        1-50G attacks that would typically only disable a single organisation and the enormous
Overall, global DDoS attack frequency          terabit attacks we saw in 2018. Attacks in this “juicy middle” section grew by 776 percent
grew by 39 percent between H1 2018 and         between H1 2018 and H1 2019. In comparison, the frequency of very large attacks dropped
H1 2019. Once again, we saw staggering         significantly: we saw a 40 percent reduction in attacks between 400 and 500 Gbps and a 32
growth of 776 percent in attacks between       percent decrease in attacks of more than 500 Gbps. This is to be expected, however, because
100 Gbps and 400 Gbps in size.                 we are comparing data with H1 2018 — a period that saw the arrival of memcached attacks,
                                               a vector that gave us a long list of all-time largest attacks. Thanks to collective action, very
                                               large attacks in this vector essentially have been snuffed out.
                    Global
        39 %        DDoS attack
                    frequency

                    Attacks
    776 %           100–400 Gbps                  3000              767%
                                                                    767%

                                                                        2809                                  It’s worth noting that
                                                  2500
                                                                                                              Memcached attacks first broke
                                                                                                              out H1 2018, a vector that gave
                                                                                                              us a long list of all-time largest
WIRELESS AND SATELL ITE                           2000
                                                                                                              attacks. Through collective
UNDER FIRE                                                                                                    action, these attacks have been
Attackers increasingly targeted                                                                               essentially snuffed out.
satellite communications and wireless
                                                  1500
telecommunications, which experienced a
255 percent and 193 percent increase in                                                      1048%
                                                                                             1048%
attack frequency, respectively.
                                                  1000
                                                                                                 999

    255 %         Targeting satellite
                  communications                   500                                                     338%
                                                                                                           338%
                                                                                                                              40%
                                                                                                                              40%              32%
                                                                                                                                               32%
                                                              324                         87
    193 %         Targeting wireless                                                                     47     206        25    15       19    13
                  communications                     0
                                                           100–200 Gbps               200–300 Gbps     300–400 Gbps      400–500 Gbps     500+ Gbps

                                                                2018             2019

                                                     Figure 7: Year to Year Attack Size Trends

                                                                                                                                                      5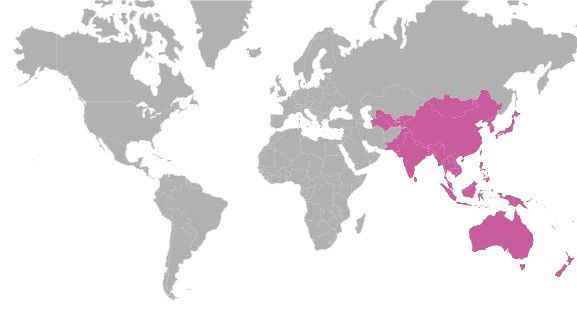
HOT AT TACK TARGETS- H1 2019                                                                      DECREASED

 SATELLITE                                            IOTECH
                                                     B                                            DIPLOMATS GET A
 COMMUNICATIONS                                      UNDER AT TACK                                BREAK
 HIT THE TOP TEN                                     The Professional, Scientific, and            The International Affairs sector,
Companies in this vital support sector               Technical Services sector jumped from        which includes everything from the
for the telecommunications and                       13th to 8th place, with a 46 percent         US State Department to immigration
broadcasting industries saw a significant            increase in max attack size.                 services to the World Bank, saw an
bump in attacks, as the sector jumped                This category includes computer              89 percent drop in attack frequency,
from 17th to 6th place year over year,               programming and design services, as well     falling from 6th place to 15th place
with a 246 percent increase in attack                as bio and nano technology research.         year over year.
frequency.

                                                                     6%
                                                                                                                           Decrease
                                                                                                                89 %
                                                                             Increase
               246 %
                                Increase
                                in attack                                    in attack                                     in attack
                                frequency                                    frequency                                     frequency

 ULL SPEED AHEAD ON
F                                                      AT TACKERS FOCUS ON                        ECOMMERCE FALLS
BRAKES                                                 WIRELESS                                   FROM THE TOP
The Motor Vehicle Brake System                         The Wireless Telecommunications Carriers   The Electronic Shopping and
Manufacturing sector saw a 1,238                       sector saw a 150 percent increase in       Mail-Order Houses sector fell
percent increase in frequency but                      frequency, while wired telecom grew at a   seven spots to 14th place, with an
a 54 percent drop in size.                             far more modest                            82 percent drop in attack frequency.
                                                       16 percent.

             1,24 %                                                                                             82 %
                                                                                                                           Decrease
                                                               150 %
                                Increase                                     Increase
                                in attack                                    in attack                                     in attack
                                frequency                                    frequency                                     frequency

BIG BUMP EDUCATION                                     INCREASED TUBE                             O THER TELCOS
                                                       STAKES                                      DISAPPEAR FROM VIEW
Colleges, Universities, and Professional
                                                       There was a 35 percent increase in
Schools moved up three slots into 9th                                                             Companies in the Other Telco sector caught a
                                                       attack frequency in the Radio and
place, with a 487 percent jump in                                                                 break, falling from 8th place to 39th place year
                                                       Television Broadcasting sector.
attack frequency.                                                                                 over year with a 99.8 percent drop in frequency
                                                                                                  and a drop in max attack size from 600 Gbps to 2.6
                                                                                                  Gbps.

                487%            Increase
                                in attack                         35 %        Increase
                                                                              in attack                    99.6 %
                                                                                                                           Decrease
                                                                                                                           in attack
                                frequency                                     frequency                                    frequency

© 2019 NETSCOUT SYSTEMS, INC. All rights reserved.

                                                                                                                                               6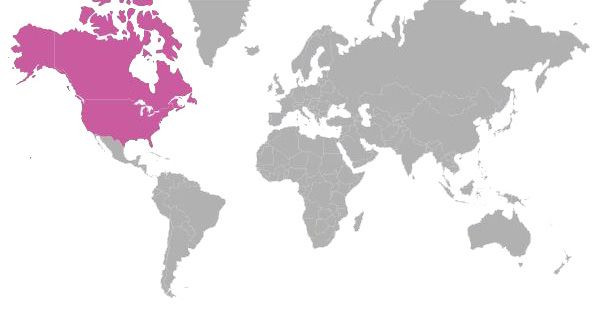
T SA | GLOBAL DDoS THREAT REPORT

                                                                GT SA | E TISAL AT GLOBAL DDoS THREAT REPORT

                       Key Highlights
                                  H2 2019 vs H2 2018

                          In comparison to H2 2018, H2 2019 saw few increases in
                          the overall frequency, attack sizes and speed, however,
GLOBAL                    not as significant as H1 comparison. The max attack
               15 %
AT TACK                   observed in year 2019 was 631 Gbps which is significantly
FREQUENC Y
                          high and capable of impacting business continuity of any
                          organization
               3.6 M
Attacks
in H2 2018

Attacks
in H2 2019     4.2 M
                          FIVE DAYS TO ATTACK
                          It can take just five days from new attack vector discovery to weaponization,
                          making these powerful attacks available to anyone with a grudge.
MAX
AT TACK SIZE   1%
                          DON´T WANT TO STUDY FOR FINALS; HIRE A BOTNET
                          An amusing story from one of our partners seen in early 2019. Test platforms
Max Attack
in H2 2018     631 GBPS   used by schools are the modern way in which the end of term exams are now
                          operated. The partner saw several attempts by unknown assailants hiring
                          well known and very cheap DDoS services available on the dark web to attack
Max Attack
in 2019        622 GBPS   these platforms in an attempt to disrupt the end of term exams. The most likely
                          beneficiaries are of course the students who haven't studied enough for their
                          exams.

PEAK SPEED
               21 %
                          7.7M           IoT devices
                                         connected to the Internet every day
Attacks
in H2 2018     723 MPPS
Attacks
in H2 2019     570 MPPS   BOTMASTERS GET SMART
                          Rapid weaponization of vulnerable services has continued as attackers take
                          advantage of everything from smart home sensors to smartphones, routers,
                          and even Apple software. On average, 7.7 million IoT devices are connected to
                          the Internet every day, many of them with known security issues or with no
                          security at all. Even worse, proof-of-concept malware has appeared, targeting
                          the untold number of vulnerable devices behind firewalls.

                                                                                                            7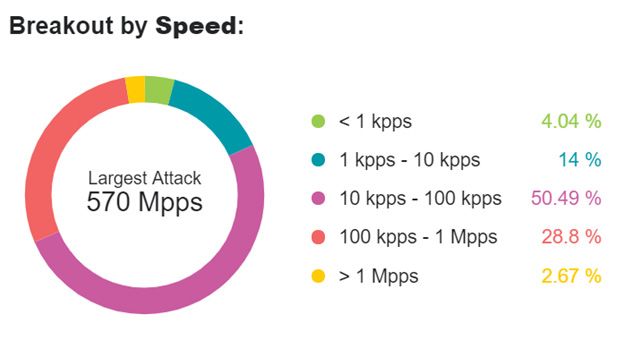
T SA | GLOBAL DDoS THREAT REPORT

                                           GT SA | E TISAL AT GLOBAL DDoS THREAT REPORT

KEY OBSERVATIONS
To botnet operators, the 7.7 million new IoT devices
connected to the Internet each day look like the most
enticing all-you-can-eat buffet in the world. After all,
many of those devices lack security or have known
security issues.

These attackers constantly scan the Internet for new vulnerable services,
taking advantage of unsecured deployments and services. And they do so with
amazing efficiency:

• It can take only five days for new attack vectors to be weaponized, making these powerful
  attacks available to anyone with a grudge.

• Even worse, attackers’ indefatigable research turns up a constant stream of new ways
  to access that alluring smorgasbord of devices. In the last six months, four new DDoS
  reflection-type attacks and one new web attack have been seen on the Internet, showing
  that the DDoS weaponization of vulnerable services is rapidly increasing.

• The 1.7 Tbps memcached attack in 2018 demonstrated that researching and launching
  new attack types can give the attackers powerful weapons that can cause havoc for
  unprepared defenders.

AND WHILE THAT’S BAD, IT’S JUST
THE BEGINNING, CONSIDER THE
FOLLOWING:
Secure Assumptions
Usually, IoT devices are deployed behind Internet gateways and firewalls and are therefore
assumed to be secure. Indeed, the ratio of IoT devices behind the firewalls versus those
directly connected to the Internet is estimated to be around 20:1.

Proof-of-Concept Malware
We have seen proof-of-concept malware specially designed to infect vulnerable
devices behind firewalls. Several businesses have had serious system outages not because
they were under attack, but because their systems were busy launching outbound DDoS
attacks.

Internal Devices
This means that the IoT botnets and resulting DDoS attacks seen in recent years represent
the tip of the iceberg compared to what might be possible when internal devices get
compromised.

                                                                                          8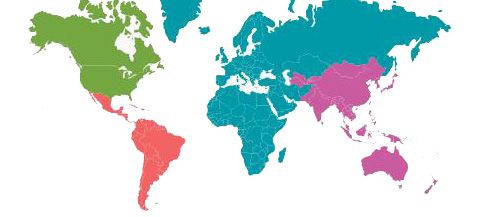
GLOBAL DDoS SITUATION
Q4 2019

A TELCO SECURITY ALLIANCE VIEW
T SA | GLOBAL DDoS THREAT REPORT

                                                                           GT SA | E TISAL AT GLOBAL DDoS THREAT REPORT

                                   GLOBAL SITUATION
   TOP GLOBAL DDoS                 Q4-2019
    AT TACK T YPES
                                   In 2019, world witnessed another surge in global Internet traffic and IoT
• VOLUME TRIC AT TACKS
                                   connected devices continued to follow their exponential growth curve. DDoS
• UDP FLOOD
                                   attacks inevitably follow these trends as attackers have quickly learnt how to
• IP FRAGMENTATION
                                   weaponise IoT devices and recruit them into their DDoS for hire services. Peak
                                   volume of 622 Gbps and peak speeds of 570Mpps are more than enough for
                                   attackers to disable or deny access to large parts of Internet service provider
Attacks:
              2.12 M               infrastructure, unless properly protected. At that magnitude not only the target of
                                   the attack can be taken offline, but tens or hundreds of other customers become
Peak
Volume:       622 GBPS             collateral damage as well.

Peak Speed:
              570 MPPS
                                   ISPs per Region
Peak
Duration:     82 DAYS*
              *81 days, 23 hours
                                        APAC          65

                                        EMEA		        169

                                        LATAM		       41

                                        NAMER		       95

                                   ATLAS data for the Global situation in Q4-19 came from 370 unique ISPs that
                                   saw and reported anomalies. If we look at the data for the whole year we
                                   can put this in context. For the whole year 487 unique ISPs reported data. By
                                   quarter however the number that reported attacks were roughly the same
                                   Q1-375, Q2-380, Q3-386, Q4-370 even though Q4 saw the largest peak attack
                                   by volume.

                                                                                                                     10
T SA | GLOBAL DDoS THREAT REPORT
GT SA | E TISAL AT GLOBAL DDoS THREAT REPORT
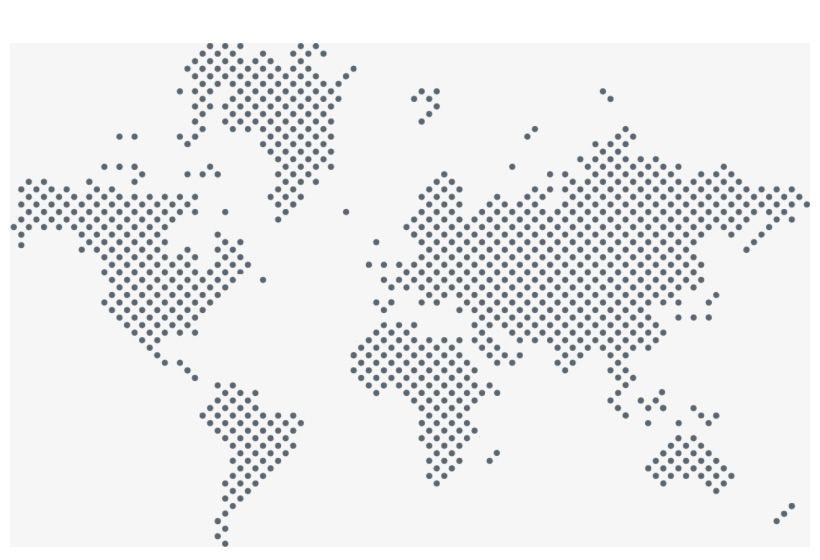
TOP COUNTRIES
Top Sources:
TOP SOURCE COUNTRIES:
Top Source Countries
Top sources signifies the top geographies TOP SOURCE COUNTRIES:
which have resources involved in the
origination of a DDoS attack based on their
IP data Geo-location.The trend of the US
being a top source country has persisted
for many years, simply due to the large
volume of Internet-connected devices in
the country.
Top Destinations:
85 k 301 k 430 k 503 k 601 k
Top destinations signifies the top Attacks
geographies which are being attacked 85 k 301 k 430 k 503 k 601 k
based on their IP data Geo-location. Again
United
United Attacks
States
States 1,193,163 55.8 %
the trend of the US being the top
destination is simply due to the size of the United
United Kingdom
Kingdom 657,080 30.7 %
United States 1,193,163 55.8 %
US Internet-connected economy.
Netherlands
Netherlands 632,325 29.5 %
United Kingdom 657,080 30.7 %
Germany
Germany 614,737 28.7 %
DDoS attacks are coordinated by what the
Netherlands 632,325 29.5 %
France
France 601,217 28.1 %
industry calls “bot masters”, people who Germany 614,737 28.7 %
control, programmatically, resources on the
France 601,217 28.1 %
Internet that they often don’t own
themselves and use to perform computer TOP DESINATION COUNTRIES:
based crimes like launching DDoS attacks.
The resources they control will bear no TOP DESINATION COUNTRIES:
Top Destination Countries
relationship at all with the nationality or
location of the ‘bot master’ themselves.
Therefore these charts will tend to follow
metrics like broadband penetration per
capita, wealth per capita, population
densities and technology adoption rates.
It is very useful to know during an attack
how likely geography based filtering
might help with attack mitigation. For
example, a solely Arabic language based 275 5k 17 k 36 k 100 k
shopping site that only delivers purchases Attacks
to UAE addresses might not need to allow 275 5k 17 k 36 k 100 k
access from countries outside of the region.
Attacks
United States 527,650 24.7 %
South Korea 179,053 8.4 %
United
United States
States 527,650 24.7 %
China
South Korea
152,239 7.1 %
South Korea 179,053 8.4 %
Indonesia
China 102,810 4.8 %
China 152,239 7.1 %
United Kingdom
Indonesia
99,987 4.7 %
Indonesia 102,810 4.8 %
United
UnitedKingdom
Kingdom 99,987 4.7 %
11T SA | GLOBAL DDoS THREAT REPORT
GT SA | E TISAL AT GLOBAL DDoS THREAT REPORT
GLOBAL FREQUENCY
Q4 - 2019
Global attack frequencies like source Attack Frecuency
and destination countries will have
a bias towards where online wealth
exists to be extorted. It however also
has a large geopolitical dimension
that other metrics don’t reveal. It is
now well known that whenever there
are political tensions between two
parties, there will be a commensurate
increase in DDoS attacks between
them as well. Attribution is very
hard to achieve because Internet
technologies provide so many ways
to participate anonymously. Many
attributions are as politically motivated Frecuency by Region
as the attacks themselves. What we do
know however is that they are often
organized by both regular citizens
with a sense of affiliation to the cause
and military assets directed by the
politicalpowers. Attack duration tells
us that most attack objectives are
achieved or fully mitigated in under 60
minutes.
Frecuency by Duration
12T SA | GLOBAL DDoS THREAT REPORT
GT SA | E TISAL AT GLOBAL DDoS THREAT REPORT
GLOBAL VOLUME
Q4 - 2019
Peak attack volume can be sometimes Peak Attack Volume
be seen to follow the same trends as
described for frequency. Increasingly,
however, peak volume is controlled
by the ‘bot master’ to be a balance
between big enough to achieve their
objective versus exposing the least
amount of the attack infrastructure to
security researchers, like our experts
in the TSA.
The 1.7 Tbps attacks of 2018 for
example were more an accident than
by design, as the attackers learnt
how to use their new weapon of
Peak Volume by Region
memcached reflection attacks.
The trend shown here could be as
much about ability to control the
attack size as it might also represent
geopolitical tension hot spots.
Breakout by Volume
13T SA | GLOBAL DDoS THREAT REPORT
GT SA | E TISAL AT GLOBAL DDoS THREAT REPORT
GLOBAL SPEED
Q4 - 2019
Global Speed records the packets per Peak Attack Speed
second (PPS) seen by all the routers
over which participating attack traffic
passes.
This is important because it can vary
significantly from other attack metrics
and is critically important to the
Internet infrastructure – routers and
servers. Whilst volume can overload
link bandwidth, PPS overloads the
CPUs and ASICs inside the routers and
servers.
Peak Speed by Region
Ultimately this attack metric results
in the same outages and attackers
will vary their use of this depending
on how good the target is able to
defend themselves. Here we see that
organizations in EMEA should be more
worried about checking their PPS
defense capabilities than those in
LATAM for instance.
Breakout by Speed
14REGIONAL DDoS SITUATION Q4-2019 EMEA APAC LATAM NAMER
T SA | GLOBAL DDoS THREAT REPORT

                                                                            GT SA | E TISAL AT GLOBAL DDoS THREAT REPORT

                                             REGIONAL DATA                                          Q4/19

                                             EMEA
      TOP GLOBAL DDoS
       AT TACK T YPES

• TOTAL TRAFFIC
• IP FRAGMENTATION
• UDP

Areas Covered
1. Europe
2. Russia
3. Middle East
4. Africa
5. Greenland

Cybercriminals never rest and take
advantage of any type of incident or
opportunity to carry out their actions.      EMEA has always been a top target destination for any kind of
i.e: summer season in the EMEA region,       security attacks and story of 2019 is no different. Year 2019 saw
as there are more chances that the           an increase in the number of attacks by 30% and 35% increase in
protection systems and teams of a
                                             attacks in Q4 2019 compared to Q4 2018.
company are less active or not well
dimensioned . Attackers can also levarage
                                             Q4 2019 period shows that 33% of the global attacks are targeted
any other security incidents related to      towards EMEA with medium average DDoS volumes and speeds.
both information or electronic security,     Volumes of such magnitude can effectively impact the communication
such as a power outage of a critical         channels and services of any organization, and at the same time can
infrastructure that can disable defense      be the initiation point for a mixed vector attack.
systems. An anti-DDoS service provided
from outside of premises can help in
theses cases.

ElevenPaths, Telefónica Cybersecurity Unit

                                                                                                                     16
T SA | GLOBAL DDoS THREAT REPORT
GT SA | E TISAL AT GLOBAL DDoS THREAT REPORT
KEY STATS EMEA STATS IN-DEPTH
Largest Attack
Attacks:
705 K
422 GBPS
Peak Volume:
570 MPPS
Peak Speed:
Peak
Duration: 41 DAYS*
*40 days, 20 hours
DDoS attacks are growing year on
year in volume, sophistication, and Frequency by Duration
frequency.
Any and all businesses with an online
presence are a potential target. At
Etisalat global security operations
centre (GSOC), we are seeing notable
increases in attack sophistication in
the region.
Attack patterns are customized for the
campaigns they launch depending on
the industry they are targeting.
Etisalat Digital Security
Top Source Countries
United States
United Kingdom
Netherlands
Germany
France
17T SA | GLOBAL DDoS THREAT REPORT
GT SA | E TISAL AT GLOBAL DDoS THREAT REPORT
REGIONAL DATA Q4/19
APAC
TOP GLOBAL DDoS
AT TACK T YPES
• TOTAL TRAFFIC
• UDP
• TCP SYN
Areas Covered
1. East Asia
2. South Asia
3. South East Asia
4. Oceania, Australia and
New Zealand
The industries that are consistently
at larger risk of attacks are financial
As APAC contains some of the worlds fastest growing and most
services and government segments.
Financial services because of their connected economies, they are also becoming hotspot for attacks
monetary value and governments DDoS attacks. APAC also recorded the peak volume for Q4 2019.
most often due to geopolitical issues.
TSA members are witnessing a steep increase in attacks with volume
We also observed the following
distribution of attacks: 60% of the total of more than 600Gbps. The attack duration has also increased, with
attacks were UDP exploits, followed 25% of attack duration lasting up to 60mins.
by IP fragmentation at 20%, and DNS
In year 2019, the longest attack duration seen is 138 days and in Q4
amplification at 13%.
2019 longest attack duration was 66 days. DDoS attacks persisting
Trustwave, a Singtel company for this long duration are impossible to mitigate without sophisticated
tools.
18T SA | GLOBAL DDoS THREAT REPORT
GT SA | E TISAL AT GLOBAL DDoS THREAT REPORT
KEY STATS APAC STATS IN-DEPTH
Largest Attack
Attacks:
587K
622 GBPS
Peak Volume:
Peak Speed:
230 MPPS
Peak
Duration: 66 DAYS*
*65 days, 12 hours
Frequency by Duration
Top Source Countries
United States
United Kingdom
Netherlands
Source: NETSCOUT ATLAS
Germany
France
19T SA | GLOBAL DDoS THREAT REPORT
GT SA | E TISAL AT GLOBAL DDoS THREAT REPORT
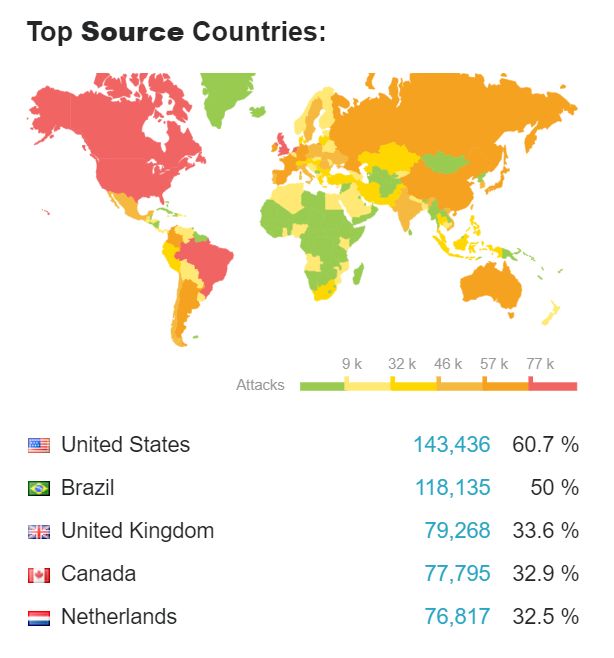
REGIONAL DATA Q4/19
LATAM
TOP GLOBAL DDoS
AT TACK T YPES
• TOTAL TRAFFIC
• AT TACKS UDP
• IP FRAGMENTATION
Areas Covered
1. Mexico
2. Central America
3. South America
Incidents with significant volumes for
the typical region connectivity but In 2019, LATAM as a region received 10% of the total global DDoS
slower compared to attacks in the other attacks.
regions. This type of attacks will mainly In Q4 2019, the TSA has witnessed attacks as high as 247Gbps, which
saturate the communication channels
would be capable to take down any critical infrastructure.
so the legitimate traffic cannot reach its
destination, thus interrupting legitimate
Also, as the economy continues to grow, LATAM also witnessed an
services. It is considered a very noisy increase in the number of DDoS attacks. Compared to last Q4 i.e. 2018,
form of attack and one of the preferred LATAM witnessed an increase of 30% attacks specifically during
ones, for example related to political the month of December which shows the growth of targeted attacks
hacktivism attacks due to the impact specially during the holiday season.
that can be achieved with them.
ElevenPaths, Telefónica Cybersecurity Unit
20T SA | GLOBAL DDoS THREAT REPORT
GT SA | E TISAL AT GLOBAL DDoS THREAT REPORT
LATAM STATS IN-DEPTH
KEY STATS Largest Attack
Attacks:
236 K
Peak Volume:
247GBPS
Peak Speed:
22.5 MPPS
Peak
Duration: 45 DAYS*
*44 days, 14 hours
Frequency by Duration
Top Source Countries
United States
Brazil
United Kingdom Source: NETSCOUT ATL
Canada
Netherlands
21TSA | GLOBAL DDoS THREAT REPORT
GT SA | E TISAL AT GLOBAL DDoS THREAT REPORT
REGIONAL DATA Q4/19
NAMER .
TOP GLOBAL DDoS
AT TACK T YPES
• TOTAL TRAFFIC
• IP FRAGMENTATION
• UDP
Areas Covered
1. United States of America
2. Canada
The trend in the US and Canada is clear:
fewer enterprises are operating their
own SOCs and more are supplementing
their SOC with third-party resources,
making hybrid SOC the new direction.
This is a reflection of the talent
shortage in cyber security. It impacts
both enterprise and service provider NAMER region containing United States of America and Canada have
organizations. always been a hot target for DDoS attacks. As the largest economy,
North America tops the list for top destinations of DDoS attacks
globally.
Netscout Threat Report Following earlier comments, NAMER could be characterized as being
wealthy and technologically advanced hence how attractive it is to
attacker.
As the region also witnesses a boom of IoT devices roll-out and mass
adoption of the same, it is also home to some of the largest botnets
networks. Thus, majority of the attacks against North America and
Canada are including the bots which are already in-country. In Q4,
region has seen 16% increase in attacks compared to Q4 2018 which
requires more more sophisticated measures to remediate.
22T SA | GLOBAL DDoS THREAT REPORT
GT SA | E TISAL AT GLOBAL DDoS THREAT REPORT
NAMER STATS IN-DEPTH
KEY STATS Largest Attack
Attacks:
1.53 M
Peak Volume:
622 GBPS
Peak Speed:
570 MPPS
Peak Duration:
66 DAYS*
*65 days, 13 hours
Frequency by Duration
Top Source Countries
United States
Canada
Source: NETSCOUT ATLAS
United Kingdom
Netherlands
Brazil
23T SA | GLOBAL DDoS THREAT REPORT
GT SA | E TISAL AT GLOBAL DDoS THREAT REPORT
CONCLUSION
Thanks to the collective efforts of the Internet community, the number of DDoS attacks based on the memcached
amplification vector, that had such a high impact in the first half of 2018, have been removed. DDoS attacks, however, still
represent a real threat that is increasing in scope and sophistication every day. The number of insecure IoT devices being
deployed is a real concern. Their recruitment into botnets has been automated and the sheer scale of their deployment
brings worryingly large and new dimensions to the attacker’s weapons store.
The sophisticated attack methods that are being reported by TSA SOC teams along with growing regional geopolitical
issues predict a challenging 2020. With data from this report, local expertise, services and partnerships, businesses are still
able to protect themselves and reduce the risk of having online business disruptions.
There are many other security issues in a CISO in-tray but it is worth remembering that none of them will be of any
importance at all whilst the organisation is offline during a DDoS attack you haven’t planned and implemented protection
for.
The alliance of large communications companies from various regions that form the TSA, together with Netscout, bring
comprehensive and reliable information that helps to understand the DDoS landscape, transmit knowledge to raise
awareness and, at the same time, helps companies and institutions to deal with this type of threat.
HOW TO DEFEND?
DEPLOY WITH SECURE BLOCK ACCESS BEST SECURITY SCAN FOR
PERIMETERS PRACTICES VULNERABILITIES
Deploy a best in class Add layers of security that Ensure that all connected Scan and 'hunt' proactively
solution that protects can block inbound threats equipment is tested for its for vulnerabilities and
stateful devices like as well as compromised compliance with security compromises of your
firewalls and load balancers client outbound best practices. Make sure network-connected assets.
with stateless devices like connections. Acknowledge the policy covers IoT and A secure perimeter is not
DDoS protection appliances. that threats can originate BYOD devices. Implement enough on its own.
from within the business as NAC to ensure compliance.
well as externally.
NEED HELP?
REACH OUT TO YOUR LOCAL TELCO SECURITY PROVIDER TO STOP THREATS BEFORE THEY REACH YOUR ENVIRONMENT
24T SA | GLOBAL DDoS THREAT REPORT
GT SA | E TISAL AT GLOBAL DDoS THREAT REPORT
About Etisalat Communications
Etisalat Group is one of the world’s leading telecom groups in emerging markets. Etisalat’s current market cap
is AED 148 billion ($40.3billion). With consolidated net revenues at AED 52.4 billion and consolidated net profit
of 8.6 billion for 2018, Etisalat ranks amongst the most profitable telecom groups in the world. Its high credit
ratings at AA-/Aa3 reflect the company’s strong balance sheet and proven long-term performance.
Headquartered in Abu Dhabi, Etisalat was established four decades ago in the UAE as the country’s first
telecommunications service provider. An international blue-chip organisation, Etisalat provides innovative
solutions and services to 141 million subscribers in 15 countries across the Middle East, Asia and Africa.
For more information, visit: www.etisalat.com
About Trustwave, a Singtel company
Trustwave is a leading cybersecurity and managed security services provider that helps businesses fight
cybercrime, protect data and reduce security risk. Offering a comprehensive portfolio of managed security
services, consulting and professional services, and data protection technology, Trustwave helps businesses
embrace digital transformation securely. Trustwave is a Singtel company and the global security arm of Singtel,
Optus and NCS, with customers in 96 countries.
For more information about Trustwave, visit: www.trustwave.com
About Telefónica Communications
Telefónica is one of the largest telecommunications companies in the world by market capitalization and number
of customers with a comprehensive offering and quality of connectivity that is delivered over world class fixed,
mobile and broadband networks. As a growing company, it prides itself on providing a differential experience
based both on its corporate values and a public position that defends customer interests.
The company has a significant presence in 14 countries and 346 million accesses around the world. Telefónica
has a strong presence in Spain, Europe and Latin America.
At ElevenPaths, Telefónica Cybersecurity Unit, we believe in the idea of challenging the current state of security,
an attribute that must always be present in technology. We’re always redefining the relationship between
security and people, with the aim of creating innovative security products which can transform the concept
of security, thus keeping us one step ahead of attackers, who are increasingly present in our digital life. We
combine the freshness and energy of a start-up with the power, experience and robustness of Telefónica to
provide solutions that enable prevention, detection and response against everyday threats in our digital world.
We build strategic alliances to provide a strengthened security to our clients. Moreover, we work jointly with
organizations and entities such as the European Commission, Cyber Threat Alliance, ECSO, EuroPol, Incibe, and
the Organization of American States (OAS). Visit: www.elevenpaths.com
About SoftBank Corp. Communications
SoftBank Corp, provides mobile communication, fixed-line communication, and Internet connection services to
consumers and corporate customers in Japan. Leveraging the innovative technologies of other SoftBank Group
companies, SoftBank Corp. is also expanding into AI, smart robotics, IoT, FinTech, cloud security and other
business sectors.
25You can also read