Time course of recovery following CrossFit Karen Benchmark Workout in trained men
←
→
Page content transcription
If your browser does not render page correctly, please read the page content below
Preprints (www.preprints.org) | NOT PEER-REVIEWED | Posted: 6 September 2021                             doi:10.20944/preprints202109.0078.v1

          Article

          Time course of recovery following CrossFit® Karen Benchmark
          Workout in trained men
          Ramires Alsamir Tibana1*, Ivo Vieira de Sousa Neto2, Nuno Manuel Frade de Sousa3, Arthur M. Zecchin-Oliveira4,
          Frederico Ribeiro Neto5 and Joao Henrique Falk Neto6.

                                      1 Graduate Program in Health Sciences, Faculty of Medicine, Federal University of Mato Grosso (UFTM),
                                        Cuiabá, Brazil; ramirestibana@gmail.com (R.A.T).
                                      2 Laboratory of Molecular Analysis, Graduate program of Sciences and Technology of Health, University of

                                        Brasilia, Brasilia, Brazil; ivoneto04@hotmail.com (I.V.S.N).
                                      3 Laboratory of Exercise Physiology, Faculty Estacio of Vitoria, Vitoria, Brazil; nunosfrade@gmail.com

                                        (N.M.F.S).
                                      4 Ribeirao Preto Medical School, University of Sao Paulo, Brazil; arthurzecchin@usp.br (A.M.Z.O).

                                      5 Paralympic Sports Program, SARAH Network of Rehabilitation Hospitals/SARAH Brasilia, Brasilia, Brazil;

                                        fredribeironeto@gmail.com (F.R.N).
                                      6 Athlete Health Lab, Van Vliet Complex, Faculty of Kinesiology, Sport, and Recreation, University of

                                        Alberta, Edmonton, AB T6G 2H9, Canada; falkneto@ualberta.ca (J.H.F.H).
                                      * Correspondence: ramirestibana@gmail.com

                                      Abstract: The study describes the acute and delayed time course of recovery following the CrossFit®
                                      Benchmark Workout Karen. Eight trained men (28.4±6.4 years; 1RM back squat 139.1±26.0 kg)
                                      undertook the Karen protocol. The protocol consists of 150 Wall Balls, aiming to hit a target 3 meters
                                      high. Countermovement jump height (CMJ), creatine kinase (CK), and perceived recovery status
                                      scale (PRS) (general, lower and upper limbs) were assessed pre, post-0h, 24h, 48h and 72h after the
                                      session. The CK concentration 24h after was higher than pre-exercise (338.4 U/L vs. 143.3 U/L; effect
                                      size: 0.74; p≤0.05). At 48h and 72h following exercise, CK concentration had returned to baseline
                                      levels. The PRS general and of the lower limbs were lower in the 24-hours post-exercise compared
                                      to pre-exercise (PRS general: 4.7 ±1.5 and 7.9 ±1.7 mmol/L; and PRS of the lower limbs: 4.0 ±2.5 and
                                      7.9 ±0.8, respectively). The PRS general, lower, and upper limbs were reduced at 48-post exercise
                                      compared to 72-hours post-exercise scores. Our findings provide insights into the fatigue profile
                                      and recovery in acute CrossFit® and can be useful to coaches effectively design the daily session.

                                      Keywords: Functional Fitness; High intensity Functional training; Periodization; Overreaching;
                                      Muscle recovery

                                      1. Introduction
                                            CrossFit® training program is characterized by utilizing high training volume and
                                      using large exercise types in high intensity [1]. In the end of 2000 decade, these kinds of
                                      programs spread in the world, growing the number of practitioners and popularity [2].
                                      Through the innumerous benefits described before [3], CrossFit® seems to be secure and
                                      effective when coaches precisely control different important tools to measure properly
                                      intensity and stress levels [4,5].
                                            The training session contemplates the development of multiple physical abilities,
                                      starting with the weightlifting exercises (clean & jerk, snatch, and its variations),
                                      powerlifting exercises (bench press, overhead press, front, and back squat) and lastly the
                                      metabolic conditioning [6,7]. A recently systematic review considered that CrossFit®
                                      training session normally causes a substantial metabolic stress, leading to metabolite
                                      accumulation (e.g., lactate up to 18 mmol/L) and increased markers of muscle damage
                                      (interleukin-6 - IL-6, and creatine kinase – CK, up to 24h post- exercise) [8]. High levels of
                                      muscular fatigue, assessed via changes in countermovement jump performance, are also

           © 2021 by the author(s). Distributed under a Creative Commons CC BY license.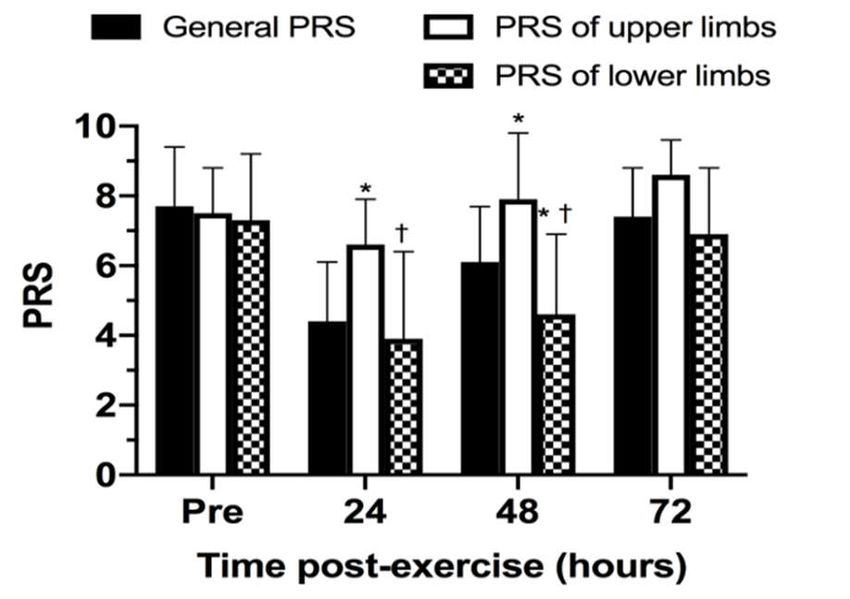
Preprints (www.preprints.org) | NOT PEER-REVIEWED | Posted: 6 September 2021                    doi:10.20944/preprints202109.0078.v1

                                    seen immediately after the sessions, with the effects lasting up to 48 hours, depending on
                                    the characteristics of the session performed [9,10].
                                          The greater metabolic stress induced in a CrossFit® session may lead to exercise-
                                    induced muscle damage (EIMD), particularly when a high volume of repetitions is
                                    performed, with EIMD being even greater if the participants are unaccustomed to the
                                    exercises performed [11]. When comparing the perceptual responses and post-exercise
                                    physical disfunction between a CrossFit® session and a session based on the guidelines
                                    of the American College of Sports Medicine, Drum et al. [12] found significant differences
                                    between sessions. CrossFit® participants reported a higher rating of perceived exertion
                                    (RPE) and a greater perceived number of hard training days per week. Feelings of
                                    excessive fatigue, muscle soreness, muscle swelling, shortness of breath, muscle pain to
                                    light touch, and limited movement in muscles used during exercise within 48-hours post-
                                    exercise were also higher in CrossFit® participants. These responses following CrossFit®
                                    sessions highlight the importance of understanding the time-course of recovery following
                                    sessions to minimize the risk of maladaptation due to insufficient recovery between
                                    sessions and optimize training prescription.
                                          Recovery is a multi-faceted restorative process relative to time, considering the
                                    individual’s physiological and psychological responses to a stimulus [13]. Due to the
                                    multifactorial nature of recovery, the assessment of the recovery–fatigue continuum
                                    should be relative to the demands of the sport [13]. While performance measures
                                    represent the most sport-specific outcomes, other physiological and psychological
                                    measures provide integral information on an athlete’s recovery and biophysical balance
                                    [13]. Stress markers such as creatine kinase (CK,) counter movement jump (CMJ) and
                                    recovery status (PRS) remain largely unknown in CrossFit® training programs, despite
                                    their potential to identify athletes’ recovery status following exhaustive sessions[7].
                                          Despite the importance of performance and physiological markers, the perception of
                                    an athlete’s readiness to perform describes a critical determinant of recovery. In this
                                    context, Laurent et al. [14] proposed a perceived recovery status scale (PRS), which is
                                    similar but opposite to a perceived exertion scale (RPE) (10–12). Both scales are based on
                                    the subjective physical and mental feelings of the athlete. However, while the rating of
                                    perceived exertion (RPE) is utilized during or after a session, the PRS scale is utilized prior
                                    to the session to identify the athletes’ recovery status. The PRS scale has been shown to be
                                    a reliable tool to assess the perceived recovery state of individuals, demonstrating
                                    accuracy (> 80%) in identifying changes in performance when the individuals reported
                                    feelings of being under-recovered [14]. A practical method of assessing athletes’ recovery
                                    status prior to a session might allow coaches and practitioners to adjust the training
                                    session to match the individuals’ perceived recovery status, optimizing training outcomes
                                    [14,15].
                                          Furthermore, previous resistance training studies utilizing protocols to the point of
                                    muscle failure [16] or with a high-volume of training [17,18] have demonstrated an
                                    impairment in performance in the subsequent session. However, the acute responses to a
                                    high-volume and fatiguing CrossFit® session, particularly in relation to changes in
                                    performance, exercise-induced muscle damage, and perceived recovery status have yet to
                                    be investigated. Understanding the time-course of recovery following the strenuous
                                    sessions can provide coaches and practitioners with important information to optimize
                                    training programs. This is particularly important in CrossFit®, since many sessions
                                    require a near-maximal or maximal effort from the participants.
                                          Therefore, the purpose of this study to describe the acute and delayed time course of
                                    recovery following the CrossFit® benchmark workout Karen, in healthy trained subjects.
                                    Based on the current evidence, it was hypothesized that the participants would experience
                                    a significant increase in CK that would be mirrored by changes in CMJ and the
                                    participant’s perceived recovery status.

                                    2. Materials and Methods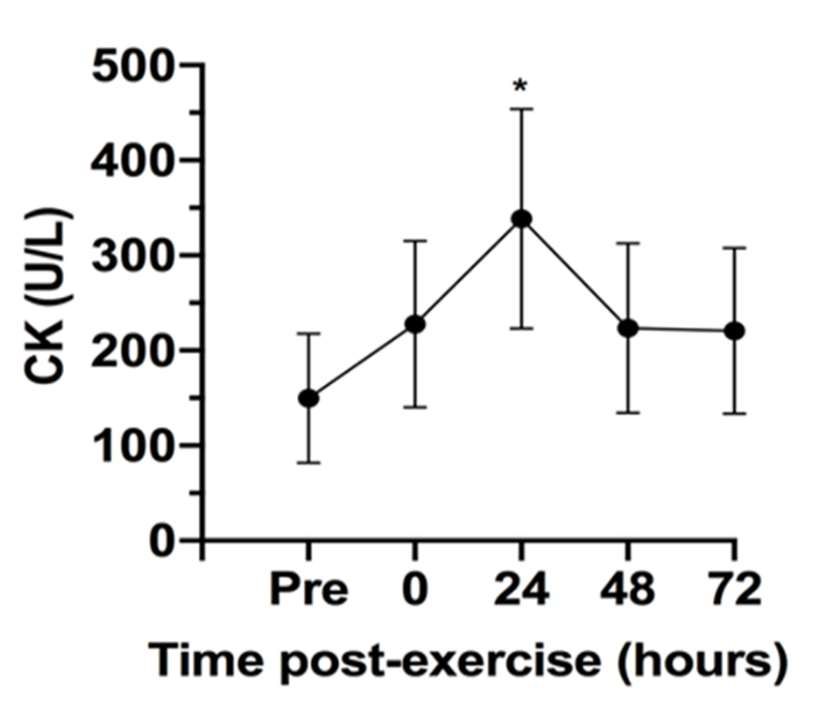
Preprints (www.preprints.org) | NOT PEER-REVIEWED | Posted: 6 September 2021                              doi:10.20944/preprints202109.0078.v1

                                          2.1. Participants
                                               Eight male subjects (age 28.4±6.4 years old; 1RM back squat: 139.1±26.0 kg) were
                                          recruited. All participants were free of injury and known illness, were not using drugs to
                                          enhance performance, and had a minimum experience of six months with CrossFit®.
                                          Indirect maximal aerobic capacity (VO2 max) and strength (1RM) are described in table 1,
                                          and were assessed two weeks before the protocol. Participants were advised to refrain
                                          from ingesting alcohol for 24 h before all tests, avoid any exercise 48h before and 72h after
                                          the protocol, and to maintain their normal daily diet during the study. All participants
                                          signed an informed consent document, and the study was approved by the University
                                          Research Ethics Committee for Human Use (2.698.225; 7 June 2018) and conformed to the

                                          2.2. Protocol
                                               This study was designed to analyze the time-course effects of the CrossFit®
                                          benchmark workout Karen on the physiological, psychological and performance
                                          responses in trained adult men. The protocol consists of 150 repetitions of Wall Balls, with
                                          athletes aiming to hit a target 3 meters high, using a 9 kg medicine ball. In this study, the
                                          benchmark Karen was the independent variable, while the dependent variables consisted
                                          of changes in creatine kinase, countermovement jump and perceived recovery status scale
                                          (PRS) (general, lower, and upper limbs) (Figure 1).

               Figure 1. Schematic study design and timeline used to examine the time-course effects of Creatine kinase, height of counter
               movement jump and perceived recovery scale.

                                          2.3. Karen Protocol
                                                The CrossFit® WOD Karen corresponds to a timed training of one element (medicine
                                          ball throws; 9.07 kg for a height of 3 meters), which consists of completing a task of 150
                                          throws of medicine ball to wall in the shortest time possible, therefore, a higher
                                          performance in this WOD corresponds to a shorter time to do it.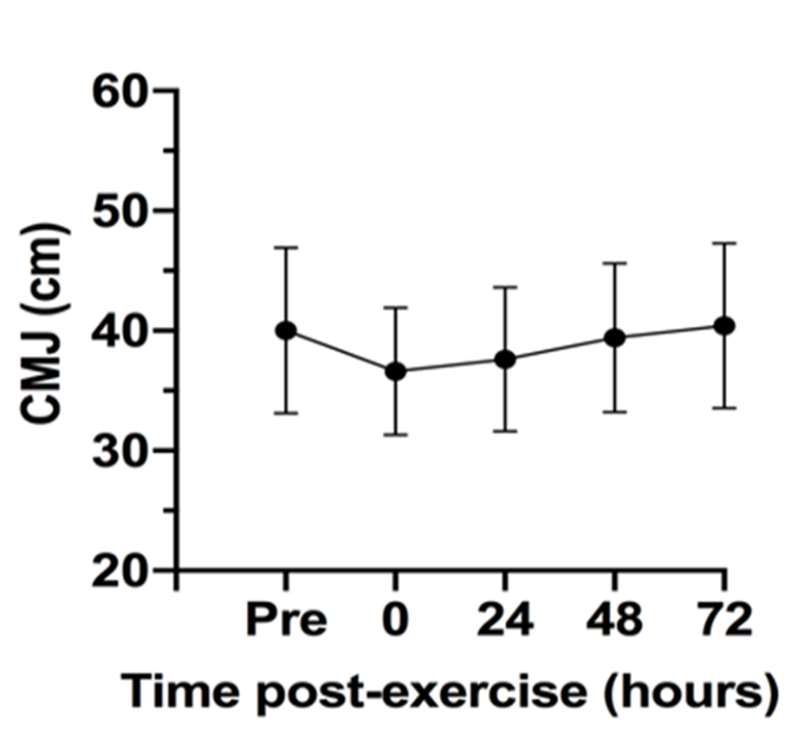
Preprints (www.preprints.org) | NOT PEER-REVIEWED | Posted: 6 September 2021                       doi:10.20944/preprints202109.0078.v1

                                    2.4. Creatine kinase and blood Lactate analysis
                                         Whole-blood creatine kinase activity was assessed from a single fingertip capillary
                                    sample with the subject in a seated position. After pre-warming the hand, a sample of
                                    blood (30 μL) was obtained and analyzed using a colorimetric assay procedure (Reflotron,
                                    Boehringer Mannheim, Germany)[7]. Before each test session, quality control (calibration)
                                    measurements were undertaken according to the manufacturer’s recommendations. The
                                    ‘‘normal’’ reference range for creatine kinase activity, as provided by the manufacturer, is
                                    24–195 U/L.
                                         The blood lactate collection, management, and analysis were determined according
                                    to Falk Neto et al.[19]. Capillary blood samples were collected through a transcutaneous
                                    puncture on the medial side of the tip of the middle finger using a disposable hypodermic
                                    lancet. Blood lactate concentration was determined by photometric reflectance on a val-
                                    idated Portable Accutrend Plus system (Roche, Sao Paulo, Brazil).

                                    2.5. Perceived Recovery Scale (PRS)
                                         Immediately before the training sessions, the athletes were asked to rate their per-
                                    ceived recovery status according to the PRS Scale. The scale (Figure 2) ranges from 0 to
                                    10, with a score of “0” indicating that the athlete is “very poorly recovered / extremely
                                    tired” and a score of “10” indicates that the athlete is “very well recovered / highly ener-
                                    getic”. A score of 0, 1, or 2, is associated with an expected reduction in performance,
                                    while a score of 8, 9, or 10, means an improvement in performance is expected. The range
                                    of values between 3 and 7 indicate that no changes in performance are expected [14].

                                    Figure 2. The Perceived Recovery Status Scale according to Laurent et al. [14].

                                    2.6. Countermovement jump height
                                         For the Countermovement jump height, a jump platform (JUMP SYSTEM 1.0, Cefise
                                    LTDA.), was used. The athlete was positioned, barefoot, in the interior of platform, with
                                    hands fixed at the waist. The test consisted of realizing a maximal vertical jump, with a
                                    free countermovement. Two jumps were realized with a 1-minute interval. It was consid-
                                    ered the highest jump in centimeters

                                    2.7. Statistical analysis
                                         The Shapiro-Wilk test was used to assess data distribution. Descriptive data are pre-
                                    sented as mean and standard deviation for all outcomes. A repeated-measures ANOVA
                                    was used to compare group means (pre, post-0, 24h, 48h, and 72h). When significant, a
                                    Bonferroni test for multiple comparisons was used. The Bartlett test was used to verify the
                                    homogeneity of variances. Cohen’s d effect size (ES) was calculated to verify the magni-
                                    tude of the difference between pre-test, post-test, 24h, 48h, and 72h. The ES was classified
Preprints (www.preprints.org) | NOT PEER-REVIEWED | Posted: 6 September 2021 doi:10.20944/preprints202109.0078.v1
in the following manner: trivial (d lower than 0.10); small (d between 0.10-0.29); moderate
(d between 0.30-0.49); large (d between 0.50-0.69); very large (d between 0.70-0.89), and
perfect (d of 0.90 or greater). The Pearson product moment correlation was used to eval-
uate correlations between all outcomes. Correlation coefficient values were classified as
very weak (below 0.20); weak (0.20 to 0.39); moderate (0.40 to 0.69); high (0.70 to 0.90) and
very high (>0.90) [20]. The outlier labeling rule was used to detect outliers, and discrepan-
cies. Outlier values were calculated by the difference between the 25th and 75th percen-
tiles multiplied by a factor (2.2). The result is then subtracted from the 25th percentile and
added to the 75th percentile. The IBM SPSS Statistics package (version 22.0; SPSS Inc, Ar-
monk, NY) was used. Statistical significance was set at 5% (P≤0.05; two-tailed).
3. Results
3.1. Completion time
The average time to complete the 150 repetitions of wall ball was 613.82 (±115.03)
seconds. The fastest participant completed the exercise session in 506 seconds and the
slowest in 805 seconds (Table 1).
Table 1. Total group demographics.
n 8
Age (years) 28.4 ± 6.4
Body mass (kg) 80.4 ± 4.9
Height (m) 1.8 ± 0.1
VO2 (ml/kg/min) 53.6 ± 3.5
Row 2K (sec) 447.3 ± 17.1
Back squat (kg) 139.1 ± 26.0
Back squat rel (kg/kg) 1.5 ± 0.7
Karen (sec) 613.8 ± 115.0
Note : Variables are expressed as mean and standard deviation (±) . Rel: relative (back squat/body
mass).
3.2. Physiological, Biochemical, and Neuromuscular Responses
The blood lactate concentration and RPE were significantly higher post-exercise com-
pared to the pre-exercise session (blood lactate concentration: 3.2 mmol/L ±0.6 and 17.5
mmol/L ±3.0 mmol/L; and RPE: 1.8 ±0.3 and post: 9.5 ±0.4, respectively) (Table 2).
Table 2. Comparisons of main outcomes for pre-test, post-test, 24h, 48h, and 72h.
Pre Post 24h 48h 72h
RPE 1.8 ± 0.3 9.5* ±0.4 - - -
Lactate (mmol) 3.2 ± 0.6 17.5* ± 3.0 - - -
Creatine Kinase (U/L) 143.2 ± 65.7 265.3 ± 133.5 338.4* ± 115.6 223.6 ± 89.3 204.3 ± 92.8
PRS general 7.9 ± 1.7 - 4.7*± 1.5 6.9 ± 0.3 7.9† ± 0.4
PRS upper limbs 7.5 ± 1.3 - 6.9 ± 1.1 8.8† ± 0.8 9.3*† ± 0.4
PRS lower limbs 7.9 ± 0.8 - 4.0* ± 2.5 5.1* ± 1.8 7.6† ± 0.5
Countermovement
40.0 ± 6.9 39.0 ± 2.9 38.7 ± 1.8 40.0 ± 2.8 42.0 ± 3.4
Jump (cm)
Note : Variables are expressed as mean and standard deviation (±). *Significant difference with
pre-test (p≤0.05); †Significant difference with 24h (p≤0.05). PRS: perceived recovery status scale;
RPE: rate of perceived exertion.
The CK concentration 24 hours after the exercise session was significantly higher than
the pre-exercise (338.4 U/L vs. 143.3 U/L, respectively) (Table 2 and Figure 1A). No signif-
icant differences were observed between 48- and 72-hours after exercise and pre-exercise
concentrations (Table 2 and Figure 3). However, the effect size of pre and post-test and
24h and 48h were classified as large and very large (ES: 0.87, 85.2% and ES: 1.63, -33.9%,
respectively) (Table 3).Preprints (www.preprints.org) | NOT PEER-REVIEWED | Posted: 6 September 2021 doi:10.20944/preprints202109.0078.v1
Figure 3. Variables are expressed as mean and standard deviation (±). Creatine kinase concentra-
tion (CK) results during pre-test, post-test, 24h, 48h and 72h post-test. *p ≤ 0.05 for pre.
Table 3. Effect size and percentual differences of all outcomes for the five-time assessment points (pre-test, post-test, 24h,
48h, and 72h). The PRS scales were compared between pre-test and 24h.
PRe-Post Post-24h 24h-48h 48h-72h
RPE 17.25 (432.0%) - - -
Lactate (mmol) 3.86 (444.0%) - - -
Creatine Kinase (U/L) 0.87 (85.2%) 0.74 (27.6%) 1.63 (-33.9%) 0.20 (-8.6%)
PRS general 1.82 (-40.0%) 1.67 (45.8%) 3.40 (14.3%)
PRS upper limbs 0.44 (-7.6%) 3.33 (26.3%) 1.00 (6.3%)
PRS lower limbs 1.33 (-50.7%) 0.70 (32.7%) 1.50 (47.2%)
Countermovement Jump (cm) 0.45 (-2.7%) 0.42 (-0.8%) 0.72 (3.3%) 0.13 (5.0%)
Note : Variables are expressed as percentual differences. PRS: perceived recovery scale.
There were no significant differences in CMJ height in any of the time points assessed
when compared to pre-test values (immediately post, and 24h, 48h, and 72h post training)
(Table 3 and Figure 4). Percentual changes between CMJ test results between pre- and
post-session, post-session and 24-hours post, and 24h to 48h post session, showed effect
sizes of moderate to very large magnitude (ranging from 0.42 to 0.72; -0.8% to 3.3%) (Table
3).
Figure 4. Variables are expressed as mean and standard deviation (±). Height of counter move-
ment jump (CMJ) results during pre-test, post-test, 24h, 48h and 72h post-test.
Figure 5 shows the general, lower and upper limbs of the PRS pre- and post-exercise
session. The scores of PRS general and PRS of the lower limbs were significantly lower inPreprints (www.preprints.org) | NOT PEER-REVIEWED | Posted: 6 September 2021 doi:10.20944/preprints202109.0078.v1
the 24-hours post-exercise session compared to the pre-exercise (PRS general: 4.7 ±1.5 and
7.9 ±1.7 mmol/L; and PRS of the lower limbs: 4.0 ±2.5 and 7.9 ±0.8, respectively). The PRS
general, lower and upper limbs were also significantly lower at 48-post exercise compared
to 72-hours post-exercise scores (Table 2 and Figure 6). The effect size for PRS scales was
classified as large and very large in all-time comparisons. The only exception was the PRS
for the upper limbs between pre-test and 24h (ES: 0.44, -7.6%) (Table 3).
Figure 5. Variables are expressed as mean and standard deviation (±). Perceived recovery scale
(PRS) of the upper limbs (UL) (A) general (B) and lower limbs (LL) results during pre-test, post-
test, 24h, 48h and 72h posttest. *Significant difference with pre-test (p≤0.05); †Significant difference
with 24h (p≤0.05).Preprints (www.preprints.org) | NOT PEER-REVIEWED | Posted: 6 September 2021 doi:10.20944/preprints202109.0078.v1
Figure 6. Variables are expressed as mean and standard deviation (±) Comparison between scores
of general, lower and upper limbs of perceived recovery scale (PRS) at different time points. *p ≤
0.05 for general PRS; † p ≤ 0.05 for PRS of upper limbs.
3.3. Correlations
At the pre-test, the CK concentration was inversely and significantly correlated with
the PRS (r=-0.926; p≤0.05). In addition, the CMJ height presented a very high correlation
with the PRS of the lower limbs (r=0.902; p≤0.05). There were no significant correlations
between the PRS scale, CK concentration, and CMJ height immediately post-test, or at 24h,
48h, and 72h post-test.
4. Discussion
The aim of this study was to analyze the physiological, biochemical, and neuromus-
cular responses following a fatiguing CrossFit® benchmark session. The main findings
partially confirm the initial hypothesis, revealing i) significant increases in blood lactate
post-exercise; ii) an elevated CK concentration 24h post-exercise, returning to baseline lev-
els 48h post-exercise; iii) a significant change in the participants’ perceived recovery status
for upper and lower limbs 24h post-exercise when compared to baseline, with PRS values
for the lower and upper limbs showing different rates of recovery at 24h and 48h post
exercise, with the lower limbs recovering slower than the upper limbs. The findings high-
light the significant physiological, biochemical and neuromuscular changes following a
CrossFit® session, and provide a better understanding of the time-course of recovery of
these markers.
CrossFit® training sessions are often performed with near-maximal or maximal ef-
forts, leading to a significant metabolic stimulus [6,8]. In this context, blood lactate con-
centration has been utilized as a reliable marker to assess the intensity of different sessions
of CrossFit® [19]. While changes in blood lactate concentrations will be dependent on the
duration and intensity of the sessions performed, previous research has shown that dif-
ferent CrossFit® sessions incur high blood lactate levels. Timon et al. [21] utilized two
different protocols (Protocol 1: AMRAP of of Burpees and Toes to Bar increasing repeti-
tions (1–1, 2–2, 3–3…) in five minutes; Protocol 2: three rounds of 20 repetitions of Wall
Ball (9 kg) and 20 repetitions of Power Clean (a load of 40% 1RM) in the shortest possible
time), with a similar lactate response in the protocol 2 as the one seen in this study
(18.38±2.02 mmol/L vs 17.5 mmol/L ±3.0 mmol/L). Interestingly, protocols that do not use
an external load (protocol 1) showed a smaller lactate response, even when the perception
of effort was similar between sessions. It is likely that the overall intensity of the sessions
elicits a high metabolic response, even in the absence of an external load. For example, a
session requiring participants to complete as many rounds as possible (AMRAP) of two
exercises (burpees and toes to bar) still elicited a high blood lactate response (13.3±1.87
mmol/L). Tibana et al. [6], analyzing a session that involved AMRAP of double unders
and rowing, and Maté-Muñoz et al. [22] with a session that consisted of performing a
single exercise (double unders), also reported a higher lactate response (9.05 ± 2.56 vs 10.37Preprints (www.preprints.org) | NOT PEER-REVIEWED | Posted: 6 September 2021 doi:10.20944/preprints202109.0078.v1
± 2.91 mmol/L), respectively. In addition, even when the intensity of a CrossFit® session
was manipulated to be performed at a lower perception of effort (6 out of 10, utilizing the
Borg CR-10 scale), the lactate responses were still quite high (12.8 ± 3.2 mmol/L) [23]. Pre-
vious studies have demonstrated that the metabolic responses induced by a training ses-
sion are related to the required time to recover from this stimulus. Considering the high
physiological stress induced by CrossFit® sessions, even when there is no external load,
or when the intensity is controlled, understanding the time-course of recovery from these
sessions is essential to ensure athletes can optimize their training.
The serum CK is often utilized to understand the recovery status of participants fol-
lowing a training session given its easy of collection and analysis [24]. The CK concentra-
tions can be raised due to exercise induced muscle damage as a consequence of intense
and prolonged training. The peak of serum CK normally occurs about 8h after a strength
training session, and values can remain elevated for up to 96 hours when the exercise is
focused on eccentric phase of the movement. Importantly, CK values have been associated
with muscle injury [24,25]. Studies involving CrossFit® showed significant increases in
CK, that could be pathological due the extremally high values [26,27]. The present study
found increases in CK 24h post-exercise, with the values returning to baseline 48h post-
exercise. These results are in agreement with Timón et al. [21] that evaluated the time
course of recovery of CK in response to two different CrossFit® WODs. Both sessions
induced a significant increase in CK levels 24h post-exercise, with the values decreasing
and returning to baseline 48h post-exercise. Similarly, Tibana et al.[7] showed that after
five workouts over three consecutive days of competition the peak of CK concentration
occurred 24h post-exercise (~698.7 U/L). Thus, it seems that when the CrossFit® session
don’t elicit increases in CK concentration that could be considered pathological, CK con-
centrations might return to baseline levels within 48 hours.
In addition to changes in CK concentrations, changes in CMJ height has also been
utilized as a reliable fatigue marker in different sports [10]. A recent study analyzed CMJ
height as a measure to assess neuromuscular fatigue following a CrossFit® competition
[7]. The CMJ jump height was significantly reduced 24-hours post competition, with the
values collected at 48h and 72h post competition not different from baseline. Similarly,
Tibana et al. [6] demonstrated that consecutive days of CrossFit® training, despite elicit-
ing significant metabolic changes, did not lead to impairments in muscle power. Consid-
ering that CrossFit® sessions vary often in the exercises performed and consequently,
muscle groups utilized, and their duration, it is possible that CMJ height might have lim-
ited application as a measure to monitor neuromuscular fatigue, particularly after single
bouts of exercise.
While objective measures (CK and CMJ height) indicate that the participants might
be fully recovered from a strenuous session within 24 to 48 hours, psychobiological mon-
itoring of the athlete’s perceived recovery state indicates that 48 to 72 hours might be
needed for the athletes to return a point where performance is expected to be the similar
or improved, based on the PRS. Psychobiological monitoring of training status is a non-
invasive and non-exhaustive measure of assessing fitness (e. g. stress, fatigue), and also
presents an effective and inexpensive measure to assess individual responses to training
and competition20. Despite its possibility as a tool to monitor current training status,
Bishop et al.[28] reported that there is still a limited knowledge by trainers and athletes
about how to utilize such tools in different sports to optimize training intensity yielding
optimal recovery in day-to-day. The results in this study show a different time course of
recovery for upper and lower limbs, with the athlete’s perceiving the lower limbs to re-
quire a longer recovery time. This has practical significance in CrossFit® where coaches
and practitioners might use this information to prescribe the next training bout based on
the athletes’ perceived recovery (general, upper, and lower limbs). Moreover, the PRS can
provide further information about the athletes’ feelings of fatigue, lack of energy, and re-
covery, allowing coaches the possibility of determining the intensity of the subsequent
session to reduce the level of physiologic stress and to manipulate the athlete’s training
load [19,23].Preprints (www.preprints.org) | NOT PEER-REVIEWED | Posted: 6 September 2021 doi:10.20944/preprints202109.0078.v1
Monitoring the athlete’s recovery status is essential to ensure proper recovery be-
tween training sessions and optimize training prescription [24]. The results in this study
demonstrate that a practical, non-invasive approach to monitoring the participant’s re-
covery following a strenuous CrossFit® session might provide essential information for
coaches and practitioners. In particular, the time-course of recovery according to the PRS
is similar to that of the CK responses, with both measures reaching its most extreme values
24 hours after the training session. However, while CK responses recover faster in the
subsequent 24 hours, the athletes’ perceived recovery might show a slower improvement,
particularly for the lower limbs based on the protocol used in this study. Therefore, this
study demonstrates that the PRS may be useful in allowing appropriate adjustments in
training intensity or volume in CrossFit® based on the athletes’ recovery status. Athletes
and CrossFit® practitioners commonly complete various training sessions throughout a
week and the PRS can be used to assess the athletes’ training readiness ahead of their daily
session or following a programmed rest day. Considering the potentially detrimental ef-
fects of performing numerous maximal or near-maximal CrossFit® sessions in a short pe-
riod of time [29], such approach can potentialize training adaptations while helping to
reduce the incidence of muscle injuries and the onset of non-functional overreaching.
Some limitations of the present study must be emphasized. Particularly, the reduced
numbers of participants, the lack of control over the participants’ diet prior to the test
must be acknowledged. In addition, caution is advised when extrapolating the results of
the current study to other populations or individuals of different training experience. Fu-
ture studies of a similar nature should include other critical biomarkers and an upper limb
power measures to elucidate the time course of recovery and whether a state of fatigue
truly occurred. Further longitudinal studies analyzing fatigue status and recovery in re-
sponse to CrossFit® training in several days using similar methods can be relevant to
deeper to understanding of the training inducing performance, fatigue and recovery in
different subjects. Furthermore, additional studies comparing different volumes, intensi-
ties and WOD with distinct time points could improve understanding of the fatigue pro-
file.
5. Conclusions
In summary, a single CrossFit® session using repeated wall-ball movements elicited
a significant level of metabolic stress, along with an increase in CK levels in the 24-hours
after the exercise session. More importantly, the results showed the potential utility of the
PRS scale as noninvasive tool for accurately monitoring recovery status in CrossFit® prac-
titioners. Coaches, sport scientists, and practitioners are advised to implement the use of
the PRS to obtain important insights into the fatigue profile and recovery status of the
participants. This information can be useful to coaches to optimize training prescription
and to minimize the potential detrimental effects associated with the performance of re-
peated high-intensity sessions of CrossFit®.
Author Contributions: Conceptualization, Tibana, R.A.; Sousa Neto, I.V; Sousa and Falk Neto, J.H
; methodology, Tibana, R.A; formal analysis, Sousa, N.M.F; investigation, Tibana, R.A.; Sousa Neto,
I.V; Sousa, N.M.F; Zecchin-Oliveira, A.M; Neto, F.R; Falk Neto, J.H; Resources; Zecchin-Oliveira,
A.M; Neto, F.R; Falk Neto, J.H; data curation, Sousa, N.M.F; writing—original draft preparation,
Tibana, R.A.; Sousa Neto, I.V; Sousa and Falk Neto, J.H; writing—review and editing, Tibana, R.A.;
Sousa Neto, I.V; Sousa and Falk Neto, J.H; visualization, Tibana, R.A.; Sousa Neto, I.V; Sousa,
N.M.F; Zecchin-Oliveira, A.M; Neto, F.R; Falk Neto, J.H ; supervision, Falk Neto, J.H. All authors
have read and agreed to the published version of the manuscript.
Funding: This research received no external funding.
Institutional Review Board Statement: The study was conducted according to the guidelines of the
Declaration of Helsinki, and approved by the University Research Ethics Committee for Human
Use (2.698.225; 7 June 2018).
Informed Consent Statement: Informed consent was obtained from all subjects involved in the
study.Preprints (www.preprints.org) | NOT PEER-REVIEWED | Posted: 6 September 2021 doi:10.20944/preprints202109.0078.v1
Acknowledgments: We thank all volunteers for participation.
Conflicts of Interest: The authors declare no conflict of interest.
References
1. Tibana, R.A.; de Sousa Neto, I.V.; Sousa, N.M.F.; Romeiro, C.; Hanai, A.; Brandao, H.; Dominski, F.H.; Voltarelli, F.A. Local
Muscle Endurance and Strength Had Strong Relationship with CrossFit((R)) Open 2020 in Amateur Athletes. Sports (Basel) 2021,
9, doi:10.3390/sports9070098.
2. Aune, K.T.; Powers, J.M. Injuries in an Extreme Conditioning Program. Sports Health 2017, 9, 52-58,
doi:10.1177/1941738116674895.
3. Meyer, J.; Morrison, J.; Zuniga, J. The Benefits and Risks of CrossFit: A Systematic Review. Workplace Health Saf 2017, 65, 612-
618, doi:10.1177/2165079916685568.
4. Dominski, F.H.; Siqueira, T.C.; Tibana, R.A.; Andrade, A. Injuries in functional fitness: an updated systematic review. J Sports
Med Phys Fitness 2021, 10.23736/S0022-4707.21.12218-2, doi:10.23736/S0022-4707.21.12218-2.
5. Tibana, R.A.; Sousa, N.M.F.; Prestes, J.; Feito, Y.; Ferreira, C.E.; Voltarelli, F.A. Monitoring Training Load, Well-Being, Heart
Rate Variability, and Competitive Performance of a Functional-Fitness Female Athlete: A Case Study. Sports (Basel) 2019, 7,
doi:10.3390/sports7020035.
6. Tibana, R.A.; de Almeida, L.M.; Frade de Sousa, N.M.; Nascimento Dda, C.; Neto, I.V.; de Almeida, J.A.; de Souza, V.C.; Lopes
Mde, F.; Nobrega Ode, T.; Vieira, D.C., et al. Two Consecutive Days of Crossfit Training Affects Pro and Anti-inflammatory
Cytokines and Osteoprotegerin without Impairments in Muscle Power. Front Physiol 2016, 7, 260, doi:10.3389/fphys.2016.00260.
7. Tibana, R.A.; Prestes, J.; NMF, D.E.S.; VC, D.E.S.; O, D.E.T.N.; Baffi, M.; Ferreira, C.E.S.; Cunha, G.V.; Navalta, J.W.; Trombeta,
J., et al. Time-Course of Changes in Physiological, Psychological, and Performance Markers following a Functional-Fitness
Competition. Int J Exerc Sci 2019, 12, 904-918.
8. Claudino, J.G.; Gabbett, T.J.; Bourgeois, F.; Souza, H.S.; Miranda, R.C.; Mezencio, B.; Soncin, R.; Cardoso Filho, C.A.; Bottaro,
M.; Hernandez, A.J., et al. CrossFit Overview: Systematic Review and Meta-analysis. Sports Med Open 2018, 4, 11,
doi:10.1186/s40798-018-0124-5.
9. Cooper, C.N.; Dabbs, N.C.; Davis, J.; Sauls, N.M. Effects of Lower-Body Muscular Fatigue on Vertical Jump and Balance
Performance. J Strength Cond Res 2020, 34, 2903-2910, doi:10.1519/JSC.0000000000002882.
10. Claudino, J.G.; Cronin, J.; Mezencio, B.; McMaster, D.T.; McGuigan, M.; Tricoli, V.; Amadio, A.C.; Serrao, J.C. The
countermovement jump to monitor neuromuscular status: A meta-analysis. J Sci Med Sport 2017, 20, 397-402,
doi:10.1016/j.jsams.2016.08.011.
11. Jacob, N.; Novaes, J.S.; Behm, D.G.; Vieira, J.G.; Dias, M.R.; Vianna, J.M. Characterization of Hormonal, Metabolic, and
Inflammatory Responses in CrossFit(R) Training: A Systematic Review. Front Physiol 2020, 11, 1001,
doi:10.3389/fphys.2020.01001.
12. Drum, S.N.; Bellovary, B.N.; Jensen, R.L.; Moore, M.T.; Donath, L. Perceived demands and postexercise physical dysfunction in
CrossFit(R) compared to an ACSM based training session. J Sports Med Phys Fitness 2017, 57, 604-609, doi:10.23736/S0022-
4707.16.06243-5.
13. Kellmann, M.; Bertollo, M.; Bosquet, L.; Brink, M.; Coutts, A.J.; Duffield, R.; Erlacher, D.; Halson, S.L.; Hecksteden, A.; Heidari,
J., et al. Recovery and Performance in Sport: Consensus Statement. Int J Sports Physiol Perform 2018, 13, 240-245,
doi:10.1123/ijspp.2017-0759.
14. Laurent, C.M.; Green, J.M.; Bishop, P.A.; Sjokvist, J.; Schumacker, R.E.; Richardson, M.T.; Curtner-Smith, M. A practical
approach to monitoring recovery: development of a perceived recovery status scale. J Strength Cond Res 2011, 25, 620-628,
doi:10.1519/JSC.0b013e3181c69ec6.
15. Sikorski, E.M.; Wilson, J.M.; Lowery, R.P.; Joy, J.M.; Laurent, C.M.; Wilson, S.M.; Hesson, D.; Naimo, M.A.; Averbuch, B.;
Gilchrist, P. Changes in perceived recovery status scale following high-volume muscle damaging resistance exercise. J Strength
Cond Res 2013, 27, 2079-2085, doi:10.1519/JSC.0b013e31827e8e78.
16. Goulart, K.N.O.; Resende, N.M.; Drummond, M.D.M.; Oliveira, L.M.; Lima, F.V.; Szmuchrowski, L.A.; Fujiwara, R.T.; Couto,
B.P. Time-course of changes in performance, biomechanical, physiological and perceptual responses following resistance
training sessions. Eur J Sport Sci 2021, 21, 935-943, doi:10.1080/17461391.2020.1789227.
17. Ferreira, D.V.; Gentil, P.; Soares, S.R.S.; Bottaro, M. Recovery of pectoralis major and triceps brachii after bench press exercise.
Muscle Nerve 2017, 56, 963-967, doi:10.1002/mus.25541.
18. Bartolomei, S.; Sadres, E.; Church, D.D.; Arroyo, E.; Gordon, J.A., III; Varanoske, A.N.; Wang, R.; Beyer, K.S.; Oliveira, L.P.;
Stout, J.R., et al. Comparison of the recovery response from high-intensity and high-volume resistance exercise in trained men.
Eur J Appl Physiol 2017, 117, 1287-1298, doi:10.1007/s00421-017-3598-9.
19. Falk Neto, J.H.; Tibana, R.A.; de Sousa, N.M.F.; Prestes, J.; Voltarelli, F.A.; Kennedy, M.D. Session Rating of Perceived Exertion
Is a Superior Method to Monitor Internal Training Loads of Functional Fitness Training Sessions Performed at Different
Intensities When Compared to Training Impulse. Front Physiol 2020, 11, 919, doi:10.3389/fphys.2020.00919.
20. Hopkins, W.G.; Marshall, S.W.; Batterham, A.M.; Hanin, J. Progressive statistics for studies in sports medicine and exercise
science. Med Sci Sports Exerc 2009, 41, 3-13, doi:10.1249/MSS.0b013e31818cb278.Preprints (www.preprints.org) | NOT PEER-REVIEWED | Posted: 6 September 2021 doi:10.20944/preprints202109.0078.v1
21. Timon, R.; Olcina, G.; Camacho-Cardenosa, M.; Camacho-Cardenosa, A.; Martinez-Guardado, I.; Marcos-Serrano, M. 48-hour
recovery of biochemical parameters and physical performance after two modalities of CrossFit workouts. Biol Sport 2019, 36,
283-289, doi:10.5114/biolsport.2019.85458.
22. Mate-Munoz, J.L.; Lougedo, J.H.; Barba, M.; Canuelo-Marquez, A.M.; Guodemar-Perez, J.; Garcia-Fernandez, P.; Lozano-
Estevan, M.D.C.; Alonso-Melero, R.; Sanchez-Calabuig, M.A.; Ruiz-Lopez, M., et al. Cardiometabolic and Muscular Fatigue
Responses to Different CrossFit(R) Workouts. J Sports Sci Med 2018, 17, 668-679.
23. Tibana, R.A.; de Sousa, N.M.F.; Cunha, G.V.; Prestes, J.; Fett, C.; Gabbett, T.J.; Voltarelli, F.A. Validity of Session Rating
Perceived Exertion Method for Quantifying Internal Training Load during High-Intensity Functional Training. Sports (Basel)
2018, 6, doi:10.3390/sports6030068.
24. Halson, S.L. Monitoring training load to understand fatigue in athletes. Sports Med 2014, 44 Suppl 2, S139-147,
doi:10.1007/s40279-014-0253-z.
25. Hyatt, J.P.; Clarkson, P.M. Creatine kinase release and clearance using MM variants following repeated bouts of eccentric
exercise. Med Sci Sports Exerc 1998, 30, 1059-1065, doi:10.1097/00005768-199807000-00006.
26. Tibana, R.A.; Sousa, N.M.F.; Cunha, G.V.; Prestes, J.; Navalta, J.W.; Voltarelli, F.A. Exertional Rhabdomyolysis after an Extreme
Conditioning Competition: A Case Report. Sports (Basel) 2018, 6, doi:10.3390/sports6020040.
27. Meyer, M.; Sundaram, S.; Schafhalter-Zoppoth, I. Exertional and CrossFit-Induced Rhabdomyolysis. Clin J Sport Med 2018, 28,
e92-e94, doi:10.1097/JSM.0000000000000480.
28. Bishop, P.A.; Jones, E.; Woods, A.K. Recovery from training: a brief review: brief review. J Strength Cond Res 2008, 22, 1015-1024,
doi:10.1519/JSC.0b013e31816eb518.
29. Nicholas Drake, J.S., Michael J. Carper, Derek A. Crawford. Effects of Short-Term CrossFit Training: A Magnitude-Based
Approach. Journal of Exercise Physiology Online 20, 111-133.You can also read