TM CAPITAL EQUIPMENT
RENTAL AND DEALER REPORT
←
→
Page content transcription
If your browser does not render page correctly, please read the page content below

TM CAPITAL EQUIPMENT RENTAL AND DEALER REPORT
Founded in 1989, TM Capital is the client-first investment
    banking team advising industry-leading companies across
    North America and around the world. In everything we do, our
    professionals share a relentless commitment to engineering
    extraordinary outcomes with an unmatched standard of
    client care. Over the last three decades, we have completed
    more than 350 transactions with a combined value in excess
    of $25 billion. With offices in Atlanta, Boston and New York,
    our mission critical capabilities include: complex mergers
    and acquisitions; debt and equity financings; minority and
    majority recapitalizations; restructurings; and board advisory
    services. TM Capital is also a founding member of Oaklins,
    the world’s most experienced mid-market M&A advisor with
    700 M&A professionals in 60 offices operating in the major
    financial centers around the world. For more information,
    please visit www.tmcapital.com.

2                                                                    Building Products Report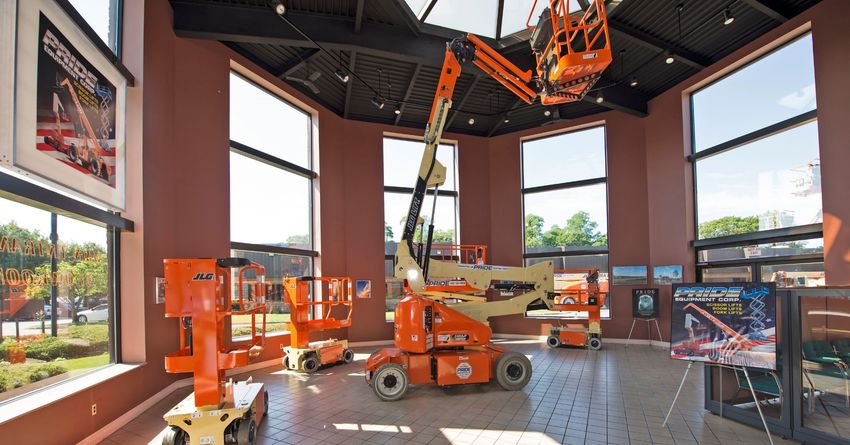
INTRODUCTION

  OVERVIEW      MISSING THE MATH      FAVORABLE SECULAR PROSPECTS
  PAGE 5        PAGE 8                PAGE 10

  EQUIPMENT RENTAL SECTOR

  OVERVIEW      M&A TRENDS
  PAGE 13       PAGE 17

  EQUIPMENT DEALER SECTOR

  OVERVIEW      M&A TRENDS
  PAGE 24       PAGE 28

  MARKET DATA

                RECENT EQUIPMENT      RECENT EQUIPMENT
  VALUATIONS    RENTAL TRANSACTIONS   DEALER TRANSACTIONS
  PAGE 32       PAGE 33               PAGE 35
Section Title                                                       3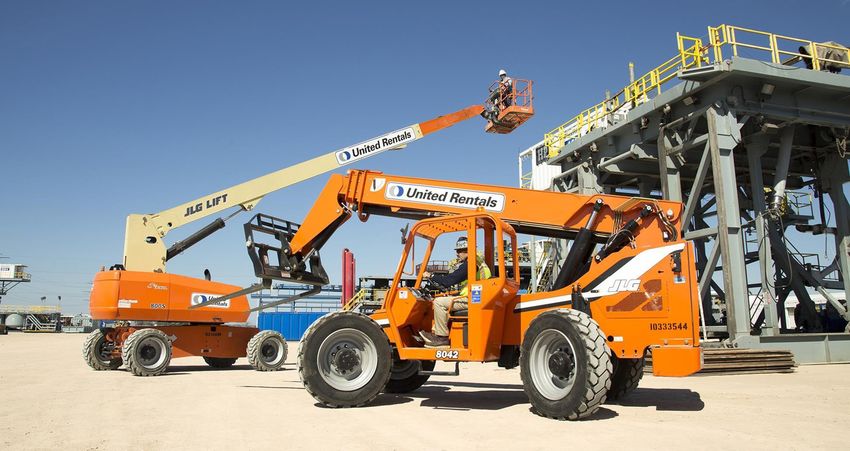
TM CAPITAL EQUIPMENT RENTAL AND
DEALER SECTOR EXPERIENCE

EQUIPMENT RENTAL

                                            A PORTFOLIO COMPANY OF
                                                                                     HAS BEEN ACQUIRED BY
      A PORTFOLIO COMPANY OF

                                              HAS BEEN ACQUIRED BY

       HAS BEEN ACQUIRED BY
                                                                                     THE U.S. OPERATION OF
                                            A PORTFOLIO COMPANY OF

      A PORTFOLIO COMPANY OF

                                                                                    A PORTFOLIO COMPANY OF
                                            COMPLETED A SENIOR DEBT
                                                FINANCING WITH
        HAS BEEN ACQUIRED BY
                                                                                    HAS BEEN RECAPITALIZED BY

EQUIPMENT DEALER

    A PORTFOLIO COMPANY OF

                                                           A PORTFOLIO COMPANY OF     A PORTFOLIO COMPANY OF
     HAS BEEN ACQUIRED BY
                                                           Ironwood Management
                               HAS BEEN ACQUIRED BY        Partners Fund II, LP
                                                                                       HAS BEEN ACQUIRED BY
    A PORTFOLIO COMPANY OF                                   HAS BEEN ACQUIRED BY

4                                                                                            Equipment Rental Report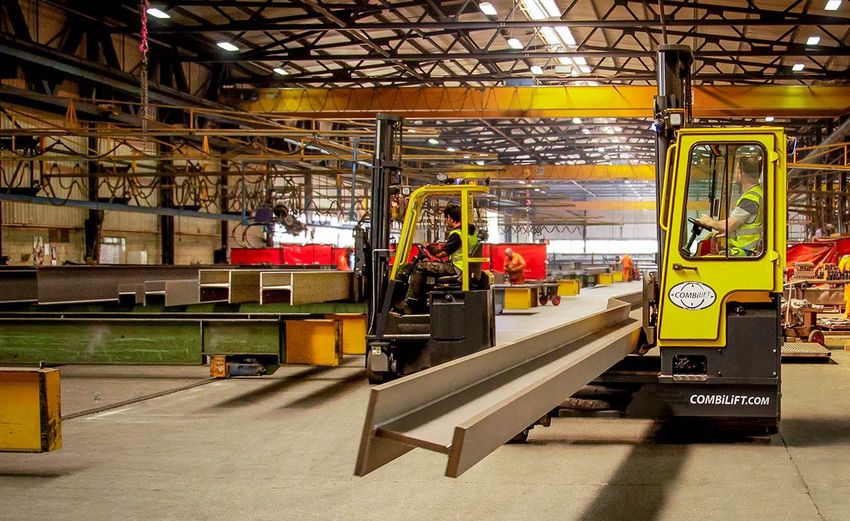
INTRODUCTION
OVERVIEW
Prior to mid-March, the Equipment Rental and Equipment Dealer sectors performed generally in line with expectations.
However, as has been the case with nearly all sectors of the economy, the COVID-19 pandemic led to a sudden and
sharp decline in both rental and dealer activity. Following the immediate drop, several public company earnings calls
indicated that activity, while below normal, had stabilized.
Looking beyond the current COVID-19 headwinds, the Equipment Rental and Equipment Dealer sectors are well
positioned to benefit from the long-term macro commercial construction, civil construction and infrastructure demand
trends that have fueled growth over the past several years. In addition to these macro trends, various segment-specific
drivers will contribute to recovery and growth. This Sector Spotlight will highlight the macroeconomic, industry and
M&A trends supporting the long-term outlook in both the Equipment Rental and Equipment Dealer sectors.
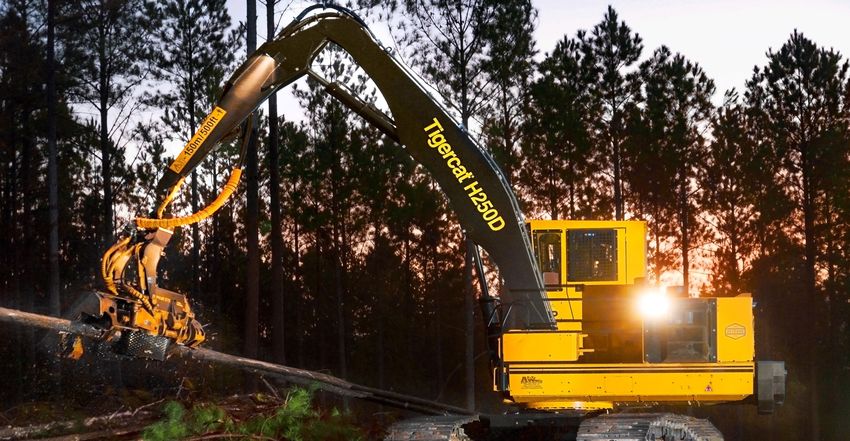
EVOLUTION OF THE EQUIPMENT RENTAL AND DEALER SECTORS
The history of the U.S. Equipment Rental sector is characterized both by growth and evolution. What was once a small,
highly fragmented sector primarily consisting of local, independent tool shops, is now a multi-billion-dollar industry
with an enhanced ability to address the ever-expanding rental needs of both small contractors and national accounts.
The two largest players, United Rentals and Ashtead (via Sunbelt, its U.S. operations), continue to drive growth through
acquisitions and organic initiatives. Nevertheless, consolidation is in the early innings, and the landscape remains
highly fragmented.
Although corporate buyers are driving the bulk of consolidation on a total-dollar basis, financial investors have
been drawn to the market to capitalize on the sector’s enduring trends. Rental companies are ready-made platform
investments conducive to building economies of scale and exploiting both organic and bolt-on growth opportunities.
These companies can expand without territorial constraints and can leverage scale, service and technology to capture
market clearing share. The biggest challenge that most financial investors face when contemplating investments in
the Equipment Rental sector is the perceived “capital intensity,” which often results in dampened interest and/or below
market valuations. It is our view that this is an incorrect assumption, and on page 8 we discuss why financial
sponsors may be “missing the math” on the compelling cash flow dynamics of both the Rental and Dealer
sectors.
The U.S. Equipment Dealer sector has also evolved meaningfully over time. Much like the Equipment Rental sector, the
Equipment Dealer sector remains highly fragmented – but for different reasons. Many dealers built their business on
the backs of one or more exclusive territory relationships with major equipment OEMs. Although dealers benefit from
the “protected moat” of exclusive territory, contracts with OEMs typically limit dealer consolidation through “rights of
required consent” clauses. Thus, dealer growth has historically been limited to absorbing an adjacent, frequently under-
performing dealer or adding new equipment lines, with the latter pathway sometimes resulting in a fragmented focus
and requiring additional investment in parts and service. Candidly, many OEMs prefer the natural imbalance created
by the relationship of big-OEM vs. small-dealer. OEMs hold the strongest hand, dictating terms of the exclusive territory
agreements and even weighing heavily on the outcomes of M&A processes and strategic growth plans. While certain
dealers, such as numerous multi-generational dealers within the Caterpillar (NYSE: CAT) and John Deere (NYSE: DE)
ecosystems, have built solid financial foundations, many smaller dealers partnered with newer OEM entrants have not
established similar financial strength.
Following the Great Recession, we have seen some shifts in OEMs’ mentality regarding consolidation. Many OEMs
now understand that having dealers with both the scale and financial strength to drive growth and weather downturns
may be more strategic to their own growth objectives. While this evolving mindset has naturally fostered strategic-led
M&A, it has also allowed financial investors, particularly long-term family office investors, to begin to enter the sector. In
addition, financial investors are compelled by the increasing percentage of total gross margin (often in excess of 65%)
derived from recurring parts and service.
5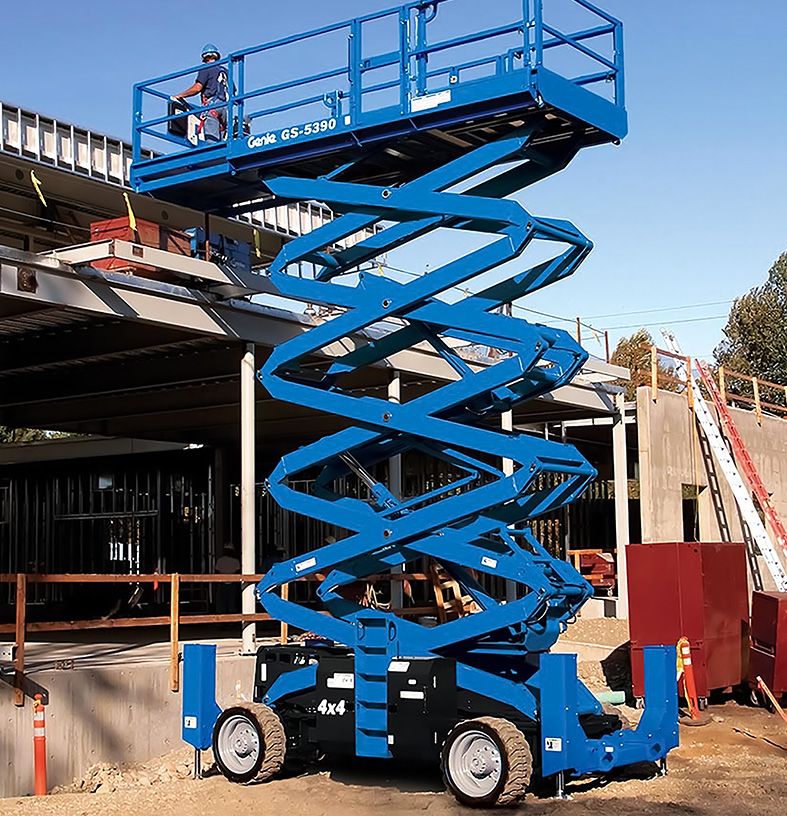
KEY SECTOR TRENDS
Several key trends are driving the evolution of the Equipment Rental and Equipment Dealer sectors, including:
    • Continued Consolidation – OEM and sector participants seek to grow market share, regional density,
      share-of-wallet and diversification across end markets, which, combined with increased financial investor
      interest, is driving M&A volume
    • Application of Technology – In an already capital-intensive industry, Equipment Rental and Equipment
      Dealer participants are investing heavily in technology infrastructure and customer-centric interfaces to
      improve productivity, streamline costs and better serve customers – wresting market share from smaller,
      less well-capitalized participants
    • Proliferation of Specialty Equipment – Historically, the Equipment Rental and Equipment Dealer
      sectors were dominated by a few key OEMs with a limited product scope. Today, participants have
      access to a vast assortment of specialty equipment from a range of OEMs to better meet the specific
      needs of customers. This creates an opportunity to build “trusted product advisor” and entrenched “one-
      stop-shop” relationships with customers – again at the expense of smaller, less well-capitalized or more
      narrowly focused competitors
    • Increasing Convergence Between Equipment Rental Companies and Dealers – Historically, dealers
      focused on the sale of equipment and parts and service. During the Great Recession, many dealers
      were forced under financial pressure to extend their offerings to include longer-term rental or rent-to-
      own options. While they are not set up to compete with rental players for the logistically complex short-
      term rental, they increasingly overlap for the longer-term and often coveted higher-utilization rental
      opportunities

SUMMARY M&A DYNAMICS
The following dynamics are building competitive pressure and increasing the urgency of M&A:
    • Increasing Financial Investor Interest – Within the Rental sector, market consolidation is inspiring
      greater financial investor interest, primarily from private equity, to build platform investments. The Dealer
      sector, driven by greater OEM receptivity and the attractive mix of highly profitable, recurring parts and
      service revenue, also presents a compelling investment. However, family office investors – which from an
      OEM’s perspective closely resemble traditional family-owned dealers – have taken the lead in the Dealer
      sector
    • Evolving M&A Models Among Large Corporate Players – Strategic buyers are pursuing more refined
      approaches to M&A. Some are focused on building national scale while others are focused on product
      specialization, end market diversification, regional density and/or OEM alignment. This diversity of M&A
      strategies results in increased transaction volume as large corporate buyers pursue targets specific to
      individual growth plans
    • Valuable Customer Base – The greatest profit opportunity often resides with small and mid-sized
      customers that prioritize a “trusted product advisor” or “one-stop-shop” relationship over the most
      competitive pricing. It can take years to develop a broad base of such profitable customers, hence strategic
      players often see M&A as an attractive option to increase this base
    • Increased M&A Discipline – There is greater scrutiny behind assessing the strategic, financial and
      cultural merits of a given transaction. The early days of consolidation are past; today, a seller must offer
      “strategic importance” – or a clear path to achieving it – in order to attract a premium valuation

6                                                                                                Equipment Rental Report
In our experience, the best positioned sellers are those that demonstrate leadership in either a given value-
added product vertical or geography; have a valuable customer base; and can benefit from aligning with
a larger parent or from a new financial partner’s capital and direction. As an illustration of valuation, the
following chart highlights a set of public rental and dealer companies. While operating in an arguably
deeper and broader M&A market than the Dealer sector, rental business models trade at a lower valuation
given the perceived impact of required capital expenditures under a traditional view of free cash flow. The
Dealer sector, while experiencing a less robust M&A market, trades at a higher valuation primarily driven
by the higher percentage of recurring parts and service revenue and protected territories, which result in
superior gross margins and performance stability over time.

HISTORICAL EQUIPMENT RENTAL AND DEALER ENTERPRISE VALUE / EBITDA TRADING MULTIPLES
14.0x

                                                                                11.7x
12.0x
                                                                                              10.6x
                                       9.9x                                                                                           9.9x
10.0x
         8.7x                                     9.1x          9.1x
                        8.3x                                                                                                                                        8.2x
                                      7.4x       6.9x                                       7.8x                 7.7x                                    7.4x
8.0x
                        6.7x                                                    6.5x

        5.7x                                                   5.4x                                                                5.8x
6.0x                                                                                                                                                                 5.1x
                                                                                                            4.9x                                  4.7x

4.0x

2.0x

         12/31/11       12/31/12     12/31/13   12/31/14   12/31/15    12/31/16         12/31/17      12/31/18          12/31/19          LTM-3/31/20           LTM-6/30/20

        Note: Data as of 6/30/2020
                                                                       Rental
                                                                       .                 Dealer

Key Sector Trends                                                                                                                                                           7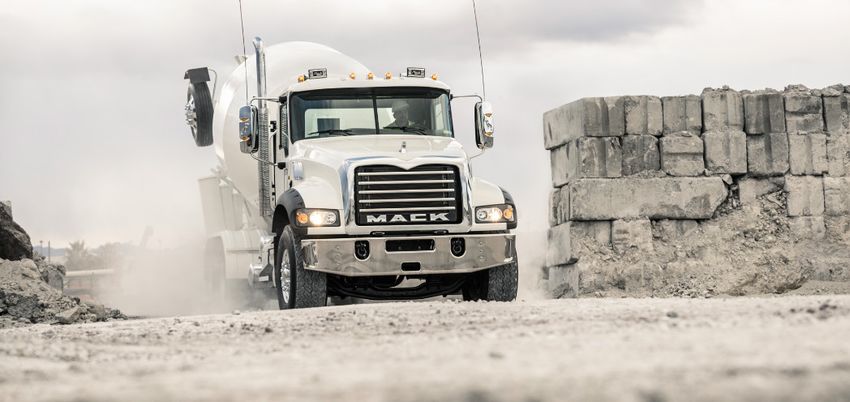
INTRODUCTION
       MISSING THE MATH
Having completed multiple Equipment Rental transactions, we believe that many financial investors often misread
the fundamental economics of this sector. These companies have much greater flexibility in adding or subtracting
productive assets than what is typically the case for industrial companies. Even more, they can do so on a 100%
or near-100% leverage basis, with asset-based financing tied to underlying asset values rather than cash flow. As
proven in the Great Recession, even in the worst of times, almost all rental companies were able to “defleet,” generate
substantial cash flows and position themselves for quick recovery.

Most financial investors look at “EBITDA minus Capex” as the basis for valuation. We see five problems with that
methodology:

    • First, it is critical to separate “maintenance capex” (what is needed to keep the fleet constant) versus “growth
      capex” (which is discretionary). Growth is often the larger component

    • Second, given accelerated depreciation, rental companies are far more tax efficient than other basic businesses

    • Third, as evidenced when it makes sense to “defleet” (for example, at the end of a large, multi-year project or
      during a market contraction), capex can actually be a positive number as assets are sold – contributing substantial
      incremental cash flow

    • Fourth, as we illustrate below, capex is not a “fixed charge” that should be deducted from EBITDA; it is a use of cash
      that may be deferred, fully financed, or funded from cash flow

    • Lastly, and importantly, the multiples already reflect the presence of higher-than-typical capex

Public rental companies trade at enterprise values typically between 5.5x to 7.0x EBITDA – well below broader market
multiples. Where potential buyers try to apply that lower multiple, which already reflects the capex burden, against an
“EBITDA minus Capex” amount, they “double count” the impact of capex and render themselves uncompetitive.

This issue is further compounded by EBITDA itself being understated. In the instance of “used equipment sales”, where
COGS is burdened with out-of-period costs for capex that was paid out years earlier, the operating cash flow generated
is much higher than that which is reflected in the calculation of GAAP EBITDA.
HOW A RENTAL COMPANY OWNER’S “CHECK BOOK” SEES CASH FLOWS

HOW A TYPICAL PRIVATE EQUITY INVESTOR ENVISIONS CASH FLOWS

8                                                                                                        Equipment Rental Report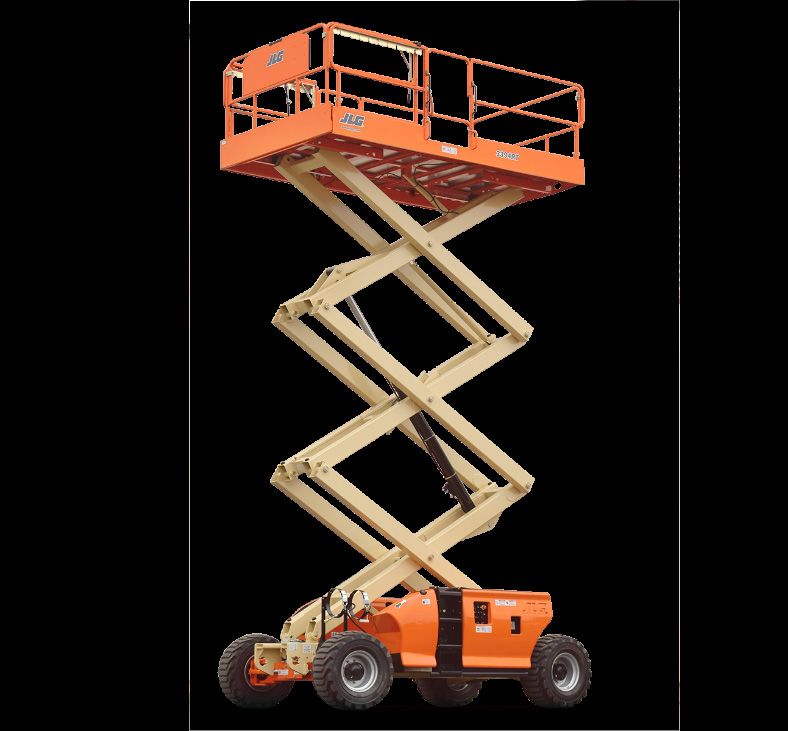
Having completed multiple Equipment Dealer transactions, we see private equity funds and other financial investors
facing similar challenges in arriving at market-clearing valuations in this sector, as well. Again, there are several elements:

  • First, and similar to rental companies, dealers often require a significant investment in fleet – but a fleet held as
    “inventory-for-sale.” Like rental companies, dealers typically have “floor-plan financing” which is often 100% or
    almost-100% asset-based financing. Again, these businesses can carry higher leverage at a significantly lower cost
    to support their inventory versus a typical cash flow acquisition loan

  • Second, given geographic exclusivity, current and future EBITDA is highly protected

  • Third, as we will discuss further, cash flow benefits from highly profitable, recurring aftermarket parts and services
    as well as contractual long-term rentals

Nevertheless, we believe that the Dealer sector still carries a “stigma” as an off-balance sheet warehouse of OEM
product. In reality, given advances in OEM cycle-times, dealers today can act more as agents for orders versus purely
stocking dealers.

The public market has clearly digested this divergence, with publicly-held dealers trading in the 8.5x to 10x range – a
3x to 4x multiple premium over publicly-held rental companies. Despite this, we see private market investors often
ascribing a zero to a modest 1x to 2x multiple premium to comparably sized rental companies.

Perhaps this accounts for the advantage family offices seem to enjoy as investors in this sector. Interestingly, many
family offices have histories that include automotive, truck, ag, construction and other dealerships. It may be that
this intrinsic comfort level with the attractiveness of these dealer cash flow elements supports a lower discount rate
and a higher valuation versus traditional private equity. That said, we believe we are seeing the early innings of more
private equity groups stepping into this arbitrage and securing, along with their family office brethren, market-leading
platforms for their LPs at attractive relative multiples.

Introduction: Missing The Math                                                                                               9
INTRODUCTION
                                  FAVORABLE SECULAR PROSPECTS
                                        Equipment rentals and sales are closely tied to the performance of downstream markets, including
                                        homebuilding, commercial construction and infrastructure. In recent years, robust economic activity
                                        in these areas supported significant demand. Post-pandemic dislocation, these sector tailwinds
                                        provide a runway for further expansion for years to come.

   U.S. HOUSING STARTS REMAIN WELL BELOW HISTORICAL AVERAGES
   Coming out of the 2009 trough, U.S. single- and multi-family housing starts grew gradually. In February 2020, single-
   family starts reached a decade high; however, they remained 41% below the prior peak - partially the result of the
   very steep drop in income from 2007 to 2012. Multi-family starts, generally associated with rental housing, have seen
   stronger growth, peaking in January 2020 with 612,000 starts, 45% above their prior peak, as slow growth in income
   levels deferred aspirations for homeownership. As of May 2020, there has been a notable drop in both single- and
   multi-family housing starts as COVID-19 impacts new construction.

   HOUSING STARTS OVER TIME
      2000
       2,000
(thousands)
      1800
               1,800
           1600
               1,600
           1400
               1,400
           1200
               1,200
   Thousands

           1000
               1,000
               800
                800
               600
                600
               400
                400
               200
                200
                —
                 1990         1992       1994       1996         1998     2000         2002      2004      2006     2008    2010     2012     2014       2016        2018    2020
                       1990

                                 1992

                                            1994

                                                       1996

                                                                   1998

                                                                            2000

                                                                                         2002

                                                                                                   2004

                                                                                                             2006

                                                                                                                     2008

                                                                                                                              2010

                                                                                                                                      2012

                                                                                                                                                2014

                                                                                                                                                          2016

                                                                                                                                                                      2018

                                                                                                                                                                              2020

 Source: Federal Reserve Bank of St. Louis                                         Housing Starts - Single Family                    Housing Starts - Multi Family

                                                              Housing Starts - Single-Family               Housing Starts - Multi-Family

                     Source: Federal Reserve Bank of St. Louis

   10                                                                                                                                                      Equipment Rental Report
AGING U.S. COMMERCIAL BUILDING STOCK AND CONSTRUCTION SPENDING
The existing stock of commercial buildings in the U.S. is aging, necessitating the construction of new
buildings or significant investment to renovate older buildings. Roughly two-thirds of commercial
buildings are over 30 years old, and the American Society of Civil Engineers rated U.S. infrastructure a
D+. Despite this backdrop, the U.S. construction market as a percent of GDP is still below the 30-year
average, potentially suggesting that a reversion to the mean is in order.
CURRENT COMMERCIAL BUILDINGS BY AGE (% OF TOTAL BUILDINGS AND FLOORSPACE)
Less than 10 Years 15%
70+ Years 15%
60+ Years 26%
50+ Years 38%
40+ Years 50%
30+ Years 66%
20+ Years 82%
10+ Years 95%
Source: U.S. Energy Information Administration
TOTAL U.S. CONSTRUCTION AS A % OF GDP REMAINS BELOW THE LONG-TERM AVERAGE
12.0%
10.0%
10.0%
9.0%
8.0%
8.0%
30 - Year Average 6.97%
7.0%
6.0%
6.0%
5.0%
4.0%
4.0%
3.0%
2.0%
2.0%
1.0%
1990
1991
1992
1993
1994
1995
1996
1997
1998
1999
2000
2001
2002
2003
2004
2005
2006
2007
2008
2009
2010
2011
2012
2013
2014
2015
2016
2017
2018
2019
—
1990
1991
1992
1993
1994
1995
1996
1997
1998
1999
2000
2001
2002
2003
2004
2005
2006
2007
2008
2009
2010
2011
2012
2013
2014
2015
2016
2017
2018
2019
Source: U.S. Census Bureau
Introduction: Favorable Secular Tailwinds 11U.S. INFRASTRUCTURE SPENDING
Since 2013, public expenditures emphasized repairs of existing infrastructure while spending on new capital projects
declined. Operational and maintenance spend is favorable for rental operators, as the rental business model, by nature,
is well-suited to support projects that require specialized equipment for short durations of time. Maintenance is generally
performed on a planned basis, resulting in attractive recurring cash flows for rental operators.
The growing backlog of capital and infrastructure projects is expected to drive increased equipment demand in the years
ahead. In addition, federal infrastructure programs could drive further capital expenditures into the foreseeable future.
While the Trump administration has pushed for a widespread infrastructure plan since the 2016 campaign, COVID-19
impacts, interest rates approaching zero and historic unemployment levels collectively position infrastructure spending as
an actionable way to bolster the economy. Encouragingly, the desire for increased U.S. infrastructure spending is one of
the few issues with strong bipartisan support in Congress 1. At the same time, state and local governments, which own the
majority of the country’s non-defense public buildings and structures, are investing more in infrastructure, including non-
traditional infrastructure, such as 5G and related technology. Consequently, infrastructure and non-residential equipment
rental companies and dealers are likely to be amongst the first to recover from COVID-19 2.
These capital projects will benefit the Equipment Rental sector, as numerous trade crafts rely on specialized equipment
for work on their specific sub-components. These projects will also drive new and used equipment sales among dealers.
ROBUST INFRASTRUCTURE MAINTENANCE EXPENDITURES (INDEX: 1990 = 100)
150
190140
170
130
150
120
130
110
110
100
90
90
70
80
50
1990
1991
1992
1993
1994
1995
1996
1997
1998
1999
2000
2001
2002
2003
2004
2005
2006
2007
2008
2009
2010
2011
2012
2013
2014
2015
2016
2017
1990
1991
1992
1993
1994
1995
1996
1997
1998
1999
2000
2001
2002
2003
2004
2005
2006
2007
2008
2009
2010
2011
2012
2013
2014
2015
2016
2017
Operational and Maintenance Capital Projects
Source: U.S. Congressional Budget
1
The Washington Post
2
Invesco
12 Equipment Rental ReportEQUIPMENT RENTAL SECTOR OVERVIEW THE EQUIPMENT RENTAL SECTOR IS DRIVING A VIRTUOUS CYCLE Rental companies seek to scale and to build density primarily to provide their customers access to a more comprehensive line of equipment regardless of location. With increased scale, companies realize a virtuous cycle of improved product availability, higher product utilization rates, ability to offer more competitive pricing, expanded fleet composition and, ultimately, improved profitability. This virtuous cycle is driving higher rental penetration, expanding industry revenues and organic and M&A-driven growth. Equipment Rental Sector Overview 13
CONTRACTORS INCREASINGLY PREFER RENTING OVER OWNING
The Equipment Rental Penetration Index, published by the American Rental Association, illustrates a consistent, one-
way shift towards renting within the construction industry over the last three decades. In the decade from 2009 to 2019,
rental penetration grew from 40% to 57%.

A growing proportion of contractors recognize the advantages of renting over owning their equipment. Renting not
only decreases upfront financial burden, but also provides for greater flexibility in managing fleet size and makeup in
response to business trends, access to the newest and most advanced models, lower maintenance and storage costs
and reduced downtime.

U.S. EQUIPMENT RENTAL PENETRATION
     90%

                                                                                                                                            80%    80%
     80%

     70%                                                                                                                          65%

     60%
                                                                                                                    56% 57%
                                                                                               53% 53% 53%
                                                                                        51%
     50%
                                                                                 45%

     40%                                                           38% 40%

     30%
                                                            25%
                                                     20%
     20%
                                       15%    15%

                       9%        11%
     10%
                5%
               1993

                      1994

                                1995

                                       1996

                                              1997

                                                     1998

                                                            2004

                                                                   2005

                                                                          2009

                                                                                 2010

                                                                                        2011

                                                                                               2015

                                                                                                      2016

                                                                                                             2017

                                                                                                                    2018

                                                                                                                           2019

                                                                                                                                  Europe

                                                                                                                                            UK

                                                                                                                                                  Japan
           Source: Rental Management Magazine

As impressive as the trajectory has been, there is still significant runway for growth. By comparison, equipment
rental penetration in the UK and Japan is around 80%. Moreover, in the near-term, it is likely that the pandemic may
motivate many previous “hold outs” to shift into renting.

 “
                             If we think about anytime there’s a disruption in people’s capital situation...
                             people that normally wouldn’t use a rental channel... start to turn to the
                             rental channel. And once people start turning to the rental channel, they
                             realize the flexibility and all the soft costs being eliminated that you would
                             have from owning. The math works, right? That’s why penetration is usually
                             going only one way.”
                             - Matthew Flannery, President & CEO of United Rentals
14                                                                                                                                         Equipment Rental Report
“
Greater than 50% of our business revolves around everyday operations,
maintenance, repair and events in the geographic markets that we
service. These markets continue to be strong and are showing no signs
of dampening. This is a very large space that is growing as we, over time,
again create a reliable alternative to ownership through our larger-than-
ever platform, our clustered market model and our specialty business
development… These markets are in the early stages of rental penetration.”
- Brendan Horgan, CEO of Ashtead/Sunbelt
Equipment rental is also evolving into more of a service model and tapping into new non-construction markets where
reliable alternatives to ownership previously did not exist. For example, Sunbelt estimated 55% rental penetration
for its general rental businesses but less than 15% for its specialty businesses. Since specialty equipment is typically
less tied to construction but deployed primarily for everyday MRO services, it tends to be less cyclical. Driven by
both the expansion in addressable market to include new specialty equipment and the ongoing shift in favor of
renting over owning, the industry is expected to grow by a CAGR of approximately 4% through 2023, outpacing the
broader U.S. economy 3.
U.S. EQUIPMENT RENTAL INDUSTRY REVENUES
$70
$65
$63
$58 $60
$60 $56
$52
$50 $49
$47
$45
$42
$39
$ in Billions
$40 $37 $37 $36
$33
$30 $31
$30
$20
$10
2007
2008
2009
2010
2011
2012
2013
2014
2015
2016
2017
2018
2019
2020E
2021E
2022E
2023E
Source: Rental Management Magazine
3
Yengst Associates
Equipment Rental Sector Overview 15The momentum of U.S. rental penetration is reflected in the latest independent surveys of contractors. 92% of U.S.
contractors indicated that they intended to either maintain or increase their rental activity in 2019. As a result, 63%
of U.S. rental providers rented out more equipment to contractors in 2019 than in 20184. Accordingly, the growth
of U.S. Equipment Rental is outpacing the growth in underlying construction expenditures. In addition, the Rental
Equipment Register’s latest report indicates that roughly 40% of the 100 largest rental companies generated double-
digit annual revenue increases from 2018 to 2019.
U.S. EQUIPMENT RENTAL OUTPACES U.S. CONSTRUCTION EXPENDITURES (INDEX: 1997 =100)
400%
400
350
300%
300
250
200%
200
150
100% 100
50
—
1997
2002
2006
2014
2018
1997 2002 2006 2010 2014 2018
US Equip Rental Market
U.S. Equipment Rental Market Total U.S. Construction Spending
Total U.S. Construction Spending
4
Wells Fargo
16 Equipment Rental ReportEQUIPMENT RENTAL SECTOR
M&A TRENDS
STRATEGIC CONSOLIDATORS
Acquirer Selected Acquired Companies
$199m $188m $118 $42m $210 $279m
Toronto, ON Los Angeles, CA Worchester, MA Chicago, IL Philadelphia, PA New York, NY
50 Acquisitions Since 2017 2019 2019 2019 2018 2018 2017
$100m $60m $132m
Austin, TX Southeastern US Denver, CO
3 Acquisitions Since 2017 2019 2018 2017
$73m $75m
Decatur, AL Boston, MA New Orleans, LA Cedar Rapids, AI Seattle, WA Chicago, IL
6 Acquisitions Since 2017 2019 2019 2019 2018 2017 2017
Bethea Tool
$42m N&L Line
Equipment $5m & Equipment $6m
St. Paul, MN Poulsbo, WA Brighton, TN
3 Transactions Since 2014 2019 2018 2017
Ontario Tool
& Rental
Oregon, WA Washington, OR Redmond, OR Oregon, WA Idaho, OR OR, ID, UT, WA
6 Acquisitions Since 2017 2019 2018 2017 2017 2017 2017
$90m $2.1b $715m $1.3b $965m
Port Orange, Fl Alberta, BC Woodlands, TX Arlington, TX Miami, FL Chicago, IL
9 Acquisitions Since 2017 2019 2018 2018 2018 2017 2017
Note: $ amounts reflect Deal Value
Equipment Rental Sector: M&A Trends 17Despite significant acquisition activity, the TOP 10 U.S. RENTAL COMPANIES AS A % OF TOTAL INDUSTRY REVENUES
35%
Equipment Rental sector remains highly 32%
30%
fragmented and ripe for consolidation. The top 30%
ten companies represent about one-third of total 26% 27% 27%
24%
market share. For large rental companies, the desire 25%
23%
22%
for a national footprint, regional and local market 20%
density, specialty capabilities, diversification and 20%
cross-selling opportunities remain front and center. 15%
While the top rental companies are committed to
M&A, they are increasingly disciplined in assessing 10%
timing, pricing and fit. At this juncture, the top
5%
players are pursuing unique M&A strategies, as
highlighted in the following sections. 2010 2011 2012 2013 2014 2015 2016 2017 2018
Source: United Rentals
UNITED RENTALS (NYSE: URI) | ENTERPRISE VALUE: $22.5 BILLION | 2019 SALES: $9.4 BILLION
Over two decades, United Rentals has successfully integrated more than 275 acquisitions in different environments
and across the size spectrum, totaling more than $10 billion in total value. Upon establishing itself as the leader in the
North American rental market with the buyout of RSC in 2012, the company pivoted away from high volume M&A
towards fewer but larger-sized deals with the occasional smaller-scale, specialty acquisition.
In 2017, United Rentals completed two of the largest acquisitions in the sector, acquiring NES Rentals for $965
million and Neff Rental for $1.3 billion. Both of these deals enhanced cross-selling opportunities across general and
specialty products, including aerial, power, pump and trench. Throughout 2018 and 2019, United Rentals executed
over $3 billion more in M&A via WesternOne, BakerCorp, BlueLine and Thompson. The largest of the acquisitions,
Platinum Equity-backed BlueLine for $2.1 billion, significantly augmented general rental with a younger fleet and a
strong focus on both local and mid-sized customers spread across North America, particularly on the high growth
U.S. coasts.
Today, the diversification achieved is paying dividends – positioning the company to better weather the current
downturn when compared to its vulnerability during the Great Recession.
“
When we think back to the early days, as United was rolling up companies
and building, we didn’t have the diversity of customer base, who were very
much relying on non-res and even specifically, the commercial retail part
of non-res… We’ll be much more resilient from a pricing perspective… The
industry will do a better job, quite frankly.”
- Matthew Flannery, President & CEO of United Rentals
18 Equipment Rental Report“
This acquisition further enhances Sunbelt’s position in the important New
York City market. Pride’s focus on aerial equipment is complementary
to Sunbelt’s capabilities in a broader range of smaller and medium size
equipment and there will be significant opportunities to cross-sell to the
enlarged customer base. This acquisition is consistent with our long-term
strategy to take advantage of structural growth opportunities through both
organic investment and bolt-on acquisitions.”
- Geoff Drable, Former CEO of Ashtead/Sunbelt
ASHTEAD GROUP / SUNBELT RENTALS (LSE: AHT) | ENTERPRISE VALUE: $21.8 BILLION |
FY’20 SALES: $6.3 BILLION
Second in U.S. market size, Ashtead (and via its U.S. operations, Sunbelt) is pursuing a primarily organic growth
model complemented by a tuck-in acquisition strategy – more than 80 acquisitions since 2015 – to assemble a broad
yet specialized fleet with geographic market density to service their expanding customer base.
A case in point is Pride Equipment, which TM Capital represented in its $279 million sale to Sunbelt. At the
higher size end of deals Sunbelt normally pursues, Pride, a family-owned business for nearly 50 years, enabled
Sunbelt to gain a leading position in the lucrative and growing New York City metropolitan market. The co-founders
believed that their company, which was entering a high growth phase, would benefit by aligning with a buyer
bringing enhanced resources to develop its employee ranks and better address the ever-expanding needs of its
customers.
Going forward, Ashtead / Sunbelt seeks to expand its clustering model and further diversify into specialty operations
in both the U.S. and Canada. The company aspires to double its market share over the long-term and notes no
shortage of M&A opportunities, particularly in the sub-$50 million range.
Equipment Rental Sector: M&A Trends 19H&E EQUIPMENT SERVICES (NASDAQ: HEES) | ENTERPRISE VALUE: $1.9 BILLION | 2019 SALES: $1.3 BILLION As the world’s largest Manitowoc and Grove crane dealers, H&E has come to exemplify the convergence between the Rental and Dealer sectors. H&E has its own unique approach to M&A, focusing on best-in-class, lower middle market regional players and opting for a few targeted tuck-in acquisitions per year in the $20 million EBITDA range. Since H&E has approximately 100 locations across 23 states, there remains significant white space for growth. In general, its strategy is to invest in greenfield projects to increase density in existing markets while focusing on M&A in new markets to establish a customer beachhead. Recent tuck-ins have scaled the company’s earthmoving, material handling, and power fleet in Colorado, the Southeast and Texas. Although H&E is not averse to considering specialty rental businesses, it is emphasizing more general rental targets. RENTAL EQUIPMENT INVESTMENT CORPORATION (REIC) | PRIVATE REIC is a rental holding company formed in 2014 by Kevin Fitzgerald, the former CEO of Neff Rental, and a group of private investors. It was formed with a mandate to establish local dominance in the U.S. by pursuing acquisitions of well-run rental businesses and opportunistic greenfield openings. Due to its strong balance sheet, capital support – including a mezzanine investment in 2016 from NewSpring Capital – and operational acumen, REIC is particularly well positioned as an acquirer within the Northwestern U.S. The company began its M&A roll-up in December 2014 through the acquisition of Midway Rental, located in Montana; then acquired eight more companies to expand into Wyoming, Colorado, Idaho, Oregon, Utah and Washington – propelling the company to #59 in the RER 100. Today, REIC has 25 locations with broad diversification across multiple end markets, including agriculture, general construction, industrial and infrastructure. Kevin Fitzgerald, CEO of REIC says: “We plan to continue to build new stores and purchase well-run companies within the seven states we operate in. In addition, we will enter a new U.S. geographic region this year with a similar playbook. We seek well-run rental companies who wish to retain their brand name, people, and to access growth capital and the latest operating technology. We currently operate under four different rental brand names and will look to add to this over the coming years.” MAXIM CRANE WORKS | PRIVATE Maxim Crane Works is the largest player in its field and has been highly acquisitive while staying true to its category- only specialist status. Due to the highly technical nature of crane use, where customers typically require multiple cranes of varying lifting specificity that change based on the phase of given project, this product vertical requires unique specialization. In general, COVID-19 has underscored the merits of crane rental companies, namely, their resiliency downturns due to their use in ongoing, long-term construction projects. TM Capital worked across the table from Maxim in 2015 as the sell-side advisor to Florida-based Crane Rental Corporation, a portfolio company of Hammond, Kennedy & Whitney, which provided a “best-in- class” Southeast position, high capacity fleet, value-added heavy hauling and rigging capabilities and a blue-chip customer base. Just days prior to the deal’s closing, Maxim acquired Indianapolis-based Poindexter Transportation to strengthen its foothold in the Midwest. These transactions set the stage in mid-2016 for Apollo Global Management to acquire Maxim and merge it with AmQuip Crane Rental, a portfolio company of Clearlake Capital, in an estimated $1.4 billion combined deal. Since the merger, Maxim has acquired seven additional companies, further solidifying its nationwide network. In the last year alone, Maxim has expanded in the Gulf Coast, New England and Tennessee-Alabama regions through acquisitions of B&G Crane Service, The Shaughnessy Companies and Solley Crane. 20 Equipment Rental Report
BROADER EQUIPMENT RENTAL SECTOR ACTIVITY
While the largest rental companies have driven M&A, other corporate and private equity players have been attracted
to the industry’s secular tailwinds and platform opportunities.

INTERNATIONAL ACTIVITY
     • To date, there has been limited foreign investment in the U.S. Equipment Rental sector. In 2017, Sumitomo
       Corporation (OTCMKTS: SSUMY) completed its acquisition of the remaining 20% interest in Sunstate
       Equipment, one of largest North American rental companies. Backed by its large parent, Sunstate expanded
       organically across the South and today is #9 on the RER 100, with an estimated $640 million of revenue
     • More recently, in April 2020, Japan’s Itochu (NASDAQ: ITOCY) led a $15 million investment in BigRentz,
       a growing U.S. online rental portal. The investment is reportedly being used to fund the acquisitions of
       Equipment Management Group and Lizzy Lift
     • We watch with interest the significant consolidation occurring in Europe and the U.K. and speculate that it
       may not be much longer before we see a Loxam, Boels, or Mateco “come across the pond”

OTHER NOTABLE CORPORATE ACTIVITY
     • In mid-2019, Nesco went public in an approximately $1.1 billion reverse merger with a public SPAC. Originally
       a portfolio company of Hammond Kennedy & Whitney, Nesco was sold to Platinum Equity in 2011 and then
       to Energy Capital Partners in 2014. Nesco’s acquisition strategy is to acquire complementary rental fleet
       tuck-ins that leverage scale and expertise in key geographies and verticals, particularly in infrastructure
     • In 2017, Home Depot – though not traditionally thought of as an equipment rental company but which is
       sitting at #4 on the RER 100 – acquired Compact Power Equipment for $265 million. Compact Power was
       a long-term compact equipment rental and maintenance partner of Home Depot

Equipment Rental Sector: M&A Trends                                                                               21
FINANCIAL INVESTORS
Sponsor activity in the Rental sector has been sustained over the past 15 to 20 years. In recent years, sponsors
exploited the consolidation of the larger strategics for natural investment exits, sometimes in as quickly as 2-3
years. Select deals include:
2019 2016 2016 2015
TM ans
TM ans
Tr
Tr
Ca act
Ca act
pit ion
pit ion
al
al
Current Investment Current Investment Mezzanine Investment Exited in 2016 via sale to
(Recapitalization) Apollo for $1.4 billion
2015 2015 2015 2014
Current Investment Current Investment Current Investment Current Investment
2014 2014 2013 2013
Exited in 2016 via sale Exited in 2018 via sale to Current Investment Exited in 2017 via sale to
to Apollo/ Maxim Crane URI for $2.1 billion Ashtead Group/Sunbelt
Works Rentals
2013 2011 2011 2010
Exited in 2018 via merger Exited in 2014 via sale to Exited in 2015 via sale to Exited in 2019 via sale to
with Allison Crane & Energy Capital Partners NCSG Crane & Heavy an undisclosed buyer
Rigging Haul Corp.
2008 2008 2008 2007
TM ansa
Tr
Ca cti
pit on
al *
Exited in 2016 via sale to Exited in 2016 via sale to Exited in 2015 via sale to Exited in 2011 via sale to
Apollo for $1.4 Billion Konza Valley Capital Platinum Equity Platinum Equity
* Represents transaction led by
TM professionals while at a prior firm
22 Equipment Rental Report“
Obviously, with 94 locations in 23 states, there’s a lot of geography for us
to fill in. We like the general rental construction markets that represent
typical fleet mix that you see with us and on most of our larger competitors.
We’re not adverse to considering specialty rental businesses. And I’ll tell
you that we’re kicking a lot of tires... These are primarily small tuck-in type
acquisitions.”
- Brad Barber, CEO of H&E Equipment services
Equipment Rental Sector: M&A Trends 23EQUIPMENT DEALER SECTOR
OVERVIEW
Like the Equipment Rental sector, the Dealer sector has rapidly evolved over the past decade. The Great Recession
exacerbated the pressure on an already capital-intensive sector and forced players to rethink their traditional
operating models. In turn, the line between the two sectors has blurred, with more dealers starting to offer longer-
term rental options as a “solution” to meet capital-strapped customer needs. At the same time, many dealers have
broadened their product offerings and OEM relationships, which, when combined with more sophisticated parts and
service requirements, has enabled dealers to act as a “one-stop-shop” for customers while hedging their downside
risk.
FAVORABLE RECURRING REVENUE
Today’s dealers serve as more than an “extended warehouse” for OEMs. Today, the key drivers of dealer success
include differentiated value-added services, such as maintenance, repairs, parts and consumables; appropriate
equipment lines; and niche industry specialization. Aftermarket parts and services are of heightened importance,
as they provide recurring cash flow with higher margins to insulate against downturns. In fact, for many of the best
dealers, the bulk of their gross profit ultimately comes from parts and service revenue, as opposed to new equipment
sales.
% OF REVENUE AND GROSS PROFIT FROM PARTS AND SERVICES
90%
78%
75%
70%
58%
60%
56% 57% 54% 51%
45%
30% 31% 26%
30%
23% 25%
15%
Private Company A Private Company B Rush Alta Titan Private Company C
Source: Company financials and TM Capital research % of Revenue % of Gross Profit
For example, in the case of ag dealers where, even before COVID-19, poor planting
conditions were limiting demand for traditional equipment purchases, parts and services
were a bright spot. Titan Machinery’s equipment sales were flat in the most recent fiscal
year ended January 31, 2020 versus up 10.1% for parts and services & rental. In a recent
study on the 2020 outlook among North American ag dealers, 42% expect a pickup in new
equipment sales, down from 47% in 2018.
By contrast, 62% expect an expansion in parts and services. In conjunction with parts and
service revenue gains, dealers are also expecting an accompanying gross margin expansion,
while equipment gross margin is expected to contract 5. This is particularly noteworthy, as
margins are already substantially higher for parts (30%) and services (63%) than for new
equipment (7%). While the study was published before COVID-19, subsequent company
statements have reflected the benefit of a shift towards a higher margin, recurring revenue
business mix.
24 Equipment Rental ReportREVENUE GROWTH OUTLOOK FOR PARTS & SERVICES AND NEW EQUIPMENT AMONG AG DEALERS
2020
2020 PARTS
- Parts &&Services
SERVICE 2020
2020NEW
- NewEQUIPMENT
Equipment 2018NEW
2018 - New Equipment
EQUIPMENT
3% 3% 6% 7%
11% 9% 11%
13%
35% 38% 40%
51% 37%
37%
>8% Growth 2-7% Growth Flat 2-7% Decline >8% Decline
Source: Ag Equipment Intelligence 2020 Dealer Business Outlook
Across all equipment categories, OEMs are helping dealers capture these high margin, recurring parts and service
revenue streams. OEMs are not only developing more complex machinery that can only be worked on by trained
dealer technicians, but are also requiring equipment under warranty to be serviced with custom engineered,
proprietary parts. Some manufacturers even stipulate that OEM-brand oil and filters be used while under warranty.
Post-warranty, some aftermarket parts may be available, but with the increasing complexity of equipment and
systems, customers choose to rely on the dealer as long as the equipment is in service.
“
5
Ag Equipment Intelligence: 2020 Dealer Business Outlook & Trends – Farm Equipment Forecast
Our recent trend of strong parts and service growth continued in the
fourth quarter, increasing 19.2% and 16.6%, respectively. The growth
in these revenue categories reflects our increased focus on customer
care across all segments and was supported by the difficult harvest
environment as well as an aging customer fleet within our ag business.”
- Mark Kalvoda, CFO & Treasurer of Titan Machinery
Dealer Industry Overview 25
Equipment Dealer Sector: Overview 25“
On the aftermarket side, it’s been incredible to see how the digital
infrastructure has allowed us to see machine failures, be able to connect
with customers through digital portals, be able to seamlessly continue
aftermarket connections back to the dealership in a way that allows us to
deliver parts without ever having a face-to-face transaction. So that’s just a
decade of putting the infrastructure in place that’s allowed our customers
Dealer Industry and
Overviewdealers to now take that infrastructure and turn it into a tremendous 26
experience for them in a difficult time.”
- Cory Reed, President of Worldwide Agriculture & Turf at Deere
OEMS HEIGHTENING PRESSURE ON DEALERS, LOOK TOWARDS INNOVATION AND THE CLOUD
A key driver of change in the Dealer sector has been the rise of larger customers demanding a more comprehensive
product selection as well as enhanced technology offerings. To meet the product demands of these customers,
manufacturers have invested heavily to broaden their offerings. For example, over the past two years Caterpillar
has invested approximately $3.5 billion in R&D to develop new products across multiple end markets, including 11
new models in its GC line alone (excavators, articulated trucks, motor graders, wheel loaders and paving products).
This proliferation of new product introductions by OEMs has led to both confusion among dealer networks and
frustration from customers. OEMs have responded quickly, putting pressure on dealers to evolve, improve cross-
dealer communication and institutionalize best practices. OEMs and dealers are also turning to technology to further
improve and maintain relationships with customers.
OEMs are increasingly offering predictive telematics technology with equipment, enabling dealers to remotely
assess issues, reducing both maintenance cost and time. Dealers are often able to determine what is wrong with
a piece of equipment and determine if it can be repaired in the field or if it needs to be brought into the dealer for
service – for many vehicles operating in remote environments, a trip to the dealer results in several days of downtime.
Additionally, dealers are relying on e-commerce and cloud solutions to enhance their businesses in a highly
competitive environment. This has become especially prevalent in the COVID-19 environment, which heightened
the importance of providing customers with remote access to equipment and improving digital management of
inventory and labor.
GLOBAL CONSTRUCTION EQUIPMENT SALES
$200
$173
$175 $166
$159
$153
$146
$150 $140
$135
$129
$125
$125
$ in billions
$100
$75
$50
$25
2019 2020 2021 2022 2023 2024 2025 2026 2027
Source: Grand View Research
26 Equipment Rental ReportRENT THE EQUIPMENT, SELL THE CONSUMABLES
Consistent with the need to deliver differentiated value-added services and build a recurring
revenue mix, the broader Dealer sector is also turning towards niche consumables to complement
longer-term rental and new equipment sales. The combination is naturally reinforcing – as
the installed base grows, demand for related consumables follows. In turn, customer loyalty
strengthens and allows for superior margins. TM Capital witnessed this in its representation
of WaterCo. (a portfolio company of Prospect Partners), the top performing residential
water solutions platform in the Culligan dealer network, in its sale to its OEM, Culligan
International. WaterCo. offered a “Water-as-a-Service” solution package that provided an auto-
renewing contract covering all the necessary rental equipment consumables, maintenance and
aftermarket parts. Both financial and strategic buyers found the long-term recurring revenue
streams to be highly compelling. We anticipate that more dealers across varied product sectors
will pursue similar strategies where possible.
STRONG UNDERLYING FUNDAMENTALS IN TRUCKING
The nationwide U.S. Class 8 Truck Dealer landscape encompasses approximately 2,000 OEM licensed dealers,
the vast majority of which operate within exclusive territories. While the truck dealer universe is quite fragmented,
the OEM landscape is an oligopoly controlled by four companies, Daimler Trucks, Paccar, Volvo and Navistar.
Truck dealers typically operate a combination of full service and satellite locations providing new and used truck
sales; aftermarket parts and service; leasing and rental services; and financing and insurance products within their
exclusive territories.
Current trends impacting the truck dealer market are bolstered by near all-time highs of heavy-duty truck sales and
aging active trucks. The pent-up demand for fleet replacement following a protracted period of recession deferrals in
capital spending released a wave of capital spending in new truck sales over the last decade. In 2019, approximately
530,000 heavy duty trucks were sold, 40% above the historical 30-year average. Even with the surge in sales, the
average age of active U.S. Class 8 trucks trended upwards over the last five years and is 12% older than the average
age at previous sale peaks. The aged installed base will drive strong parts and services momentum in the coming
years as this cohort requires higher levels of maintenance. TM Capital witnessed the benefits of this trend as
the advisor to Vanguard Truck Centers in its sale to Stephens Capital Partners, the Little Rock-based family
office of Stephens Inc. Vanguard was the largest multi-regional truck dealership in the Volvo/Mack dealer
network and commanded significant interest for its emphasis on recurring, high margin parts and service.
ANNUAL UNIT SALES AND AVERAGE AGE OF HEAVY-WEIGHT TRUCKS
$600600 6.8
6.8
6.6
6.6
Annual Sales (000s )
$500
500
6.4
6.4
$400400
Average Age Age
Annual Unit Sales (ooos)
6.2
6.2
6.0
Average
$300300 6.0
5.8
5.8
$200200 5.6
5.6
$100100 5.4
5.4
5.2
$- 5.2
1990
1991
1992
1993
1994
1995
1996
1997
1998
1999
2000
2001
2002
2003
2004
2005
2006
2007
2008
2009
2010
2011
2012
2013
2014
2015
2016
2017
2018
2019
Annual Unit Sales Average Age
Source: U.S. Bureau of Economic Analysis and Act Research
Note: Seasonally-adjusted annual rate of unit sales for trucks over 14,000 lbs (monthly average); whereas age is for Class 8 truck
Equipment Dealer Sector: Overview 27EQUIPMENT DEALER SECTOR
M&A TRENDS
The vast universe of potential mid-sized acquisition targets in the Dealer sector should provide a robust runway in
the years ahead. One principal driver for M&A will be the sector’s need for succession solutions among its aging
founder ownership base. A significant proportion of dealers are family-owned businesses that have grown steadily
over the decades and are now in need of greater capital and resources to address the increased complexity of
demands from both OEMs and customers. According to a recent Farm Equipment poll, over 37% of equipment
dealer owner-principals are 61 years or older, and nearly 75% were 51 years or older.
Amidst this backdrop, buyers with longer investment horizons will be best positioned to capitalize on the growth
opportunities that many smaller dealers may be unable to exploit. OEMs, who hold the reigns through OEM
agreements, tend to prefer the stability of long-term ownership. Accordingly, family offices have been active
participants in the Dealer sector, as they not only provide the comfort of performance to the OEMs, but their own
“family dynamic” more closely mirrors the traditional family-owned dealer paradigm. That said, as we will note below,
private equity firms are finding success in the Equipment Dealer sector as well.
Below we highlight representative key players in the Dealer sector and their M&A strategies.
ALTA EQUIPMENT (NYSE: ALTG) | ENTERPRISE VALUE: $0.6 BILLION | 2019 SALES: $0.6 BILLION
Alta Equipment is a dealer specializing in industrial / material handling and construction equipment. At the end
of 2019, Alta went public in a reverse merger with a SPAC at a $540 million pro forma enterprise value, or ~5.7x
forward EBITDA. With a strengthened capital structure, it stands poised to be one of the leading M&A partners for
independent, family-owned dealers. Since 2008, Alta has acquired 18 dealers and grown revenue by a CAGR of
27%. In 2020, the company acquired Liftech and Flagler, which are expected to add over $220 million in revenue.
Liftech and Flagler were acquired to scale the business in the Northeast and Southeast in the heavy equipment
industrial and construction markets.
Key material handling and construction OEMs represented include A&G Mercury, Autocar, Bendi, Bombilift, Drexel,
Genie, Hyster, Landoll, Manitou, Motrec, Rico, Utilev, Volvo and Yale.
GROFF TRACTOR & EQUIPMENT | PRIVATE
Groff Tractor & Equipment, a portfolio company of Prophet Equity since 2016, is a leading full line construction
equipment dealer founded in 1958 and headquartered in Central Pennsylvania. Under Prophet Equity’s ownership,
in conjunction with a growth-oriented leadership team, Groff has pursued an aggressive consolidation strategy that
has yielded three additional dealer network acquisitions, combining the operations of Trico Equipment, Folcomer
Equipment and CC&T over a 36-month period. Consequently, the Groff footprint has increased from two states and
“
six locations to four states and fifteen locations across the Mid-Atlantic. Due to its strong balance sheet and capital
support from Prophet Equity, Groff is well positioned for continued acquisitions within its target region.
We’ve found the equipment rental and distribution spaces quite attractive
given compelling unit economics and consolidation opportunities.
Our current investments in equipment dealers, such as Groff Tractor &
Equipment and Hills Machinery Company, reflect the opportunity to
partner both with highly motivated owner-operators and with OEMs
looking to strengthen their distribution channels. In both spaces, we’ve
seen considerable opportunity to generate outsized returns and close
upon attractive add-ons.”
- Michael Hirschfeld, Principal at Prophet Equity
28 Equipment Rental ReportROCKY MOUNTAIN DEALERSHIPS (TSX: RME) | ENTERPRISE VALUE: $0.4 BILLION | 2019 SALES: $0.5 BILLION
Canadian ag dealer Rocky Mountain has acquired approximately 20 companies, often underperforming businesses,
since 2007. Going forward, management is targeting well-run businesses with strategic regional density to bring an
additional $200 million to the top-line, plus $100 million more in synergies.
Rocky Mountain is targeting expansion into the Western U.S., where the equipment demand profile is similar to the
Canadian Prairies. Management anticipates that its first acquisition in the U.S. will be transformational – adding
approximately $100 million in revenue – and will serve as a platform for future bolt-ons.
Key agricultural machinery OEMs represented include CASE, Bourgault and New Holland.
TITAN MACHINERY (NASDAQ: TITN) | ENTERPRISE VALUE: $0.7 BILLION | 2019 SALES: $1.4 BILLION
Titan Machinery is an ag and construction dealer with a mix of mature and newly-acquired locations across North
America and parts of Europe. Notably, in early April, Titan expanded into Germany by acquiring AGRAM, a four-
location Case IH dealership adding $30 million in revenue. Management is also targeting high performing ag
dealers in the Upper Midwest and, as discussed on past earnings calls, is engaged in discussions with multiple
parties. In addition to the North Dakota Case IH dealer acquisition announced late last year, Titan recently acquired
HorizonWest, a three-location Case IH dealer in Nebraska and Wyoming.
Key agricultural machinery OEMs represented include CASE and New Holland.
RUSH ENTERPRISES INC. (“REI”) (NASDAQ: RUSH.B) | ENTERPRISE VALUE: $0.3 BILLION |
2019 SALES: $5.8 BILLION
Among the top dealers, REI is perhaps the most cautious regarding acquisitions. After becoming the largest network
of commercial vehicle dealers in North America through M&A, Rush Enterprises is now more focused on growing
its high margin parts and service revenue streams. Management notes that increasing wallet share among existing
customers is less capital intensive and provides higher returns than what is typically achieved through acquisitions.
Nevertheless, REI remains a growth company, and, accordingly, is committing nearly half of its free cash flow to
greenfield expansion opportunities or acquisitions to increase service capacity to customers. In early 2019, the
company made its first international foray through a 50/50 JV with Tallman Group in Canada.
Key automotive OEMs represented include Peterbilt, International, Ford, Hino, Isuzu, Mitsubishi Fuso, Blue Bird, IC
Bus, Collins and Elkhart Coach.
BROADER EQUIPMENT DEALER SECTOR ACTIVITY
Similar to the Equipment Rental sector, while the largest established dealers have driven a majority of M&A, other
corporate, private equity and, in particular, family office players have been attracted to the industry’s secular tailwinds,
platform opportunities and improved OEM receptivity.
INTERNATIONAL ACTIVITY
• Companies have pursued cross-border M&A to demonstrate the replicability of their success
overseas and to better service larger, global accounts. As discussed earlier, for example, Titan’s
expansion into Germany further chips away at a broad European market while Rocky Mountain
is seeking to replicate its Canadian Prairies success in the Western U.S.
• Mitsubishi Caterpillar Forklift America’s acquired its long-time partner Equipment Depot, further
establishing its presence across the Americas
• Portugal-based Nors, S.A. acquired Canada-based Strongco, a multi-line construction equipment
dealer, for approximately $200 million in Q1 2020
Equipment Dealer Sector: M&A Trends 29You can also read