Towards a Digital Sensorial Archaeology as an Experiment in Distant Viewing of the Trade in Human Remains on Instagram - MDPI
←
→
Page content transcription
If your browser does not render page correctly, please read the page content below
heritage

Article
Towards a Digital Sensorial Archaeology as an
Experiment in Distant Viewing of the Trade in
Human Remains on Instagram
Shawn Graham * , Damien Huffer                   and Jeff Blackadar
 Department of History, Carleton University, Ottawa, ON K1S 5B6, Canada; damien.huffer@gmail.com (D.H.);
 JeffBlackadar@cmail.carleton.ca (J.B.)
 * Correspondence: shawn.graham@carleton.ca

 Received: 30 March 2020; Accepted: 11 April 2020; Published: 13 April 2020

 Abstract: It is possible to purchase human remains via Instagram. We present an experiment using
 computer vision and automated annotation of over ten thousand photographs from Instagram,
 connected with the buying and selling of human remains, in order to develop a distant view of
 the sensory affect of these photos: What macroscopic patterns exist, and how do these relate to the
 self-presentation of these individual vendors? Using Microsoft’s Azure cloud computing and machine
 learning services, we annotate and then visualize the co-occurrence of tags as a series of networks,
 giving us that macroscopic view. Vendors are clearly trying to mimic ‘museum’-like experiences,
 with differing degrees of effectiveness. This approach may therefore be useful for even larger-scale
 investigations of this trade beyond this single social media platform.

 Keywords: Instagram; computer vision; sensory archaeology; human remains trade

1. Introduction
      People buy and sell human remains online. This is not necessarily illegal in all jurisdictions
(for the United States, see [1]); in jurisdictions where it is illegal, there are very rarely prosecutions
(a notable exception is the State of Louisiana). In recent years, work led by researchers affiliated with
the Trafficking Culture project and others [2,3] have applied criminological and ethnographic lenses
to the broader trade in antiquities. Research by Tsirogiannis and Tsirogiannis [4] have developed
and applied novel techniques from network analysis to ‘fill in the gaps’ in our understanding of
how antiquities move from source to consumption points; work by Hardy, Al-Azm and Paul, and
Altaweel [5–7] have shone needed light on various social networks as platforms for buying and selling
antiquities. Our own prior research [8–10] has looked at the patterns of discourse in tens of thousands
of Instagram posts, and what people involved in the trade in human remains say they are doing, in
their posts. In this paper, we are not applying criminological lenses since, broadly, policy makers
and prosecutors have not seen fit to criminalize this trade. Instead, we are presenting an experiment
in ‘distant viewing’ that instead tries to understand collectors’ collections as they are presented on
Instagram, to see if useful patterns emerge that will help us understand the attraction(s) of owning
human remains. We develop a perspective that marries machine vision with a kind of ‘sensorial’ or
‘affective’ archaeology, in the spirit of Skeates and Day or Hamilakis [11–13].
      The key to doing this is to recognize that when people buy and sell human remains, they create
new assemblages and put the human remains and other materials into new contexts and relationships.
The archaeological biography of these remains continues. How can we study these new assemblages,
these new ‘sites’, and what might they mean for the construction of the past in the present? Are these
sites of an ‘enchantment’ for these collectors (see [14])?

Heritage 2020, 3, 208–227; doi:10.3390/heritage3020013                        www.mdpi.com/journal/heritage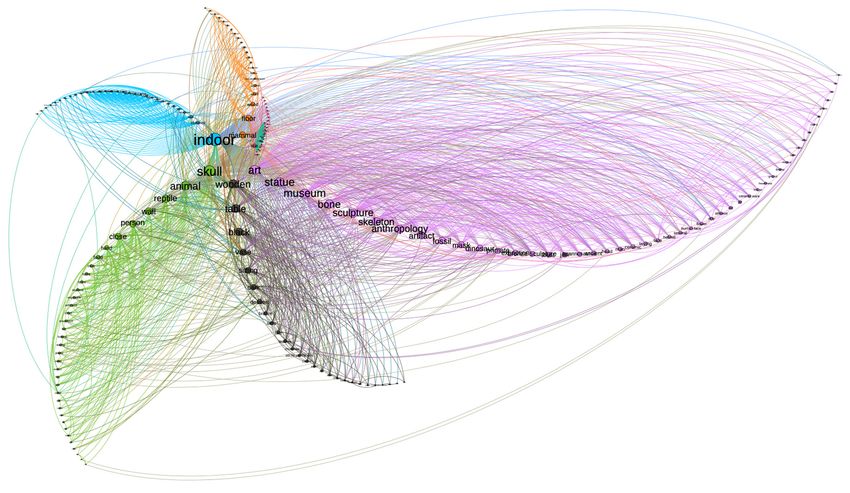
Heritage 2020, 3                                                                                         209

      Our research project wants to understand, amongst other things, what this contemporary
 archaeology suggests for how people form their relationships to the past (see for instance [15,16]). The
 digital ‘places’ in which we find these archaeological materials require a literal digital field archaeology
 and survey strategy. Most studies to date of social media in the broader realm of archaeology have
 dealt with the texts of posts, with minimal attention drawn to issues of privacy and the potential for
 abuse, drawn from sociological analysis (see [17] for a critical survey of work to date). Our previous
 research [18] has suggested that part of what buyers and sellers value in the posts surrounding the
 trade is the story, the aesthetic, of the heroic collector. They value the story of the exotic, the macabre.
 Not only are there discourses of text that seem to ‘unify’ this trade, but our in-progress research in terms
 of mapping ‘visual similarity’ suggests that there are visual tropes and influences that can be mapped
 as they spread from one photo to another (this technique represents an image as a mathematical vector
 and computes its distance in Euclidean space from other image vectors; see [19] on mapping visual
 influence using vectors, and also [20] (p. 626) on the ways that ‘professional vision’ in archaeology
‘shape[s] events in the domain of its scrutiny into the phenomenal objects around which the discourse
 of the profession is organized’).
      Turning to the photographs that accompany the posts, archaeological studies of social media have
 not to any large degree considered these. Morgan [21] and Baird [22] manually examined the site
 archives for Çatal Höyük and Dura Europos, respectively, categorizing photographs with regard to the
presence or absence of fieldworkers, the gaze of individuals depicted, the arrangement of the individual
 features, and so on, in order to trace the development of archaeological theory through photography.
At Dura Europos, these early archaeological photographs, for instance, served to reinforce and justify
 the expedition’s colonialist underpinnings, especially to the audience ‘back home’. We might say that
photography is the original ‘remote sensing’ of archaeology, providing a distant view that is somehow
 intimate and more ‘real’ because it directs our attention to precisely this thing over that thing, this
pattern of darker soil; it is a ‘discursive practice’ sensu Goodwin [20]. It creates authority because its
 results (the images) hide its processes (the intensely physical prospect of getting the camera set up just
 right, of manipulating the scene and the lighting). In this tension between the seen and the unseen,
 Hamilakis proposes that there is a tension, an opportunity, for a synaesthetic entangling of vision with
 our other senses [23] (p. 9). Papadopolous and colleagues write,

      “...the photographic process is structured by the sensorial photographic assemblage [...] which
      includes the things to be photographed and their specific affordances, the photographers, the
      various technological apparatuses, direct and ambient light, photographic memories and the
      photographic canon, the affectivity of the surroundings, and the desire to produce specific
      renderings of an object or thing. The inter- and intra-actions amongst the various agents
      partaking of the relational, sensorial field of photography, including the human actors, shape
      the photographic outcomes.” [24] (p. 634)

     We cannot study and contextualize every photograph we collect manually; to date, we have
collected over 100,000 individual photographs and associated metadata from Instagram alone, in
addition to separate large image corpuses from Facebook groups, Marktplaats.nl, and the web pages
of several brick and mortar stores; see [25,26]. However, what if we were to treat these individual
accounts as archaeological ‘sites’ in a system of relationships interpenetrating and intertwined with
the physical world (in the sense that the author of [13] deploys, articulating his take on ‘assemblages’
of the kind promoted by Deleuze and Guattari [27]), and treated tagged posts as ‘features’ within
them? Here, we describe an approach to dealing with the problem of exploring the data we collect
using machine vision, automatic tagging using Microsoft Azure’s ‘cognitive services’ engine, and
network analysis to characterize the ‘sensory affect’ that these digital places exhibit. We suggest that
the human remains trade online via social media (primarily, Instagram photos and posts) is an activity
that leaves archaeological traces in a digital matrix and that, by exploring automatic tagging, we are
able to do a kind of ‘remote sensing’ of this digital world. Like potsherds on the surface that the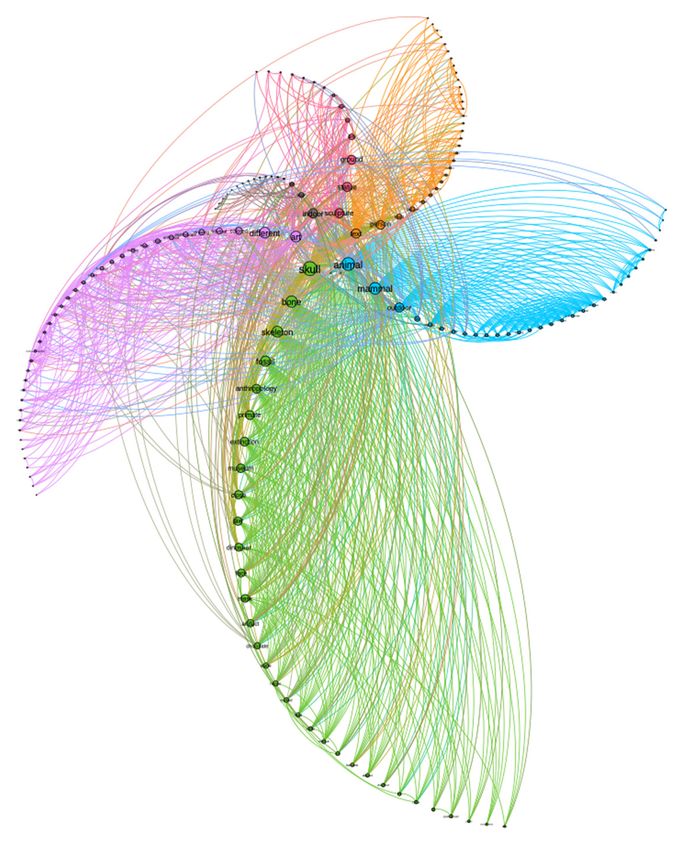
Heritage 2020, 3                                                                                              210

archaeologist studies and maps and from which they develop an (informed) imaginative idea of what
lies beneath, these tags become our sherds, evocative descriptions of ‘scenes’ through which we can
use our imaginations and our own experiences to approach something of the synaesthetic impact on
the collector of having these human remains. In our research to date, we have asked what we can learn
from the text, and from the images, as individual artefacts. However, what we are trying to do here
instead is to consider their photographic practice as emerging out of relationships between the people
involved, their own (real-world and virtual) places, and ‘their’ things. As Frieman and Gillings write,
criticizing ‘view sheds’ and other ways of ‘extracting and compartilizing vision’ in the past,

      “[...]what is needed is an archaeology that is sensitive to the rich and complex way in which
      individual sensory threads are woven together, their interdependencies and the tensions
      that can arise between them. Put simply, having successfully extracted vision from the
      sensorium we need to rise to the challenge of putting it back, and in so doing explore more
      fully the role played by the senses in shaping and structuring understandings (both past and
      contemporary)” [28] (p. 6)

      This means that, just as in sensory archaeology (e.g. [11,12,23,28–30]), we also have to engage in
‘evocative writing’, a writing that draws on our own mnemonic and autobiographical accounts (as [23]
p11 puts it), to sense and make sense of the results of this digital remote vision, this remote sensing.
Tringham and Danis [29] (p. 52) draw our attention to Skeates’ methodological suggestions [31] (p. 4)
 for how to do this—reflexivity, inventory, experimentation, thick description, and creative writing.
What follows is offered in that spirit.

Retrieving Sensory Affect
      This is Shawn’s memory.
      Our house was in the woods, about two hundred feet from the road. The bush was all tall white
pine, their crowns spread out and touching one another, but otherwise long tall poles with dead branches
all the way down. It was always dark, underneath the pine. The floor was littered with pine needles;
sometimes I would try to dig down to the sand underneath (a former bank of the Champlain sea), but in
the bush, it was just pine needles all the way down, a black acidic mass woven with mycological threads.
The air was always dry and dead in the bush, sometimes broken by the crash of falling branches when
the turkey vultures took flight, their long wings smashing through the trees. Our house stood in a little
clearing; our lawn was mostly green moss and lichen. We had a shed around the back, sitting deeper
amongst the pines. If I opened the door, I could smell the warm smell of pine boards, the cold damp of
the dead pine needles, oil and gas from the lawnmower (why did we have a lawn mower?) and the
chainsaw (much more useful). On a shelf made of rough pine there was a box; in the box, the skull of a
Percheron workhorse. The skull came from a farm up by town; they were digging a new foundation for
a barn and came across the burial pit for this workhorse. Somebody thought I’d find it interesting, and
had brought it down to us. Horses were last used up there around the 1930s, so the sandy acidic soil
had done its work quite quickly. The skull, as I remember it, had no smell at all, in that shed in the bush.
But I now associate the contrasting smells of that space with the non-smell of the skull, if that makes
any sense: Cold + damp + oil + gas + rough_textured_wood = horse_skull.
      You have to also understand how dead the bush was. Very little light, comparatively, makes it
to the forest floor. Squirrels might live up in the green branches sixty feet above, and sometimes a
pinecone falls, but aside from that and the turkey vultures, the bush is always very still.
      And yet... in the summertime, the heat makes it to the floor, and warms up those needles, and
there is an overwhelming scent of pine. The June bugs sing, if it gets hot enough, and in the mornings
and the evenings the whine of the clouds of mosquitoes is loud enough to hear at a distance (they grow
in the damp of the needles, or in small pools of stagnant water left over from the rain). So this too is the
smell of that skull in my father’s shed. This is the sound of the smell of the bleached skull in my father’s shed.
Heritage 2020, 3                                                                                        211

      As far as I know, that horse’s skull is still in that shed. I didn’t take it with me when I moved. I’m
not interested in owning bones. But as I look at the posts of vendors and collectors on Instagram, I
wonder what the sensory impact is for them of owning this material. My own brief ‘ownership’ of that
horse skull is bound up within a complicated sensory experience, tied to memory, that also connects to
my own family’s farming history, my relationship with my father, and where/how I grew up.
      A lot of work, for a single skull.
      We do not believe one should own or collect human remains. We are not interested in praising the
trade. But we want to know, given this example of SG’s own entanglement with that horse’s skull, can
we understand something similar of the sensory experience implied by these photographs for these
people who collect or sell? Whatever else this trade is, it is an engagement with human history and the
past. Thus, we need to try to understand what being in this trade does for these people, if we are ever
to hope to persuade them not to do this.
      A social scientist might interview these people (and archaeologists have: See [3]), but it is very
difficult as an archaeologist to transparently arrange interviews with a collecting community actively
engaged in highly suspect behavior (journalists have; see [32], for instance; Reference [33] discusses
the ethics of concealing one’s archaeological identity from informants). But we want to approach this
as digital archaeologists. If we treat the assemblage of photographs created by an individual vendor
or collector as a ‘site’, if we treat each photo as an archaeological context, we can use various digital
methods to explore from a sensory perspective the meanings of these sites. The resulting method could
then be used for other archaeological investigations, both of the past and in contemporary settings.

2. Materials and Methods

2.1. ‘Field Survey’ of a Digital Field
      Andrew Reinhard has described one facet of ‘archaeogaming’ as the use of archaeological methods
in virtual environments [34], where these virtual environments are understood as hyper-realistic,
high-resolution 3D graphical environments (often experienced from a first-person perspective, whether
through a screen or through a virtual reality headset). He argues that we can, in fact, perform
archaeological surveys within these environments—that is to say, the difference between ‘virtual’ and
‘real world’ is not very important as far as understanding human culture is concerned. However,
these game spaces are not the only virtual environments that archaeologists encounter. We have now
lived with the web (as distinct from the internet) since the early 1990s, and so we do not think of the
experience mediated by a browser as being ‘somewhere else’ any more. With the rise of powerful
smartphones and mobile computing, the web feels even less ‘somewhere else’, even less virtual, than it
did before. Instead, it is just another overlay, another dimension of information that intersects our lives
in ever more intertwined ways.
      Digital Historians such as Ian Milligan point out that the ‘event horizon’ for historical scholarship,
that is, what dates and events count as ‘history’ rather than ‘current events’, is now firmly within the
era of the web [35]. His research deals with web archiving and the textual exploration of websites as
archives of human activity. Similarly, we argue that personal social media pages that detail engagements
with material culture are within the ambit of the digital archaeologist: They are places where different
kinds of informational entities (a larger concept than cyberspace in that anything that manipulates
information, alive or not, online or in the real world, can be seen as being along the same spectrum [36])
intersect and are entangled in rich assemblages. The question is, what are the materials that we are
studying? Is it the photo? The text of the post? The comments and likes that overlay it? The metadata
that underpin it and reveal even more entanglements and interconnections? The things in the photo and
their interrelationships, both in physical spaces and in this digital space? The interaction with other
elements of the user’s profile page? Clearly, a single post on Instagram is extremely information-rich
(as of this writing, if a person appends /?__a=1 to an Instagram URL, the full metadata for that page
or post are exposed in JSON format). In this paper, we will consider the things depicted within a
photograph on a post as the organizing principle for creating a sensory impression of the ‘sites’ of our
Heritage 2020, 3                                                                                        212

study, while the site emerges through the interplay of all these things collated as an individual user
or search page on Instagram. Thus, these sites will be five individual collectors’/vendors’ Instagram
account pages, the ‘site’ created by a search for an individual Instagram hashtag, and the ‘site’ created
by the British Museum on Instagram to showcase the institution.
      In the same way that remote sensing in archaeology does not actually sense the past or actual
things (it senses variations in the Earth’s magnetic field caused by the presence/absence of a wall, or the
local relative moisture of the soil compared to somewhere else, and so on), our digital archaeological
remote sensing of these websites operates at one step removed, patterns of pixels that have been
probabilistically learned by the machine as corresponding with some thing or concept.
      By analogy to field survey, we suggest a way of looking at the tags assigned probabilistically by
the machine as ‘sherds of meaning’. Reassembled, they give us a way of assessing different ‘fields’ or
‘regions’ of the web from a sensory perspective: It permits us to understand the ‘feel’ of the digital
space the vendor is creating within which they wish to sell. This experiment is a case study looking
at all of the images collected from two major vendors of human remains on Instagram (Vendors A
and B) and three minor vendors (Vendors C, D, and E), where ‘major’ and ‘minor’ were determined
by number of followers, with major being greater than 10,000 followers and minor being less than
10,000 (indeed, the minor vendors hover around 500–1000 followers). Additionally all images found
by searching the Instagram tag “humanskullsforsale” on February 5th 2020 were collected. Finally, we
scraped the British Museum’s page. All of these scrapes were conducted over a few days in February
2020. In total, this gives us 10,432 images in a comparative perspective (Table 1) where the machine
can do the looking for us.

          Table 1. Number of images analyzed via Microsoft Azure’s Cognitive Services Image Tagging.

                                                        Number of Images
                                      Vendor A                 6381
                                       Vendor B                1041
                                       Vendor C                 222
                                      Vendor D                  398
                                       Vendor E                 478
                                  Instagram Search             245
                                   British Museum              1667

     The Instagram “Terms of Service” specifically requests that users do not use automated data collection
on Instagram accounts [37,38] (although a recent court case in the United States suggests such requests
might not be applicable [39]). Prior to 2018, Instagram had a public Application Programming Interface
(API; a way to query their servers programmatically) that provided us with useful basic metadata. Since
then, we used a web scraper built in the Python programming language that reads the website html and
parses the underlying JSON, enabling us to study the images (an approach common to other researchers
looking at the intersection of social media and various criminal trades; see, for instance, [40]).

2.1.1. Analytical Method
      In our earlier experiments with using computer vision to understand the mass of materials we
had collected [9,41], we were pessimistic about the ability of models like Google’s Inception v3 to
identify what was in these images, because it was trained on a limited number of categories, and none
of these categories were germane to human remains; indeed, we found that Google Inception would
often guess ‘jellyfish’ when the picture was of a skull displayed on a dark background, as pictures of
jellyfish similarly have a bright, smooth area of color contrasted against the black of the ocean deep.
However, since our initial experiments, it appears that the major technology firms have made huge
strides in identifying materials within photos, a process known as automatic image annotation or
tagging. Microsoft offers an API (application programming interface) for their image tagging service: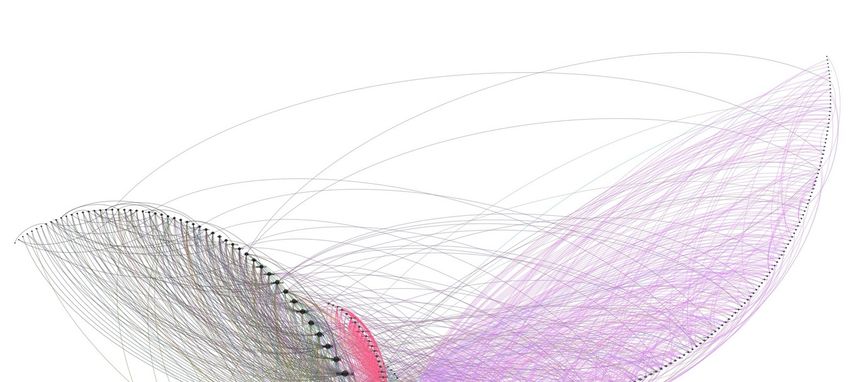
Heritage 2020, 3                                                                                         213

      Computer Vision returns tags based on thousands of recognizable objects, living beings, scenery,
and actions. When tags are ambiguous or not common knowledge, the API response provides ’hints’ to
clarify the meaning of the tag in the context of a known setting. Tags are not organized as a taxonomy
and no inheritance hierarchies exist. A collection of content tags forms the foundation for an image
’description’ displayed as human readable language formatted in complete sentences [42].
      According to the industry blog Techcrunch [43], the API has the ability to parse over 10,000
concepts, objects, and scenes (collections of concepts and objects understood probabilistically as being
part of a larger idea: Candles + cake + blowing = birthday party). What is attractive here is the ability
to make use of Microsoft’s computing infrastructure at a low cost (currently, an introductory offer
gives 250 USD in credits for computing time; this experiment detailed here has so far cost us 20 CAD),
and to use this feature of the API providing ‘hints’. That is to say, the tags suggested for any given
image are contextualized by their appearance together (or not) in other images of known content.
What is not clear from Microsoft’s documentation is how big their training set is, or how the training
images were first annotated. Microsoft Research provides links to papers and videos its researchers
have produced; Fu and Rui [44] survey the various approaches to automated image tagging. At the
time of their writing, they point to a combination of noisy datasets used for training (such as Flickr
photos tagged by humans) and contextual clues (using word-embeddings; see [45] for an introduction
to these) to learn the probabilities that tags ‘go together’ in meaningful ways (or to put it another way,
some tags preclude the likelihood of others). It is not apparent at all what or how Microsoft Azure has
‘learned’ how to tag images; this is no doubt a trade secret. What is apparent is that their technique
is a refinement of existing techniques with which we are already familiar and whose workings we
understand in broad strokes.
      Our method for analyzing the images, then, is straightforward:

1.    Feed all the images for a user or the search results of a hashtag to Microsoft Azure for tagging
      using the computer vision client library with Python [46].
2.    Take the resulting list of image—tag—probability and treat it as a two-mode network by reshaping
      it as a list of image_node -> tag_node pairs with edge_weight (probability).
3.    Filter out to retain only the most probable image–tag pairs (greater than 90% probability).
4.    Project this two-mode network into two one-mode networks using the multi-mode projection
      plugin for the open-source network analysis program Gephi. The resulting networks connect
      image_node to image_node by virtue of shared tags, and tag_node to tag_node by virtue of
      shared images. The weight of the edges in these reprojected networks is a function of the original
      probability and the count of shared connections.
5.    Examine the tag-to-tag network for sub-patterns of similar connections, making distinct groups,
      using the community detection algorithm in Gephi. These are called ‘modules’ or ‘communities’.
      These sub-patterns can then be characterized by their tags or images and used to understand the
      sensory affect of this ‘place’ on the web—the user’s account page or the hashtag search results
      page. This sensory affect tells us something meaningful about how people are constructing ‘new’
      archaeological sites from the human remains they collect.
6.    Identify the most important tags by virtue of their centrality in the network (the measurement we
      use is eigenvector centrality, a measure that captures the idea that a node is highly important by
      being connected to other highly important nodes; one might have encountered this concept in
      relation to Google’s PageRank algorithm).

3. Results

3.1. What Does the Machine See?
      The output of the first step in the process, the assignment of tags, produces files that look somewhat
like this (actual filenames contain Instagram identifiers that could conceivably be used to backtrack to
the original account, and thus will not be shared here):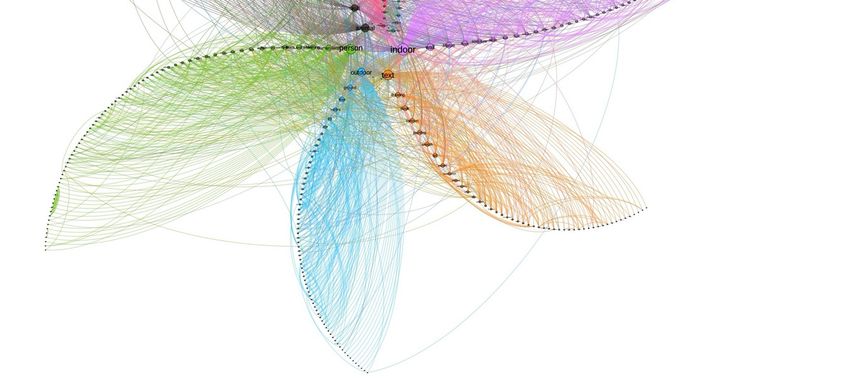
Heritage 2020, 3                                                                                        214

      1.jpg,indoor,97.5464642
      1.jpg,statue,95.50700188
      1.jpg,skull,89.82856274
      2.jpg, wall,98.99296761
      2.jpg,person,98.31568003
      2.jpg,indoor,96.4451313

       Azure hedges its bets with its statement of probability, which is a function of its original training
set or a measurement of the input photograph against the ‘platonic’ ideal for a ‘person’ that it knows.
       We may make some observations on the output at this stage:
       - Azure seems to be very good at identifying ‘skulls’, even when these are partial fragments, and
it seems to mean ‘human skulls’ for the most part. It will qualify ‘skull’ with ‘mammal’, ‘primate’, or
‘anthropological’ when the skull has had cultural modifications or additions made to it.
       - While there are very few actual reptiles in the photo collections, Azure frequently tags a photo
with ‘reptile’ or ‘dinosaur’. Examining images tagged like this shows an interesting example of a kind
of machinic pareidolia. The vendors will display and sell partial bones—parts of the knee, or a quarter
of a pelvis with a bit of thigh bone, for instance, which they mount and light as they will other more
complete bones. These photos, if you squint at them, can look like a long saurian neck with a head.
       - For Vendor B, the photo with the strongest ‘museum’ assignment (>90%) depicts in the
foreground an apparently Dayak skull, on a coffee table, with a display case containing more skulls in
the background. The display case contains other skulls in bell jars, arranged across four shelves. Other
images with strong ‘museum’ assignments show close-ups of adult or infant skulls, arranged on glass
shelving. One shows a skeleton laid out on what looks like hessian cloth, taken from an oblique angle
looking along from the feet towards the head—an angle of display that would not be out of place in a
museum. In any event, the presence of a display case, glass shelving, or a stand seems to be one of the
strongest indicators for ‘museum’ to Azure. Other images with the ‘museum’ tag, but not as strongly
assigned, seem to have dramatic lighting in common, an object sharply defined in the foreground, and
a uniform background, which seems to recall museum or auction house catalogue photography.
       - Vendor B also has a curious ‘doughnut’ tag, which, in the network of tags (see next section), is
part of the constellation of connections describing bones and their origins. Examining the tags for
individual images that have the ‘doughnut’ assignment, we find patterns like this: Doughnut, 99.70;
indoor, 96.43; museum, 61.36; stone, 37.83; wall, 98.31. This particular image depicts a skull, heavily
damaged by root action and with a dark patina, displayed on a wood block against a beige wall, and
with a large square hole in the left parietal bone. Azure has done a good job describing the scene, even
if it has misunderstood some of the particulars. Other ‘doughnuts’ include more skulls with similar
cuts in them, but also skulls in dramatic lighting that highlight one eye socket over another.
       - With regard to the photos created by Vendor C, Azure sees ‘artifacts’ with more probability than
in the other collections. What is an ‘artifact’ to the machine? Looking at the thusly assigned images,
we see that this vendor constructs their photos such that the background is a soft-blurred table, slightly
angled to take up 1/3 of the field, with black matte walls/background, and the skulls (or other bones) in
3/4 profile on wooden lacquered stands. When Azure assigns the tags to these images, it also can be
read as describing the scene: Table, 98.42; indoor, 98.14; museum, 97.16; skull, 96.91; sitting, 95.47; art,
93.88; animal, 84.43; artifact, 75.47; bone, 74.01; wooden, 72.25; sculpture, 70.25; vase, 66.45.
       - In the collection of photos retrieved from a search of Instagram for ‘humanskullsforsale’, there is
a curious tag, ‘arthropod’. Arthropods are invertebrate creatures with exoskeletons. This is another
case of mechanic pareidolia. Examining these images, we actually find depictions of human remains in
or on the ground, sometimes articulated and apparently in situ, sometimes disturbed and scattered.
We see skeletons in the earth; the machine sees exoskeletons. The associated posts largely come from a
single vendor (who was hitherto unknown to us) who advertises that they will obtain remains to order.
Heritage 2020, 3 215
Heritage 2020, 3 8
NB. In the discussion that follows, the results discussed are post filtering of the original assignments
NB. by
returned In the
theAzure
discussion
servicethat follows,
for just the probable
the most results tags.
discussed are post filtering of the original
assignments returned by the Azure service for just the most probable tags.
3.2. Results by Individual ‘Sites’
3.2. Results by Individual ‘Sites’
3.2.1. Vendor A
3.2.1. Vendor A
Vendor A has well over 3000 followers. The tags for this vendor are fully connected: There are no
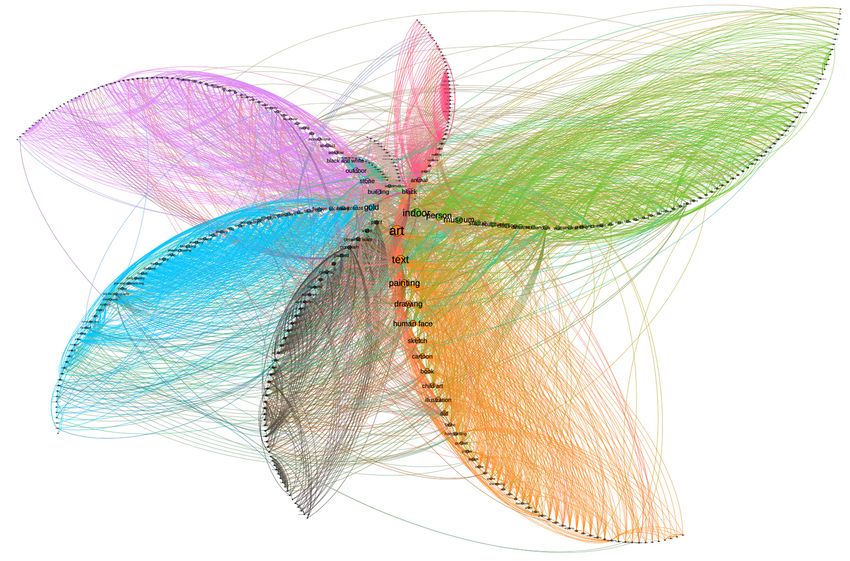
isolates, indicating a singularity of purpose (see Figure 1). Overall top tags by eigenvector and module:
Figure 1. A visualization of the major tags assigned to Vendor A’s photographs. Nodes represent tags,
Figure 1. A visualization of the major tags assigned to Vendor A’s photographs. Nodes represent tags,
edges represent photographs. Radial axes lay out where each spar is a subcommunity; subcommunities
edges represent photographs. Radial axes lay out where each spar is a subcommunity;
are also indicated by color; the size of the node indicates relative importance. The layout obscures some
subcommunities are also indicated by color; the size of the node indicates relative importance. The
of the smaller subcommunities.
layout obscures some of the smaller subcommunities.
Indoor 11, text 3, person 11, animal 0, outdoor 1, skull 0, wall 11, statue 7, mammal 0, human face 11.
Vendor A has well over 3000 followers. The tags for this vendor are fully connected: There are
Six distinct sub-communities of tags (out of 25) account for >90% of the unique tags (Table 2).
no isolates, indicating a singularity of purpose (see Figure 1). Overall top tags by eigenvector and
There are 408 unique machine-assigned tags describing this vendor’s images.
module:
Indoor 11, text 3, person 11, animal 0, outdoor 1, skull 0, wall 11, statue 7, mammal 0, human face 11.
Six distinct sub-communities of tags (out of 25) account for >90% of the unique tags (Table 2).
There are 408 unique machine-assigned tags describing this vendor’s images.Heritage 2020, 3 9
Table 2. Vendor A’s most important tags in those sub-communities by eigenvector.
Module
Heritage 2020, 3 % of Tags Most Important Tags 216
indoor, person, wall, human face, floor, clothing, sitting, black and
11 Table 2.41
Vendor A’s most important tags in thosewhite,
sub-communities
man, tableby eigenvector.
Module % of Tags Most Important Tags
outdoor, ground, tree, building, sky, grass, tire, water, vehicle, land
1 16 indoor, person, wall, human face, floor, clothing, sitting, black and white,
11 41 vehicle
man, table
0 1 16
13 outdoor, skull,
animal, ground, tree, building,
mammal, bone,sky, grass,dog,
reptile, tire, water, vehicle,
primate, black,land
cat,vehicle
carnivore
0 13 animal, skull, mammal, bone, reptile, dog, primate, black, cat, carnivore
text, drawing, book, cartoon, painting, sketch, art, poster, screenshot,
3 3 12 text, drawing, book, cartoon, painting, sketch, art, poster, screenshot, abstract
abstract
weapon, tool, handgun, rifle, sword, melee weapon, cold weapon, blade,
2 6
dagger,
weapon, tool, handgun, rifle, shotgun
sword, melee weapon, cold weapon, blade,
2 6
statue, sculpture, museum, bronze sculpture,
dagger, shotgun metalware, dark, ceramic,
7 3
ancient, chain, monochrome
statue, sculpture, museum, bronze sculpture, metalware, dark, ceramic,
7 3
3.2.2. Vendor B ancient, chain, monochrome
This vendor has over 10,000 followers. Figure 2 visualizes the network of tags in this vendor’s
3.2.2. Vendor BThe overall top tags by eigenvector and module:
photographs.
2. AAvisualization
Figure 2.
Figure visualizationof
ofthe
themajor
majortags
tagsassigned
assignedto
toVendor
VendorB’s
B’sphotographs.
photographs. Nodes
Nodesrepresent
representtags,
tags,
edges represent
edges representphotographs.
photographs.Radial axes lay
Radial outlay
axes where
outeach spar iseach
where a subcommunity;
spar is a subcommunities
subcommunity;
are also indicated by color. The size of the node indicates relative importance. The layout obscures
subcommunities are also indicated by color. The size of the node indicates relative importance. The
some of the smaller subcommunities.
layout obscures some of the smaller subcommunities.
Indoor 0, person 0, animal 4, skull 4, statue 0, bone 4, outdoor 1, sculpture 2, mammal 4, clothing 1.
This vendor has over 10,000 followers. Figure 2 visualizes the network of tags in this vendor’s
Six distinct sub-communities of tags (out of 16) account for >90% of the unique tags (Table 3).
photographs. The overall top tags by eigenvector and module:
There are 126 unique machine-assigned tags describing this vendor’s images.
Indoor 0, person 0, animal 4, skull 4, statue 0, bone 4, outdoor 1, sculpture 2, mammal 4, clothing 1.
Six distinct sub-communities
Table 3. Vendor B’s mostofimportant
tags (outtags
of 16) account
in those for >90% of by
sub-communities theeigenvector.
unique tags (Table 3).
There are 126 unique machine-assigned tags describing this vendor’s images.
Module % of Tags Most Important Tags
0 35 indoor, person, wall, sitting, table, floor, human face, smile, man, dog
1 26 outdoor, clothing, ground, grass, footwear, tree, cave, building, sky, seafood
4 14 animal, skull, bone, mammal, primate, reptile, skeleton, anthropology, doughnut
statue, sculpture, art, drawing, museum, bronze sculpture, sketch, painting,
2 10
mask, cartoon
3 4 tire, basket, container, wheel, autopart (these are all of the tags in the module)
5 3 shelf, different, bunch, flower (these are all of the tags in the module.doughnut
statue, sculpture, art, drawing, museum, bronze sculpture, sketch,
2 10
painting, mask, cartoon
Heritage 2020, 3 217
tire, basket, container, wheel, autopart (these are all of the tags in the
3 4
module)
3.2.3. Vendor C
5 3 shelf, different, bunch, flower (these are all of the tags in the module.
This vendor has just over 1000 followers. The tags for this vendor are in two broad clumps,
indicating twoCvery distinct interests (Figure 3). Overall top tags by eigenvector and module:
3.2.3. Vendor
Figure 3. A visualization of the major tags assigned to Vendor C’s photographs. Nodes represent tags,
Figure 3. A visualization of the major tags assigned to Vendor C’s photographs. Nodes represent tags,
edges represent photographs. Radial axes lay out where each spar is a subcommunity; subcommunities
edges represent photographs. Radial axes lay out where each spar is a subcommunity;
are also indicated by color. The size of the node indicates relative importance. The unconnected
subcommunities are also indicated by color. The size of the node indicates relative importance. The
component is not depicted. The layout obscures some of the smaller subcommunities.
unconnected component is not depicted. The layout obscures some of the smaller subcommunities.
Indoor 0, skull 1, art 3, statue 3, museum 3, bone 3, animal 1, wooden 2, sculpture 3, skeleton 3.
This vendor has just over 1000 followers. The tags for this vendor are in two broad clumps,
Six distinct sub-communities of tags (out of 10) account for >90% of the unique tags (Table 4).
indicating two very distinct interests (Figure 3). Overall top tags by eigenvector and module:
There are 197 unique machine-assigned tags describing this vendor’s images.
Indoor 0, skull 1, art 3, statue 3, museum 3, bone 3, animal 1, wooden 2, sculpture 3, skeleton 3.
Six distinct
Table sub-communities of tags (out
4. Vendor C’s most important of 10)
10 tags account
in those for >90% of the
sub-communities unique tags (Table 4).
by eigenvector.
There are 197 unique machine-assigned tags describing this vendor’s images.
Module % of Tags Most Important Tags
art, statue, museum, bone, sculpture, skeleton, anthropology, artifact,
3 24
fossil, mask
1 18 skull, animal, reptile, wall, person, close, hand, food, cave, turtle
indoor, cluttered, tool, tableware, glass, bottle, bowl, sewing machine, counter,
0 16
engineering
2 14 wooden, table, black, vase, sitting, dark, dessert, bronze, lamp, bird
mammal, floor, wood, shelf, cabinet, household hardware, furniture, door
8 11
handle, cat, carnivore
text, symbol, book, design, handwriting, menu, earthenware, pottery,
6 8
screenshot, font
3.2.4. Vendor D
This vendor has just over 1000 followers. The tags for this vendor are fully connected (Figure 4).
Overall top tags by eigenvector and module:text, symbol, book, design, handwriting, menu, earthenware, pottery,
6 8
screenshot, font
Table 4. Vendor C’s most important 10 tags in those sub-communities by eigenvector.
Heritage 2020, 3 218
3.2.4. Vendor D
Figure 4. A visualization of the major tags assigned to Vendor D’s photographs. Nodes represent tags,
Figure 4. A visualization of the major tags assigned to Vendor D’s photographs. Nodes represent tags,
edges represent photographs. Radial axes lay out where each spar is a subcommunity; subcommunities
edges represent photographs. Radial axes lay out where each spar is a subcommunity;
are also indicated by color. The size of the node indicates relative importance. The layout obscures
subcommunities are also indicated by color. The size of the node indicates relative importance. The
some of the smaller subcommunities.
layout obscures some of the smaller subcommunities.
Indoor 1, animal 0, text 6, skull 0, floor 1, person 6, black and white 1, wall 6, drawing 6, mammal 0.
This vendor has just over 1000 followers. The tags for this vendor are fully connected (Figure 4).
Six distinct sub-communities of tags (out of 10) account for >90% of the unique tags (Table 5).
Overall top tags by eigenvector and module:
There are 105 unique machine-assigned tags describing this vendor’s images.
Indoor 1, animal 0, text 6, skull 0, floor 1, person 6, black and white 1, wall 6, drawing 6, mammal 0.
Six distinct
Tablesub-communities
5. Vendor D’s mostofimportant
tags (outtags
of in
10)those
account for >90% ofby
sub-communities the unique tags (Table 5).
eigenvector.
There are 105 unique machine-assigned tags describing this vendor’s images.
Module % of Tags Most Important Tags
1 30 indoor, floor, black and white, wall, cat, statue, sculpture, carnivore, food, table
text, person, drawing, sketch, painting, human face, aquarium, cartoon, book,
6 26
hand (museum occurs in this module in 15th place)
animal, skull, mammal, primate, bone, reptile, dinosaur, skeleton, crocodilian
0 15
reptile, snake
invertebrate, insect, butterfly, arthropod, spider, moths and butterflies, oven, crab,
4 9
beetle (this is all of the tags for the module)
drink, soft drink, cocktail, cup, water, dairy, reef, bottle (this is all of the tags for
5 8
the module
weapon, kitchen utensil, knife, gun, scissors, melee weapon, pair (this is all of the
3 7
tags for the module)
3.2.5. Vendor E
This vendor has less than 100 followers. The tags for this vendor are fully connected (Figure 5):
There are no isolates, indicating a singularity of purpose. Overall top tags by eigenvector and module:Heritage 2020, 3 219
Heritage 2020, 3 13
Figure
Figure 5. 5.
AA visualizationofofthe
visualization themajor
majortags
tagsassigned
assignedto toVendor
VendorE’s
E’sphotographs.
photographs. Nodes
Nodes represent tags,
edges
edges represent
represent photographs.
photographs. RadialRadial
axes layaxes lay out
out where eachwhere
spar is aeach spar is a subcommunities
subcommunity; subcommunity;
aresubcommunities
also indicated byarecolor.
also indicated
The size ofbythe
color.
node The size of the
indicates nodeimportance.
relative indicates relative importance.
Indoor
This 0, wall 0,has
vendor skull 0, than
less animal 0, followers.
100 dinosaur 0,The
bonetags
0, skeleton
for this0,vendor
mammalare0,fully
primate 0, butterfly
connected 1. 5):
(Figure
Two distinct sub-communities of tags (out of 3) account for >90% of the unique tags
There are no isolates, indicating a singularity of purpose. Overall top tags by eigenvector and module: (Table 6).
There are 23 unique
Indoor machine-assigned
0, wall 0, tags describing
skull 0, animal 0, dinosaur 0, bone 0,this vendor’s
skeleton images.
0, mammal 0, primate 0, butterfly 1.
Two distinct sub-communities of tags (out of 3) account for >90% of the unique tags (Table 6).
There are 23 Table 6. Vendor
unique E’s most important
machine-assigned tags in thosethis
tags describing sub-communities by eigenvector.
vendor’s images.
Module % of Tags Most Important Tags
indoor, wall, skull, animal, dinosaur, bone, skeleton, mammal, primate, reptile
0 70 (‘museum’ appears in this module, but at 86% probability, and so has been
filtered out)
butterfly, invertebrate, moths and butterflies, text, insect (these are all the tags
1 22
for the moduleTable 6. Vendor E’s most important tags in those sub-communities by eigenvector.
Module % of Tags Most Important Tags
Heritage 2020, 3
indoor, wall, skull, animal, dinosaur, bone, skeleton, mammal, primate, 220
0 70 reptile (‘museum’ appears in this module, but at 86% probability, and so has
been filtered out)
3.2.6. Instagram Search Results for ‘humanskullsforsale’
butterfly, invertebrate, moths and butterflies, text, insect (these are all the
1 On 5th February,
22 2020, a scrape of the Instagram hashtag ‘humanskullsforsale’ retrieved 116
tags for the module
unique posts. Figure 6 visualizes the network of tags in this vendor’s photograph. There are 166
unique machine-assigned tags describing the images returned by a search for the Instagram hashtag.
3.2.6.
ThereInstagram
were sevenSearch Results
modules forconnected
in one ‘humanskullsforsale’
component. Overall top tags by eigenvector and module:
Figure 6. A visualization of the major tags assigned to photographs returned from a search of
‘humanskullsforsale’. Nodes
Figure 6. A visualization of represent
the majortags,
tagsedges represent
assigned photographs.returned
to photographs Radial axes
fromlaya out where
search of
each spar is a subcommunity;
‘humanskullsforsale’. subcommunities
Nodes represent are also
tags, edges indicated
represent by color. The
photographs. size ofaxes
Radial the node indicates
lay out where
relative
each importance.
spar The layout subcommunities
is a subcommunity; obscures some of are
the smaller subcommunities.
also indicated by color. The size of the node
indicates relative importance. The layout obscures some of the smaller subcommunities.
Skull 2, animal 4, mammal 4, bone 2, skeleton 2, art 1, different 1, fossil 2, indoor 0, sculpture 6.
Six distinct
On sub-communities
5th February, of tags
2020, a scrape (outInstagram
of the of 7) account for >90%
hashtag of the unique tagsretrieved
‘humanskullsforsale’ (Table 7).116
unique posts. Figure 6 visualizes the network of tags in this vendor’s photograph. There are 166
Table 7. The 10 most important tags in those sub-communities by eigenvector for Instagram search
unique machine-assigned tags describing the images returned by a search for the Instagram hashtag.
results for hashtag ‘humanskullsforsale’.
There were seven modules in one connected component.
Overall top
Module tags
% of by eigenvector and module: Skull
Tags 2, animal
Most 4, mammal
Important Tags 4, bone 2, skeleton 2, art 1,
different 1, fossil 2, indoor 0, sculpture 6.
art, different, colored, several, drawing, invertebrate, arthropod, plant,
1 23
Six distinct sub-communities of tags (out of 7) account forpainting
flower, >90% of the unique tags (Table 7).
2 19 skull, bone, skeleton, fossil, anthropology, primate, extinction, museum, close, jaw
4 19 animal, mammal, outdoor, dirt, wooden, cave, reptile, trunk, deer, antler
5 19 text, person, hand, cartoon, poster, man, screenshot, book, various, human face
0 11 indoor, floor, pan, lined, cluttered, food, vegetable, table, bread, furniture
6 8 sculpture, statue, ground, dirty, old, stone, ancient, door, weapon, toolskull, bone, skeleton, fossil, anthropology, primate, extinction, museum,
2 19
close, jaw
4 19 animal, mammal, outdoor, dirt, wooden, cave, reptile, trunk, deer, antler
Heritage 2020, 3 221
text, person, hand, cartoon, poster, man, screenshot, book, various, human
5 19
face
3.2.7. The British Museum Instagram User Page
0The British Museum
11 indoor,
has over 1floor, pan,followers
million lined, cluttered, food, vegetable,
on Instagram. table, bread,
On 28th February, furniture
2020, a scrape
of the Instagram user account for the British Museum downloaded 462 unique posts. There are
6 8 sculpture, statue, ground, dirty, old, stone, ancient, door, weapon, tool
373 unique machine-assigned tags describing the images. There were 10 modules in one connected
component (Figure 7). Overall top tags by eigenvector and module:
3.2.7. The British Museum Instagram User Page
Figure 7.7.AAvisualization
Figure of the
visualization major
of the tags tags
major assigned to photographs
assigned on the British
to photographs on theMuseum’s Instagram
British Museum’s
page. Nodes
Instagram represent
page. Nodes tags, edges
represent represent
tags, photographs.
edges represent Radial axes
photographs. layaxes
Radial out where
lay outeach
wherespar is a
each
subcommunity; subcommunities
spar is a subcommunity; are also are
subcommunities indicated by color.byThe
also indicated sizeThe
color. of the
sizenode
of theindicates relative
node indicates
importance. The layout
relative importance. Theobscures some ofsome
layout obscures the smaller subcommunities.
of the smaller subcommunities.
Art
The4,British
text 4,Museum
indoor 5, has
painting
over 14,million
person 5, drawingon
followers 4, museum 5, gold
Instagram. 2, human
On 28th face 4,2020,
February, statue 5.
a scrape
Seven distinct sub-communities of tags (out of 10) account for >90%
of the Instagram user account for the British Museum downloaded 462 unique posts. There are 3738).
of the unique tags (Table
unique machine-assigned tags describing the images. There were 10 modules in one connected
The 10 most
Table 8. (Figure
component 7). important tags in those sub-communities by eigenvector in the British Museum
photos.
Module % of Tags Most Important Tags
building, stone, outdoor, black and white, window, abstract, monochrome, sky,
1 19
ceiling, roof
5 19 indoor, person, museum, statue, sculpture, clothing, different, woman, dark, wall
gold, bronze, brass, fashion accessory, coin, silver, metal, pendant, gemstone,
2 15
platinum
plant, vase, ceramic ware, porcelain, painted, jar, ceramic, cup, displayed,
3 13
tableware
4 13 art, text, painting, drawing, human face, sketch, cartoon, book, child art, illustration
7 12 black, animal, ground, cat, carnivore, mammal, sitting, reptile, horse, laying
water, reef, underwater, diving, swimming, aquarium, scuba, fish, ocean floor,
0 5
water sportHeritage 2020, 3 222
3.2.8. Network Metrics
Intuitively, when we look at the visualizations of the networks in Figures 1–7, we can see by
eye that the subcommunities within each network are distributed in what appear to be interesting
ways. Recall that these networks are formed by projecting the most probable image–tag pairs and their
probability into a network where tags are connected to other tags by virtue of being assigned to the
same photograph. The metrics listed in Table 9 capture the topologies of these networks.
Table 9. Descriptive statistics for the network shapes visualized in Figures 1–7.
Average Degree Density Diameter Average Path Length
Vendor A 13 0.03 5 2.4
Vendor B 12 0.03 5 2.4
Vendor C 15 0.08 4 2.6
Vendor D 6 0.06 5 2.6
Vendor E 5 0.25 3 2
Search Results 13 0.03 5 2.4
British Museum 21 0.06 5 2.4
‘Average degree’ means the average number of connections for any one node; here, we can
understand that as the average number of photographs that any one tag will be associated with.
‘Density’ is the proportion of existing edges against the total number of edges that could exist (i.e.,
if every node is connected to every other node, then density = 1). The ‘diameter’ of a network is the
longest of all of the possible shortest paths between every pair of nodes in the network; that is to say,
if one picked any two nodes at random, no shortest path between them would be longer than the
diameter. The ‘average path length’ is the average length of all those shortest paths.
Average degree might on first blush appear to not be a very useful measure for us, since one might
expect it to be a function of the number of photos originally analyzed in the first place. This does not
seem to be the case—for instance, Vendor A and the Search Results network were generated from 6381
and 245 photos, respectively, which suggests to us that average degree is a reflection of visual richness
within photographs.
When we search Instagram for ‘humanskullsforsale’, we get back a page of results where every
post—whether or not it actually depicts a human skull—has been marked up that way deliberately.
It is striking that the network topology for the results for the search are identical to those of Vendor A
and Vendor B, the major vendors. Vendors D and E, the two smallest vendors in terms of numbers of
followers, have networks that differ dramatically in terms of density. We might interpret this to mean
that Vendor E’s photos, while not visually rich (as indicated by average degree), are thematically tight
(density of connections).
Diameter and average path length are two different facets of the same action, that of traversing the
network; we might think of these as being expressions of the way the different tags start to cohere into
‘scenes’ or descriptive sentences. In which case, Vendor E (while having more photos than Vendors C
and D and the Search Results network) has photos that are semantically sparse.
4. Discussion
The machine sees different elements in an image, and composes rich sets of tags for each image
to capture the objects it identifies, the nouns, and sometimes adjectives. It can clarify what it means
by collating nouns together, e.g., painting, abstract, monochrome, outside, atmosphere. The machine
sometimes experiences a kind of pareidolia, which, when we unpack it, might also point to a way to
automatically flag images for human inspection (the ‘doughnuts’ or the ‘arthropods’). We can then treat
these assignments as a kind of network, and begin to pair nouns together tied by their co-assignmentHeritage 2020, 3 223
to photographs; the emergent clusters give us an affective sense of what this site (this Vendor, the results
of this Search, this museum) is like, what effect or feeling is evoked when visiting the site.
The absolute number of assigned tags indicates the visual richness of the collection. The
clumping—or not—into single connected components, as well as smaller diameter or shorter average
path lengths, may indicate thematic unity in the vendor’s presentation. The number and composition
of submodules indicates internal variety within that composition. The disconnected component in
Vendor C’s materials accounts for 6% of the tags: Sky, outdoor, mountain, cloud, nature, desert, landscape,
area, and stone, and clearly indicates that the vendor uses their account to also post their personal
interests or holiday pictures, which are sufficiently distinct that they do not interconnect with the
vendor’s business; this contrasts well with all of the other vendors whose tags all cycle back to their
business interests. Remember, this is apparent to a human eye, but the machine makes this distinction
as well, which is an important consideration as we scale up to the tens of thousands of photographs
and posts that we have collected. This might also be useful for comparing vendors’ behaviors across
platforms, for we know that these vendors are active on Facebook and other social media platforms, and
we might hypothesize that they compose sales images differently for different audiences or platforms.
It is worth pointing out that some of the least eigencentric words (that is, words that do the least
work in holding the network together) might be worth looking at too, since these might be the words
that Azure adds to provide context to its most likely labels, e.g., in module 2 for Vendor C, some of the
least important words are collection, display case, lots, drawer, chest of drawers, cabinetry, and filing cabinet,
which tells us something about the way this Vendor displays their materials. Considering the least
central words reminds us of discussions in the Digital Humanities regarding text analysis techniques,
such as topic modelling or term frequency—inverse distribution frequency about whether or not to
include stop-words. Stop-words are the very frequent words such as ‘the, of, and’ which seemingly do
not carry much weight for determining larger patterns, yet are very telling when we do work such as
author attribution or stylometry (see, for instance, [47,48]). Is what we are doing closer in concept to
topic modeling, or closer in concept to stylometry? We do not have an answer for this yet.
The frequent tag ‘text’ is interesting. Vendor A’s module 3 and Vendor C’s module 6, for instance,
point to the ways in which vendors embed text within the images to indicate items for sale, a practice
that hides posts from the more usual practice of analyzing the text of captions for materials for sale. The
permanent embedding of text into and onto the image itself seems to convince the machine that the
text is an artistic embellishment, design motif, or perhaps some sort of signature.
We will conclude by asking, “what is a ‘museum’ to the machine?” And, what is the sensory affect
thusly created? The result we get also tells us something of how individual sites (user pages, search
pages) on Instagram portray themselves:
Vendor A: Statue, sculpture, museum, bronze sculpture, metalware, dark, ceramic, ancient, chain,
monochrome.
Vendor B: Statue, sculpture, art, drawing, museum, bronze sculpture, sketch, painting, mask, cartoon.
Vendor C: Art, statue, museum, bone, sculpture, skeleton, anthropology, artifact, fossil, mask.
Vendor D: Text, person, drawing, sketch, painting, human face, aquarium, cartoon, book, hand.
Vendor E: Indoor, wall, skull, animal, dinosaur, bone, skeleton, mammal, primate, reptile.
Instagram Search: Skull, bone, skeleton, fossil, anthropology, primate, extinction, museum, close, jaw.
British Museum: Indoor, person, museum, statue, sculpture, clothing, different, woman, dark, wall.
The only actual museum in this experiment has a far more equal distribution in terms of the
size of its subcommunities, representing much more varied content, but at the same time, these
subcommunities are all still interconnected, suggesting an overarching ideal guiding what gets posted
(e.g., the underwater pictures depict underwater archaeology). This more equal distribution is most
likely an artefact of the museum’s social media pages being perhaps curated by several employees,
perhaps each from different departments of the museum, and each given individual reign to select
representative photographs. This approach to digital outreach is common throughout the museumYou can also read