Trauma Care in Tennessee - Trauma Care Advisory Council 2019 Report to the 111th General Assembly - TN.gov
←
→
Page content transcription
If your browser does not render page correctly, please read the page content below
Trauma Care Advisory Council

Trauma Care in
Tennessee
2019 Report to the 111th General Assembly

                Tennessee Department of Health

                  Trauma Care Advisory Council

                         March 31, 2020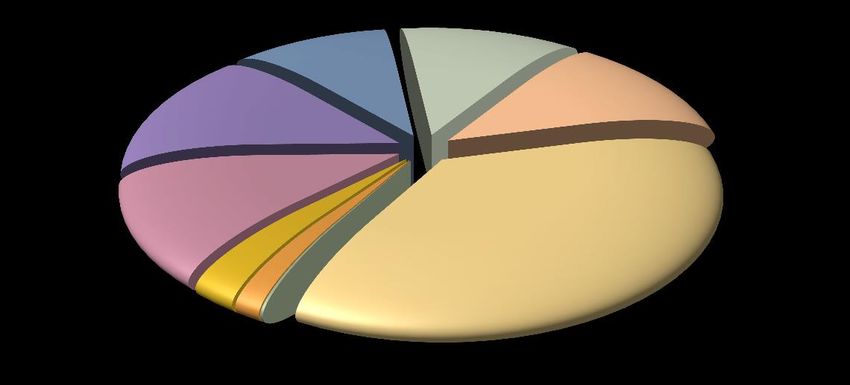
AUTHORSHIP

Oscar Guillamondegui, MD, MPH, FACS
Professor of Surgery
Vanderbilt University Medical Center
Chair, Trauma Care Advisory Council
Chair, Tennessee Committee on Trauma

Robert E. Seesholtz, BSN, RN, EMT-P
Trauma System Manager
Tennessee Department of Health

                                       2
Table of Contents                                                                                                Page

Overview                   Letter to the General Assembly...................................................                 4

                           Executive Summary.....................................................................            5

System Components          Trauma Center Funding...............................................................              7

                           Trauma Registry…………………........................................................                    9

                           Research......................................................................................    9

                           Outreach......................................................................................    9

Appendices          I:     Trauma Center Locations............................................................              10

                    II:    Trauma Registry Reports.............................................................             11

                    III:   Trauma Fund Distribution 2018..................................................                  19

                    IV:    Research Publication Listing........................................................             22

                                                   3
STATE OF TENNESSEE
DEPARTMENT OF HEALTH
DIVISION OF HEALTH LICENSURE AND REGULATION
TRAUMA CARE ADVISORY COUNCIL
665 MAINSTREAM DRIVE
NASHVILLE, TN 37243
March 31, 2020
Dear Members of the General Assembly,
As required by Tenn. Code Ann §68-59-103, we are pleased to submit our Annual Trauma
Report. This report reflects activities and accomplishments of the Trauma Care Advisory
Council (TCAC) and Tennessee’s designated Trauma Hospitals.
The Trauma Care Advisory Council was implemented in 1990 to advise the Board for Licensing
Health Care Facilities and the Emergency Medical Services (EMS) Board in regards to
regulatory standards to ensure the adequacy of statewide trauma care. Rule promulgation is
guided by national standards.
In 2007, the General Assembly enacted the Trauma Fund Law, providing valuable resources to
support and maintain Tennessee’s vital Trauma System.
The data in this publication give an overview of patients cared for in Tennessee designated
Trauma Centers and Comprehensive Regional Pediatric Centers. With your ongoing support, the
TCAC hopes to continue to expand access to quality trauma care for injured Tennesseans.
Respectfully Submitted,
Oscar Guillamondegui, MD, MPH, FACS
Professor of Surgery
Vanderbilt University Medical Center
Chair, Trauma Care Advisory Council
Chair, Tennessee Committee on Trauma
42019 EXECUTIVE
SUMMARY
Over calendar year 2018, 35,712 patients received care in a state designated or American
College of Surgeons (ACS)-verified adult and/or pediatric trauma center or a Comprehensive
Regional Pediatric Center (CRPC) due to trauma-related injury. The total number of patients
managed in centers designed to improve the care of the injured has risen by approximately
1200 patients over previous years 34, 544. The effect of the care in these institutions has been to
reduce the potential years of life lost, increase the potential return to family, work, and community in
the best possible condition.
Along with managing patients affected by trauma, a mandate of every trauma center is outreach
and prevention. Raising awareness around both pediatric and adult causes of trauma from teen
suicide and seatbelt use to helmet use in all possible situations along with fall prevention in the
elderly has been paramount for the Trauma Care Advisory Council (TCAC) with the help of the
Tennessee Committee on Trauma. Most importantly, though, is the maintenance of trauma
center excellence to ensure optimal care of the injured. Our trauma centers provided care for
Tennesseans from every county in the state, as well as patients from nearly every state in the
continental US.
The Trauma Care Advisory Council (TCAC) was established in 1990 to advise the Office of
Health Care Facilities regarding trauma care policy and regulation. Currently, Tennessee
has 5 Level I trauma centers, 2 Level II centers, 5 level III centers, and 2 provisional Level
III center, for 14 total adult centers. There are an associated 4 CRPC’s, two of which have
been verified by the ACS as Level 1 Pediatric Trauma Centers (Le Bonheur in Memphis and
Monroe Carrell in Nashville) treating those injured under the age of 16. This year, the
updated trauma center rules to include the verification process of the American College of
Surgeons Committee on Trauma to assess the programs at the highest national standard for
trauma care as well as designation guidelines was passed. TCAC has also provided support to
the Council on Pediatric Emergency Care (CoPEC) to update the rules for pediatric trauma.
There is an ongoing epidemic across Tennessee (and the nation) with elderly ground level falls
as the number one cause of trauma admission and mortality. The admissions and death rates
continue to climb as our population ages, accounting for greater than 50% of admissions in
several trauma centers. Unfortunately, motor vehicle crashes (MVCs) remain lethal and are the
second highest cause fatality rate in the state. Gun -related suicide death continues to overshadow
homicide at a rate of 2 to 1for both the state and national level.
This report provides information on injury patterns across the state, referral patterns, and
financial statistics. Other key aspects of this report include Injury Prevention actions and
statewide research efforts. It is the goal of the TCAC to target future outreach and prevention
activities through data from the state registry and to continually strive to improve patient
5outcomes through an array of performance improvement initiatives, research activities, and
outcomes-based evidence research. Such efforts consist of outreach to nursing homes and
specific communities to educate the elderly on fall risk, “Battle of the Belts” for high school
student awareness of seatbelt use and motorcycle and ATV safety education. The latest
initiative that has been rolled out by all trauma centers and will be the focus of May 21, 2020
is the ‘Stop the Bleed’ campaign-ensuring as many first responders, bystanders and others are
prepared in any situation to stop active hemorrhage in a trauma patient. So far, the efforts of
the trauma programs have led to educating over 5000 individuals across the state. This
includes school nurses, first responders and many members of congress.
This report also reflects the ongoing effort of the Trauma Centers as dedicated to caring for the
injured patient. As the number of trauma patients continues to increase in the state, we believe
the efforts of the trauma council are important to maintain and improve the outcomes of our
citizens across the entire state and with this in mind, we are aware that there are areas of the state
that remain outside the contiguous counties of the major metropolitan areas that are not within
easy reach of a designated trauma center. We continue to push for a formal universal system to
designate all hospital centers as Level I, II, III or IV, ensuring capture of all injured patients
and maintaining the highest possible level of trauma care for all Tennesseans. This would
require dedicated funding to preserve the infrastructure of many of the smaller, rural hospitals
to support a complete trauma system.
With your ongoing support we can continue with our mission of providing the highest level of
care, injury prevention, education, and research to minimize the death and disability occurring
as a result of injury across the state of Tennessee. Of note, this is my sixth and final year
chairing the TCAC and TN CoT, working alongside Rob Seesholtz and members of the state
team, and it has been an honor and a privilege.
Oscar D. Guillamondegui, MD, MPH, FACS
Chair, Trauma Care Advisory Council
Chair, Tennessee Committee on Trauma
6TRAUMA CENTER FUNDING
With the passage of the Tennessee Trauma Center Funding Law of 2007, the Trauma Care
Advisory Council was charged with developing recommendations on how to distribute Trauma
System Fund reserves. In keeping with the intent of the statute, three broad categories for
disbursement were identified:
1. Money to support the trauma system infrastructure at the state level:
The State Trauma System Manager is responsible for providing general oversight for
Tennessee’s Trauma Care System. Responsibilities include oversight of Tennessee’s
trauma fund, trauma registry, administrative support to the Trauma Care Advisory
Council, and the coordination of site visits for new and existing trauma centers. In
addition, trauma system infrastructure has been bolstered as monies were approved by
the Trauma Care Advisory Council for the expenditure on trauma education, trauma
registry improvements and a state-wide trauma symposium.
2. Readiness costs to designated trauma centers and comprehensive regional pediatric
centers:
Tennessee trauma centers and CRPC’s are ready at a moment’s notice to treat those
suffering from traumatic injury and are required to maintain life critical services 24
hours a day, 7 days a week, 365 days a year. While readiness costs disbursed from the
trauma fund cannot realistically compensate centers for all of their costs, readiness
funds help to ensure that these necessary life critical services are maintained.
Readiness cost amounts for state designated trauma centers and CRPC’s may be
found in appendix III.
3. Money for uncompensated care:
The trauma funding law provides for uncompensated care funding to be distributed
to: 1) designated trauma centers 2) comprehensive regional pediatric centers and 3)
other acute care hospitals functioning as a part of the trauma system.
Distribution to eligible hospitals is based on: 1) the level of funding within the reserve
account following infrastructure and readiness costs and 2) the documented level of
each hospital’s uncompensated trauma cost. Though this amount will vary from year
to year, at the end of 2018 this portion of the fund was approximately $7,283,384.96
Appendix III shows quarterly payments made to eligible hospitals for calendar year
2018.
Trauma Fund disbursement totals have seen a steady decline since the funds inception. Since
then, the trauma fund has decreased over $1,800,000.00 dollars making finding alternative
sources of funding a priority to ensure the viability of Tennessee’s Trauma System.
7Trauma Fund Disbursement Totals Since Inception
Calendar Year Trauma Fund Disbursement Totals
*Start of Trauma Fund 2008 $9,086,822.57
2009 $9,192,013.69
2010 $8,973,548.13
2011 $8,762,345.31
2012 $8,328,132.57
2013 $8,316,610.13
2014 $7,768,758.15
2015 $7,867,741.77
2016 $7,717,970.86
2017 $7,548,708.50
2018 $7,283,384.96
$1,803,437.61 below initial disbursement when trauma fund started
Tennessee's Trauma Fund
9,500,000.00
9,000,000.00
8,500,000.00
8,000,000.00
7,500,000.00
7,000,000.00
6,500,000.00
2008 2009 2010 2011 2012 2013 2014 2015 2016 2017 2018
8TRAUMA REGISTRY
The Tennessee Trauma Registry is the data repository for patients treated at Tennessee’s 13
participating trauma centers and 4 CRPC’s. This report is based on patient abstractions
completed through 2018. The registry reports represents views of the injuries sustained and
related hospital admissions in 2018 with additional trend reporting that includes the 8 years prior.
RESEARCH
Level 1 trauma centers are charged with performing research. These endeavors allow ongoing
improvements in care on a continuous basis. Appendix IV represents a sample of these state
wide research publication efforts.
OUTREACH & INJURY PREVENTION EFFORTS
Tennessee’s trauma centers and CRPC’s provide many different outreach and injury prevention
opportunities for both the public and for those who are responsible for the specialized care of
injured Tennesseans and visitors in our state. These outreach and injury prevention efforts are in
part targeted to injury trends seen by trauma centers and CRPC’s with the ultimate goal of
reducing the incidence of traumatic injury through targeted outreach and education.
9Appendix I:
Current Trauma Center Location & Level Designation
10Appendix II:
2018 Trauma Registry Reports
Figure 1a: 9 year trauma registry counts 2010 - 2018………………………………………………………………….. 12
1b: Injury Distribution by Facility Level
Figure 2a: Patient Counts by Payor Source ….…………………………………………………………………………….. 13
2b: Admission Services
Figure 3a: Patient Counts by Gender………………………..…………………………………………………………………. 14
3b: Patient Counts by Age Group and Gender
Figure 4: Patients Treated by State of Residence……………………………………………………………………….. 15
Figure 5a: Patient Counts by Transport Category ………………………………………………………………………… 16
5b: Patient Counts by Top Ten Chief Complaints
Figure 6a: Patient Counts by Hospital Disposition..…………………………………………………………………….. 17
6b: Patient Counts by Emergency Department Disposition
Figure 7a: Top Five Fatalities by Mechanism ………………………………………………………………………. 18
7b: Fatalities by Age Group
11Figure 1a:
9 YEAR TRAUMA REGISTRY COUNTS
35,712
34,544
31,878
28,647
24,394 23,660 23,827
22,650
20,460
2010 2011 2012 2013 2014 2015 2016 2017 2018
In 2018, 35,712 patients were entered in the state trauma registry as a result of meeting inclusion
criteria related to traumatic injury. The overall growth pattern of patient totals recorded in the registry
since 2010 is shown above.
Figure 1b:
Injuries Treated by Trauma Centers & CRPC’s
Level I
67%
Level II
12%
Level III
CRPC's 8%
13%
Level I Level II Level III CRPC's
As might be expected, over two thirds of all trauma patients for 2018 were treated at a Level 1 trauma
center.
12Figure 2a:
Patients by Payor Source
12,000 11,051
9,261
10,000
8,000
5,122
6,000 4,655
4,000 3,060
1,796
2,000 726
27 14
0
Medicare is currently the number one payor source for those receiving treatment at a trauma center or
CRPC in 2018.
Figure 2b:
Admission Services
19,313
20,000
18,000
16,000
14,000
12,000
10,000
8,000 6,257 5,898
6,000 2,987
4,000
606
2,000 203 187 102 46 45 21 20 13 12
0
The graph above reflects the surgical/medical admission services when being admitted for a traumatic
injury.
13Figure 3a:
Patient Counts by Gender
Male
59%
Female
41%
Male Female
20,988 14,721
59% of all patients treated at a Tennessee trauma center or CRPC were male. This 2018 data reflects a
1% percentage point decrease in male trauma patients and a one percentage point increase in female
trauma patients seeking treatment at trauma centers and CRPC’s.
Figure 3b
Patient Counts by Age Group and Gender
65+ yrs
55-64 yrs
45-54 yrs
35-44 yrs
25-34 yrs
15-24 yrs
5-14 yrs
1-4 yrs
< 01
0 1000 2000 3000 4000 5000 6000 7000
Female Male
The information above is reflective of trauma patients by age and gender. Females in the 65+ age
category made up 58 percent of the total in that age category.
14Figure 4:
76% of all trauma cases treated in Tennessee trauma centers or CRPC’s were Tennesseans (27,133); 24%
of all cases (8,579) were residents of other states.
15Figure 5a:
Patient Counts by Transport Category
30,000
26,455 25,898
24,982
23,495
25,000
18,806 18,864 19,242
20,000
15,000
10,000
5,588 4,796 4,585 5,152 5,583 4,845
4,523
5,000
0
2012 2013 2014 2015 2016 2017 2018
Ground Air
Patient transports by air travel to a trauma center or CRPC has shown a decrease compared to 2017.
Figure 5b:
Top Ten Chief Complaints
Stab Wound 536
489
Pedestrian 879
838
ATV 875
871
Other Mechanism 1,066
877
Motorcycle Crash 1,705
1,532 2017
Assault 1,885
1,581 2018
Gunshot Wound 1,921
1,640
Struck by Object 2,057
2,017
Motor Vehicle Crash 8,809
8,674
Fall 14,207
15,623
0 2,000 4,000 6,000 8,000 10,000 12,000 14,000 16,000
The graph above reflects a two year comparison of the top ten chief complaints for seeking treatment at
a trauma center or CRPC.
16Figure 6a:
Patient Counts by Hospital Disposition
Home 21,707
Nursing Home 4,303
Rehab Center 2,486
Not Available 1,955
Home Health 1,742
Died in Hospital 1,378
Transfer 1,342
Jail 397
AMA 376
Hospice 16
0 5000 10000 15000 20000 25000
60% percent of patients seeking care from a trauma facility in 2018 were released back to their home
while 12% were admitted into a nursing home upon hospital discharge. Approximately 4% of patients
had an outcome of death.
Figure 6b:
Patient Counts by Emergency Department Disposition
12,413
8,156
5,659
4,085 3,859
982 700
102 62
The majority of patients who met inclusion criteria for trauma registry submissions for 2018 were
admitted to a floor bed based on their disposition from the Emergency Department.
17Figure 7a:
Top 5 Fatalities by Mechanism of Injury
Fall 488
Motor Vehicle Crash 314
Gunshot Wound 252
Motorcycle Crash 81
Pedestrian 77
0 50 100 150 200 250 300 350 400 450 500
Fatalities from falls, motorcycle and pedestrian injuries have increased from the previous year’s totals.
Fatalities involving motor vehicle crashes and gunshot wounds have decreased.
Figure 7b:
Fatalities by Age Group
35-44 yrs 45-54 yrs
10% 11%
55-64 yrs
25-34 yrs
12%
14%
15-24 yrs
12%
65+
37%
5-14 yrs
3% 1-4 yrsAppendix III:
2018 Trauma Fund Distribution
FUNDS DISTRIBUTED TO TRAUMA CENTERS AND NON-TRAUMA CENTERS
FROM TENNESSEE TRAUMA FUND - FY2018 – 1st QUARTER DISTRIBUTION
Total
Hospital
Readiness Hospital
Level Hospital Name Specific Pool
Costs Distribution
Payment
Payment
TOTAL $1,155,549.77 $857,250.00 $2,012,799.77
Lev I Regional One Health $467,539.72 $97,250.00 $564,789.72
Lev I Vanderbilt University Hospital $253,845.94 $153,250.00 $407,095.94
Lev I Erlanger Medical Center - Baroness $119,652.17 $153,250.00 $272,902.17
Lev I The University of Tennessee Med. Cntr. $110,599.02 $102,250.00 $212,849.02
Lev I Johnson City Medical Center $42,626.54 $72,500.00 $115,126.54
Lev I Wellmont Holston Valley Medical Ctr. $25,131.20 $72,500.00 $97,631.20
Lev II TriStar Skyline Medical Center $45,405.19 $37,750.00 $83,155.19
PED LeBonheur Children Medical Center $9,251.75 $64,250.00 $73,501.75
PED East Tennessee Childrens Hospital $394.04 $51,000.00 $51,394.04
Lev II Wellmont Bristol Regional Med. Ctr. $12,076.18 $37,750.00 $49,826.18
Lev III TriStar Horizon Medical Center $4,852.93 $15,500.00 $20,352.93
Methodist Healthcare-Memphis Hospitals $20,352.93 $20,352.93
Erlanger North Hospital $10,049.05 $10,049.05
Jackson-Madison Cnty. General Hospital $9,857.04 $9,857.04
Saint Thomas West Hospital $4,610.66 $4,610.66
TriStar Summit Medical Center $3,510.02 $3,510.02
TriStar Southern Hills Medical Center $3,435.32 $3,435.32
Tennova Healthcre - Lebanon $2,669.70 $2,669.70
Maury Regional Medical Center $2,351.47 $2,351.47
Tennova Healthcare Physicians Regional M C $2,111.31 $2,111.31
Williamson Medical Center $1,769.63 $1,769.63
Methodist Medical Center of Oak Ridge $1,681.23 $1,681.23
Sumner Regional Medical Center $1,026.01 $1,026.01
CHI Memorial Hospital Hixon $677.62 $677.62
Tennova Healthcare Harton Medical Center $73.12 $73.12
19FUNDS DISTRIBUTED TO TRAUMA CENTERS AND NON-TRAUMA CENTERS
FROM TENNESSEE TRAUMA FUND - FY2018 – 2nd QUARTER DISTRIBUTION
Total
Hospital
Readiness Hospital
Level Hospital Name Specific Pool
Costs Distribution
Payment
Payment
TOTAL $844,417.03 $857,250.00 $1,701,667.03
Lev I Regional One Health $309,509.47 $97,250.00 $406,759.47
Lev I Vanderbilt University Hospital $215,536.01 $153,250.00 $368,786.01
Lev I Erlanger Medical Center - Baroness $81,494.41 $153,250.00 $234,744.41
Lev I The University of Tennessee Med. Cntr. $80,974.75 $102,250.00 $183,224.75
Lev I Wellmont Holston Valley Medical Ctr. $22,667.72 $72,500.00 $95,167.72
Lev II TriStar Skyline Medical Center $54,247.22 $37,750.00 $91,997.22
Lev I Johnson City Medical Center $17,317.22 $72,500.00 $89,817.22
PED LeBonheur Children Medical Center $10,134.94 $64,250.00 $74,384.94
PED East Tennessee Childrens Hospital $332.95 $51,000.00 $51,332.95
Lev II Wellmont Bristol Regional Med. Ctr. $7,012.86 $37,750.00 $44,762.86
Lev III TriStar Horizon Medical Center $1,278.90 $15,500.00 $16,778.90
Methodist Healthcare-Memphis Hospitals $16,778.90 $16,778.90
Erlanger North Hospital $8,301.61 $8,301.61
TriStar Summit Medical Center $4,805.70 $4,805.70
Baptist Memorial Hospital-Memphis $3,679.96 $3,679.96
LeConte Medical Center $2,693.45 $2,693.45
Maury Regional Medical Center $2,385.73 $2,385.73
Tennova Healthcare Physicians Regional M C $1,981.79 $1,981.79
Methodist Medical Center of Oak Ridge $1,753.12 $1,753.12
Saint Thomas West Hospital $1,530.32 $1,530.32
FUNDS DISTRIBUTED TO TRAUMA CENTERS AND NON-TRAUMA CENTERS
FROM TENNESSEE TRAUMA FUND - FY2018 – 3rd QUARTER DISTRIBUTION
Total
Hospital
Readiness Hospital
Level Hospital Name Specific Pool
Costs Distribution
Payment
Payment
TOTAL $799,768.26 $857,250.00 $1,657,018.26
Lev I Regional One Health $307,064.98 $97,250.00 $404,314.98
Lev I Vanderbilt University Hospital $214,403.62 $153,250.00 $367,653.62
Lev I Erlanger Medical Center - Baroness $67,920.22 $153,250.00 $221,170.22
Lev I The University of Tennessee Med. Cntr. $83,142.02 $102,250.00 $185,392.02
Lev I Johnson City Medical Center $32,170.22 $72,500.00 $104,670.22
Lev I Wellmont Holston Valley Medical Ctr. $26,632.36 $72,500.00 $99,132.36
Lev II TriStar Skyline Medical Center $44,575.92 $37,750.00 $82,325.92
PED LeBonheur Children Medical Center $4,941.01 $64,250.00 $69,191.01
PED East Tennessee Childrens Hospital $51,000.00 $51,000.00
Lev II Wellmont Bristol Regional Med. Ctr. $10,116.95 $37,750.00 $47,866.95
Lev III TriStar Horizon Medical Center $2,143.49 $15,500.00 $17,643.49
TriStar Summit Medical Center $5,652.56 $5,652.56
Methodist Medical Center of Oak Ridge $1,004.91 $1,004.91
20FUNDS DISTRIBUTED TO TRAUMA CENTERS AND NON-TRAUMA CENTERS
FROM TENNESSEE TRAUMA FUND - FY2018 – 4th QUARTER DISTRIBUTION
Total
Hospital
Readiness Hospital
Level Hospital Name Specific Pool
Costs Distribution
Payment
Payment
TOTAL $1,023,649.90 $888,250.00 $1,911,899.90
Lev I Vanderbilt University Hospital $328,222.12 $153,250.00 $477,316.85
Lev I Regional One Health $349,028.60 $97,250.00 $440,327.49
Lev I The University of Tennessee Med. Cntr. $108,950.93 $102,250.00 $209,589.58
Lev I Erlanger Medical Center - Baroness $25,805.68 $153,250.00 $177,739.34
Lev II TriStar Skyline Medical Center $77,770.31 $37,750.00 $114,656.40
Lev I Wellmont Holston Valley Medical Ctr. $23,353.69 $72,500.00 $95,337.53
Lev I Johnson City Medical Center $19,432.07 $72,500.00 $91,308.59
PED LeBonheur Children Medical Center $6,423.25 $64,250.00 $70,577.49
PED East Tennessee Childrens Hospital $51,000.00 $51,000.00
Lev II Wellmont Bristol Regional Med. Ctr. $8,458.12 $37,750.00 $46,012.04
Lev III TriStar Summit Medical Center $3,292.76 $15,500.00 $34,183.21
Lev III TriStar Horizon Medical Center $2,663.67 $15,500.00 $18,122.12
Lev III TriStar Stonecrest Medical Center $1,102.78 $15,500.00 $16,602.78
Methodist Healthcare-Memphis Hospitals $16,602.78 $16,602.78
Jackson-Madison Cnty. General Hospital $6,648.14 $6,648.14
Methodist Hospital-North $6,417.43 $6,417.43
Baptist Memorial Hospital-Memphis $5,970.10 $5,970.10
Saint Thomas West Hospital $4,658.43 $4,658.43
Tennova Healthcare Physicians Regional M C $4,084.05 $4,084.05
Maury Regional Medical Center $3,893.97 $3,893.97
Methodist Medical Center of Oak Ridge $3,474.40 $3,454.92
TriStar Southern Hills Medical Center $3,072.93 $3,072.93
Cookeville Regional Medical Center $2,285.01 $2,285.01
CHI Memorial Hospital Chattanooga $2,213.72 $2,213.72
Henry County Medical Center $2,086.61 $2,086.61
LeConte Medical Center $1,643.93 $1,643.93
Parkwest Medical Center $1,461.24 $1,461.24
Erlanger North Hospital $1,426.38 $1,426.38
Morristown-Hamblen Healthcare System $1,389.60 $1,389.60
Williamson Medical Center $608.55 $608.55
Blount Memorial Hospital $608.37 $608.37
Parkridge Medical Center $528.52 $528.52
Saint Francis Hospital-Bartlett $49.30 $49.30
Indian Path Medical Center $22.47 $22.47
21Appendix IV:
Research Publications
1. Katsuura Y, Lorenz E, Gardner W 2nd. Anatomic parameters of the sacral lamina for
osteosynthesis in transverse sacral fractures. Surg Radiol Anat. 2018 May;40(5):521-8. doi:
10.1007/s00276-017-1955-3. Epub 2017
2. Moses RA, Selph JP, Voelzke BB, Piotrowski J, Eswara JR, Erickson BA, Gupta S, Dmochowski RR,
Johnsen NV, Shridharani A, et al; from the Trauma and Urologic Reconstruction Network of
Surgeons (TURNS). An American Association for the Surgery of Trauma (AAST) prospective multi-
center research protocol: outcomes of urethral realignment versus suprapubic cystostomy after
pelvic fracture urethral injury. Transl Androl Urol. 2018 Aug;7(4):512-520. doi:
10.21037/tau.2017.11.07. PMID: 30211041
3. Burlew CC, Sumislawski JJ, Behnfield CD, McNutt MK, McCarthy J, Sharpe JP, Croce MA, Bala M,
Kashuk J, Spalding MC, Beery PR, John S, Hunt DJ, et al. Time to stroke: A WTA multicenter study
of blunt cerebrovascular injuries. J Trauma Acute Care Surg. 2018 Nov;85(5):858-866.
Doi:10.1097/TA0000000000001989. PMID: 29847537.
4. Katsuura Y, Chang E, Sabri SA, Gardner WE, Doty JF. Anatomic parameters for instrumentation of
the sacrum and pelvis: a systematic review of the literature. J Am Acad Orthop Surg Glob Res
Rev. 2018 Aug 2;2(8):e034.doi: 10.5435/JAAOSGlobal-D-18-0003. PMID: 30631829. PMCID:
PMC6286901.
5. Day KM, Phillips PM, Sargent LA. Correction of a posttraumatic orbital deformity using three-
dimensional modeling, virtual surgical planning with computer-assisted design, and three-
dimensional printing of custom implants. Craniomaxillofac Trauma Reconstr. 2018 Mar;11(1):78-
82. doi: 10.1055/s-0037-1601432. Epub 2017 Apr 3.
6. Walsh BA, Gregorie WD, Whittle JS. Deconstructing dissections: A case report and review of
blunt cerebrovascular injury of the neck. Case Rep Emerg Med. 2018 Aug 8;2018:6120781. doi:
10.1155/2018/6120781.
7. Prehospital Plasma during Air Medical Transport in Trauma Patients at Risk for Hemorrhagic
Shock. Jason L. Sperry, M.D., M.P.H., Francis X. Guyette, M.D., M.P.H., Joshua B. Brown, M.D.,
Mark H. Yazer, M.D., Darrell J. Triulzi, M.D., Barbara J. Early-Young, B.S.N., Peter W. Adams, B.S.,
Brian J. Daley, M.D., et al., for the PAMPer Study Group. N Engl J Med 2018; 379:315-326
DOI: 10.1056/NEJMoa1802345
8. Burke SJ, Batdorf HM, Burk DH, Martin TM, Mendoza T, Stadler K, Alami W, Karlstad MD, Robson
MJ, Blakely RD, Mynatt RL, Collier JJ. Pancreatic deletion of the interleukin-1 receptor disrupts
whole body glucose homeostasis and promotes islet Beta-cell de-differentiation. Molecular
Metabolism. 2018 Jun 6. [Epub ahead of print]
9. Burke SJ, Batdorf HM, Martin TM, Burk DH, Noland RC, Cooley CR, Karlstad MD, Johnson WD,
Collier JJ. Liquid sucrose consumption promotes obesity and impairs glucose tolerance without
altering circulating insulin levels. Obesity (Silver Spring, Md.). 2018 Jun 14. [Epub ahead of print]
10. Grabeel KL, Russomanno J, Oelschlegel S, Tester E, Heidel RE. Computerized versus hand-scored
health literacy tools: a comparison of simple measure of gobbledygook (SMOG) and Flesch-
22Kincaid in preinted patient education materials. J Med Libr Assoc. 2018 Jan; 106(1):38-45. PMID:
29339932
11. Univers J, Long C, Tonks SA, Freeman MB. Systemic hypersensitivity reaction to endovascular
stainless steel stent. J Vasc Surg. 2018 Feb; 67(2):615-617. PMID: 29248243
12. Gibson, B. H., Sharpe, J. P., Lewis, R. H., Newell, J. S., Swanson, J. M., Wood, G. C., … Magnotti, L.
J. (n.d.). Use of Aerosolized Antibiotics in Gram-Negative Ventilator-Associated Pneumonia in
Trauma Patients. AMERICAN SURGEON, 84(12), 1906–1912. Retrieved from
http://search.ebscohost.com/login.aspx?direct=true&db=edswsc&AN=000458434300036&site=
eds-live
13. Sharpe, J. P., Fabian, T. C., Croce, M. A., & Magnotti, L. J. (2018). Re: Chemoprophylaxis for VTE
prevention in spine surgery patients. The Journal Of Trauma And Acute Care Surgery, 85(6),
1133–1134. https://doi.org/10.1097/TA.0000000000002110
14. Trust, M. D., Veith, J., Brown, C. V. R., Sharpe, J. P., Musonza, T., Holcomb, J., … AAST
Contemporary Management. (n.d.). Traumatic rectal injuries: Is the combination of computed
tomography and rigid proctoscopy sufficient? JOURNAL OF TRAUMA AND ACUTE CARE
SURGERY, 85(6), 1033–1037. https://doi.org/10.1097/TA.0000000000002070
15. Evans, C. R., Sharpe, J. P., Swanson, J. M., Wood, G. C., Fabian, T. C., Croce, M. A., & Magnotti, L.
J. (n.d.). Keeping it Simple: Impact of a Restrictive Antibiotic Policy for Ventilator-Associated
Pneumonia in Trauma Patients on Incidence and Sensitivities of Causative Pathogens. SURGICAL
INFECTIONS. https://doi.org/10.1089/sur.2018.087
16. Schroeppel, T. J., Clement, L. P., Barnard, D. L., Guererro, W., Ferguson, M. D., Sharpe, J. P., …
Fabian, T. C. (2018). Propofol Infusion Syndrome: Efficacy of a Prospective Screening Protocol.
The American Surgeon, 84(8), 1333–1338. Retrieved from
http://search.ebscohost.com/login.aspx?direct=true&db=cmedm&AN=30185312&site=eds-live
17. Manley, N. R., Magnotti, L. J., Fabian, T. C., Cutshall, M. B., Croce, M. A., & Sharpe, J. P. (n.d.).
Factors Contributing to Morbidity after Combined Arterial and Venous Lower Extremity Trauma.
AMERICAN SURGEON, 84(7), 1217–1222. Retrieved from
http://search.ebscohost.com/login.aspx?direct=true&db=edswsc&AN=000440420400042&site=
eds-live
18. Filiberto, D. M., Sharpe, J. P., Croce, M. A., Fabian, T. C., & Magnotti, L. J. (2018). Traumatic
atlanto-occipital dissociation: No longer a death sentence. Surgery, 164(3), 500–503.
https://doi.org/10.1016/j.surg.2018.05.011
19. Stewart MK, Gondek, S, Green R, Adams RC, Nunez, T. Creation and Efficacy of a Cadaver-Based
Prosection Anatomical Course for Critical Care Advanced Practice Providers. J Surg Educ 2018
May-Jun;75(3): 798-803.
20. Smith SE, Hamblin, SE, Guillamondegui, OD, Gunter OL, Dennis BM. Effectiveness and safety of
continuous neuromuscular blockade in trauma patients with an open abdomen: A follow-up
study. AM J Surg 2018 Sep; 216 (3):414-419.
21. Stonko DP, Dennis BM, Betzold RD, Peetz AB, Gunter OL, Guillamondegui OD. Effectiveness and
safety of continuous neuromuscular blockade in trauma patients with an open abdomen: A
follow-up study. J Trauma Acute Care Surg 2018 Aug;85(2): 393-397.
2322. Stonko DP, O Neill DC, Dennis BM, Smith M, Gray J, Guillamondegui OD. Trauma Quality
Improvement: Reducing Triage Errors by Automating the Level Assignment Process. J Surg Educ
2018 April 12. pii: S1931-7204(17)30735-3.
23. Semler MW, Self WH, Wanderer JP, Ehrenfeld JM, Wang L, Byrne DW, Stollings JL, Kumar AB,
Hughes CG, Hernandez A, Guillamondegui OD, et al. Balanced Crystalloids versus Saline in
Critically Ill Adults. N Engl J Med. 2018 Mar 1;378(9):829-839.
24. Sperry JL, Guyette FX, Brown JB, Yazer MH, Triulzi DJ, Early-Young BJ, Adams PW, Daley BJ, Miller
RS, Harbrecht BG, et al. Prehospital Plasma during Air Medical Transport in Trauma Patients at
Risk for Hemorrhagic Shock. N Engl J Med. 2018 Jul 26;379(4):315-326.
25. Maxwell CA, Dietrich MS, Miller RS. The FRAIL Questionnaire: A Useful Tool for Bedside
Screening of Geriatric Trauma Patients. J Trauma Nurs. 2018 Jul/Aug;25(4):242-247.
26. Kim HJ, Tsao JW, Stanfill AG.” The current state of biomarkers of mild traumatic brain injury.” JCI
Insight. 2018 Jan11; 3 (1). PMID: 29321373
27. Smith PJ, Hollins AM, Sawyer JR, Spence DD, Outlaw S, Kelly DM. “ Characterization of American
Football Injuries in Children and Adolescents.” J Pediatr Orthop. 2018 Feb; 38 (2):57-60. PMID:
29189531
28. Notrica DM, Sayrs LW, Bhatia A, Letton RW, Alder A, St Peter S, Ponsky TA, Eubanks JW
3rd,Lawson KA, Ostlie DJ, Tuggle DW, Garcia NM, Maxson RT, Leys C, Greenwell C. “The Incidence
of delayed splenic bleeding in pediatric blunt trauma.” J Pediatr Surg. 2018 Feb; 53 (2):339-343.
PMID: 2907931
29. Baughman BC, Tsao JW. “Abandoning a sport you love after concussion: Calling it quits.” Neurol
Clin Pract. 2018 Feb; 8 (1): 6-7. PMID: 29517057
30. Gosain A. “What’s New in Critical Illness and Injury Science? Case reports: The first step on a
path toward cure.” Int J Crit Illn Inj Sci. 2018 Apr-Jun; 8(2): 55-56. PMID: 29963406
31. Kutsikovich JI, Hopkins CM, Gannon EW 3rd, Beaty JH, Warner WC Jr, Sawyer JR, Spence DD,
Kelly DM.” Factors that predict instability in pediatric diaphyseal both-bone forearm fractures” J
Pediatr Orthop B. 2018 Jul; 27 (4):304-308. PMID: 2877716
32. McGaha P 2nd, Motghare P, Sarwar Z, Garcia NM, Lawson KA, Bhatia A, Langlais CS, Linnaus ME,
Todd Maxson R, Eubanks JW 3rd, Alder AC, Tuggle D, Ponsky TA, Leys CW, Ostlie DJ, St Peter SD,
Notrica DM, Letton RW. “ Negative Fast Exam Predicts Successful Non-operative Management in
Pediatric Solid Organ Injury: A Prospective ATOMAC Study.” J Trauma Acute Care
Surg. 2018 Sep 21. [Epub ahead of print] PMID: 30247443
33. Keller PR, Cole HA, Stutz CM, Schoenecker JG. “Posttraumatic Proximal Radioulnar Synostosis
after Closed Reduction for a Radial Neck and Olecranon Fracture”. Case Rep Orthop. 2018 Feb
19; 2018: 5131639. PMID: 29805828
34. Lavin LR, Penrod CH, Estrada CM, Arnold DH, Saville BR, Xu M, Lowen DE. “Fractures in the
pediatric emergency department: are we considering abuse?”. Clinical pediatrics. 2018 Sep;
57(10): 1161-1167. PMID: 29451007
35. Schlegel C, Greeno A, Chen H, Raees MA, Collins KF, Chung DH, Lovvorn HN. “Evolution of a level
I pediatric trauma center: Changes in injury mechanisms and improved outcomes”. Surgery 2018
May; 163(5): 1173-1177. PMID: 29373171
2436. Martus JE, Hilmes MA, Grice JV, Stutz CM, Schoenecker JG, Lovejoy SA, Mencio GA. “Radiation
Exposure During Operative Fixation of Pediatric Supracondylar Humerus Fractures: Is Lead
Shielding Necessary?”. Journal of Pediatric Orthopaedics. 2018 May; 38(5): 249-53. PMID:
27280894
37. Starnes JR, Unni P, Fathy CA, Harms KA, Payne SR, Chung DH. “Characterization of pediatric golf
cart injuries to guide injury prevention efforts”. The American Journal of Emergency Medicine
2018 June; 36(6): 1049-1052. PMID: 29530356
38. Hale AT, Pekala K, Theobald B, Kelly K, Wolf M, Wellons JC, Le T, Shannon CN. “Predictors of
post-discharge seizures in children with traumatic brain injury”. Child's Nervous System. 2018
Jul; 34(7): 1361-5. PMID: 29564537
39. Arbra CA, Vogel AM, Plumblee L, Zhang J, Mauldin PD, Dassinger MS, Russell RT, Blakely ML,
Streck CJ. “External validation of a five-variable clinical prediction rule for identifying children at
very low risk for intra-abdominal injury after blunt abdominal trauma”. Journal of Trauma and
Acute Care Surgery. 2018 Jul; 85(1): 71-7. PMID: 29659473
40. Greenberg JK, Jeffe DB, Carpenter CR, Yan Y, Pineda JA, Lumba-Brown A, Keller MS, Berger D,
Bollo RJ, Ravindra VM, Naftel RP. “North American survey on the post-neuroimaging
management of children with mild head injuries”. Journal of Neurosurgery: Pediatrics. 2018
Oct;1-9. PMID: 30485194
41. Posey SL, Cole HA, Halverson S, Stutz C, Schoenecker JG. “Intra-articular Monteggia Fracture: A
Case Study of Using the Center of Rotational Angulation to Improve a Functional Outcome”. J
Orthop Case Rep. 2018 Nov-Dec; 8(6): 27-30. PMID: 30915288
42. Hale AT, Stonko DP, Brown A, Lim J, Voce DJ, Gannon SR, Le TM, Shannon CN. “Machine-learning
analysis outperforms conventional statistical models and CT classification systems in predicting
6-month outcomes in pediatric patients sustaining traumatic brain injury”. Neurosurg Focus.
2018 Nov; 45(5): E2. PMID: 30453455
25You can also read