Trending New cases/day in Lewes District ( Pop 102744) 7 day rolling average plotted from Govt. Coronavirus dashboard - People aged 20 69 ...
←
→
Page content transcription
If your browser does not render page correctly, please read the page content below
Trending
                 New cases/day in Lewes District ( Pop 102744)
       7 day rolling average plotted from Govt. Coronavirus dashboard

 People aged 20 – 69 predicted to have Covid 19 symptoms in Lewes District by
                 the Kings College/ZOE Covid symptom study

Posted 31 October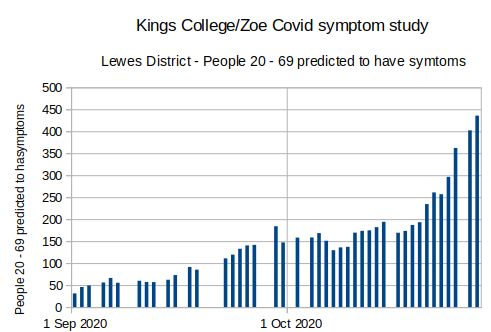
The Covid alert Level here on 30 October was:

           MEDIUM                        (TIER 1)
Confirm with the postcode checker at www.gov.uk/find-coronavirus-local-
restrictions. Restrictions that apply at Tier 1, medium alert level are at
ww.gov.uk/guidance/local-covid-alert-level-medium#meeting-family-and-
friends

       PREVALENCE OF THE
        VIRUS - NUMBERS
People with Covid vulnerabilities who wish to consider which of the
permitted actions are right for them or who want to do the best they
can to protect others may find it helpful to have an idea of the
prevalence of the virus both in the local area and in the kind of places
they want to visit.

Many indicators of prevalence are now being published. All have
strengths and weaknesses in terms of what is being measured,
statistical validity, target area or population, interpretation of test
results and lag between collection and publication. For more
information please contact me tom.crossett@gmail.com . But
meanwhile here are some numbers with an indication of how they
have changed in the past week:
Source What they report: Number, change Date of sampling Comment
since previous post
Office of Estimate of Estimate for SE
National confirmed cases in England valid
Statistics SE England pro 514 ~20 Oct statistically.
rata to Lewes
District
(pop 102,744)
Kings Estimate of People Depends on self
College / aged 20 – 69 in 30 Oct reporting, less
ZOE Covid Lewes District 431 robust statistically
Symptom with Covid than ONS.
Study symptoms
Govt. 7 day rolling Sampling strategy
Corona virus average of new 14.1 23 Oct ill defined,
dashboard cases/ day in probable big
Lewes District underestimate
Map linked Total cases in Units of ~ 7200
to Govt. previous 7 days 12 25 Oct residents.
Corona virus Central and East
dashboard. Lewes
“ West Lewes 6 25 Oct “
“ Coldean & 95 25 Oct Near Universities
Moulescoomb –Time for caution?
Time for action?
I have been posting Covid numbers without comment since June. I
thought that it was important to leave readers to draw their own
conclusions. However some recent data worries me.
The number of symptomatic cases in Lewes District predicted by the
Covid symptom study been rising since the beginning of September. It
just about doubled doubled in the last eight days. If this
multiplication factor is maintained or increases the Covid situation
will deteriorate very quickly.
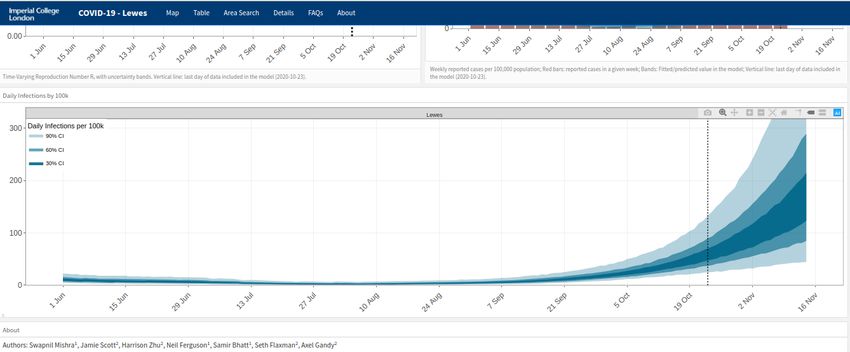
Figures from the Government Coronavirus dashboard also paint a
disturbing picture. Professor Ferguson’s team at Imperial College
manage a website that projects the Government figures forwards
https://imperialcollegelondon.github.io/covid19local/ The
outlook for Lewes district and many other districts presently subject
to medium alert restrictions is grim.
The chart below shows the IC team’s projection for new cases per
day/100,000 people (Population Lewes district ~ 103,000)New Covid infections in Lewes District/100,000 people.
Chart data indicates that if the IC team’s assumptions are correct the
median infection rate in Lewes District would increase from 69 per
day per 100,000 on October 26th to 188 per day November 14th . And
that’s only for starters!
The Covid doubling time from the symptom study and the infection
rate estimated by IC are of course PROJECTIONS - what will
probably happen if nothing changes.
Its up to us to change our behavior to make sure that these projections
do not become reality. If we think about it I am sure that we can each
ways of reducing the risk of catching and passing on the virus unique
to our own circumstances that will add to what we contribute by
complying with official restrictions as they develop. That way we can
both contain the virus and improve communal well being and
prosperity
Tom Crossett
Posted 28 October 2020
Next data post : Friday
2020You can also read