Hydrologic Vulnerability Assessment - Issued: Friday, March 1, 2019 - National Weather Service
←
→
Page content transcription
If your browser does not render page correctly, please read the page content below
Hydrologic Vulnerability Assessment

                 Issued:   Friday, March 1, 2019

Weather Ready Nation                          NWSSERFC   @NWSSERFC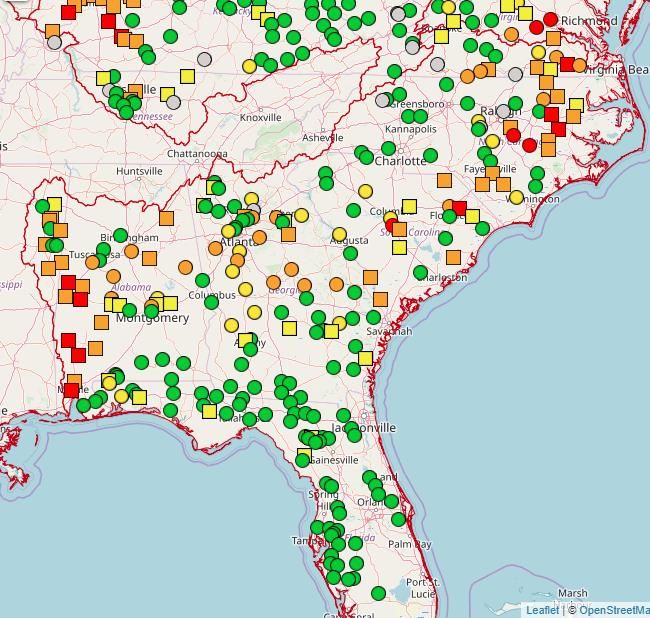
•       A moist southeast U.S. with a stationary front draped across
         it will produce scattered showers and mostly light to
         moderate rain into Sunday.

 •       Sunday into Monday morning will bring the heaviest rainfall
         totals for this event…possibly producing flooding at new
         points and sending some points that are in flood higher

 •       Rain will likely end by Monday morning leading to a colder
         and drier week next week.

3/1/2019 12:05 PM                                   NWSSERFC   @NWSSERFC
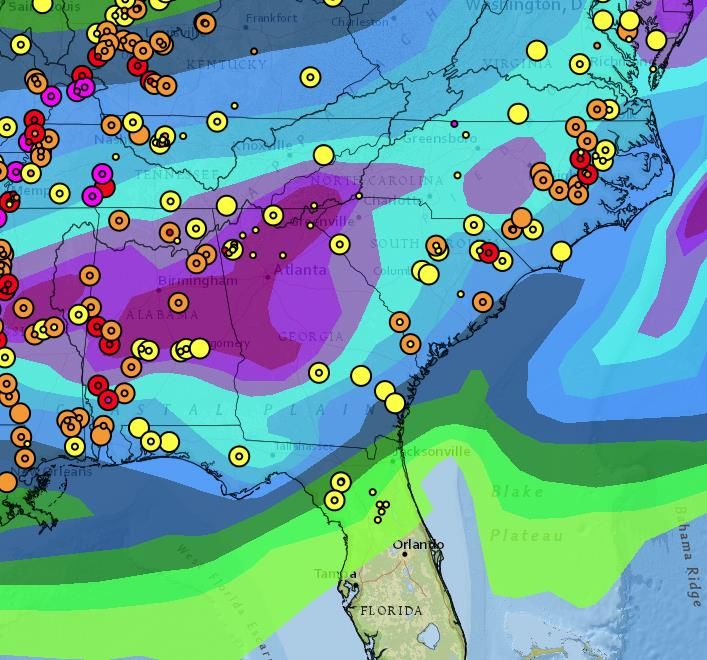
14-day departure from normal rainfall
graphic. A very distinct line where the
heavy rain has fallen recently. The areas in
yellow can likely receive one to two inches
of rain and not have additional flooding in
those areas. In the areas shaded in blues
and purples, that amount of rainfall could
force rivers above flood stage.

          NWSSERFC          @NWSSERFC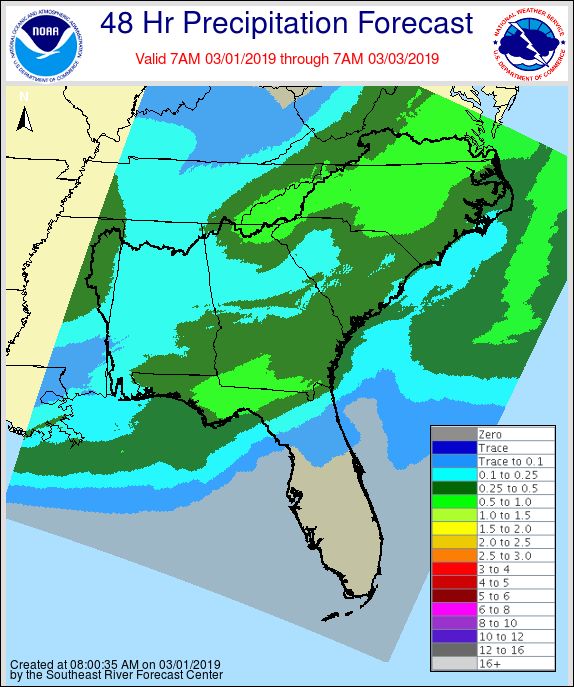
28-day streamflows indicate above normal
conditions over much of the southeast U.S.
A large spread of conditions exist across
the southeast U.S. Areas in northern
Mississippi, northern Alabama, the west
half Carolinas and western half of Virginia
are indicating above normal streamflow
and are most vulnerable to new rain. The
rest of the area has benefitted from drier
conditions in the past month.

          NWSSERFC          @NWSSERFC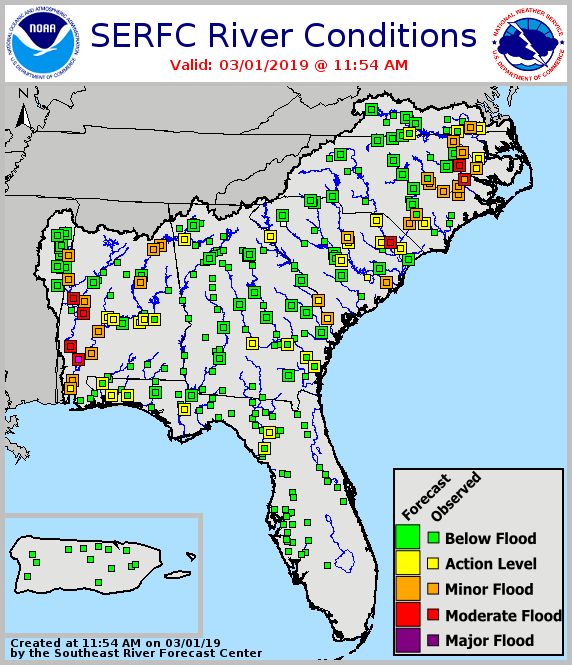
The 48-hour rainfall forecast takes us into
early Sunday morning. Rainfall forecast
will remain below an inch over all of the
Southeast. Isolated totals could be higher
in places. Day 3 rainfall will be higher and
could produce more flooding. Day 3
rainfall is added to this in a later graphic to
depict the total weekend rainfall forecast.

      NWSSERFC            @NWSSERFC
A number of forecast points remain in
action or flood stage from past rainfall.
Forecasted flooding, indicated by the
outside shading on the squares, shows
numerous points expected to go to flood.
Please visit the SERFC home page or your
local weather offices page for more details
about forecasts.
https://www.weather.gov/serfc/
NWSSERFC @NWSSERFCRainfall associated with a stationary front
situated across the southeast U.S. will be
the focus of rainfall this coming weekend.
The early part of the period should just see
light to moderate rainfall. Day 3 from
Sunday Morning through Monday morning
will have a cold front pushing through the
area with some heavy rain associated with
it.
This graphic shows the 3-day forecasted
rainfall total and the points currently in
flood or near flood.
This 3-day rainfall is taken into account in
our Meteorological Model Ensemble
Forecast System (MMEFS) on the next slide.
NWSSERFC @NWSSERFCForecasts from MMEFS are shown here.
This information is based on GEFS model
runs.
This output is automatically generated and
includes minimal interaction from SERFC
forecasters. In addition, numerous points
are already in flood and the rain in the
coming weekend will have nominal effect
on some of those forecasts.
This slide is only a snapshot of this output
giving a broad indication of where we are
and/or might see flooding.
The next slide shows some output that is
available to you if you check out the
website. To see this same output for a
point near you, here is the link to more
detailed information:
https://www.weather.gov/erh/mmefs
NWSSERFC @NWSSERFCHere is one example of output produced by MMEFS. In the first graphic on the left, you have 3 traces and a likely scenario. The
top trace indicates the 5% chance of exceeding that level. The lowest trace shows the 5% chance of falling below that level. The
black line in the orange shading indicates the median level…there’s a 50% chance of being higher or lower than that line. The
orange shading shows a most likely simulation (40% chance) of the river rising within that range.
The middle graphic show the precipitation traces that are inputs to our model to produce the numbers you see on the left and
right graphic. The GFS model output (in this case rainfall) is shown here. Each trace shows a model simulation (21 total) that
have been produced with the orange shading still indicating most likely possibility.
And the right graphic that shows what each of those rainfall traces produces as a streamflow at the river.
https://www.weather.gov/erh/mmefs
NWSSERFC @NWSSERFC• At this time, SERFC remains on normal operations. Normal office hours are
6 am – 10 pm…7 days a week. Please contact us if you have any questions
or concerns.
• The Decision Support Briefing will continue until further notice.
Please send all operational correspondence to
sr-alr.rivers@noaa.gov or call the office directly.
Weather Ready Nation NWSSERFC @NWSSERFCLatest Radar SERFC Quick Brief
Latest Forecast MMEFS – Ensemble River Forecasts
Rainfall
Weather Ready Nation NWSSERFC @NWSSERFC• This product has set the stage for the upcoming event. This will likely be the only briefing for this event
unless things change.
• These slides are intended for your use. Please feel free to share these with others. If you have any
questions please email sr-alr.rivers@noaa.gov or contact your local NWS Weather Forecast Office.
• Remember: SERFC briefings cover freshwater flooding. For information on coastal and tidal flooding,
flash floods, winds, and severe weather risks, please contact your local Weather Forecast Office.
Weather Ready Nation NWSSERFC @NWSSERFCYou can also read