Trends in the Abuse of Prescription Drugs
←
→
Page content transcription
If your browser does not render page correctly, please read the page content below
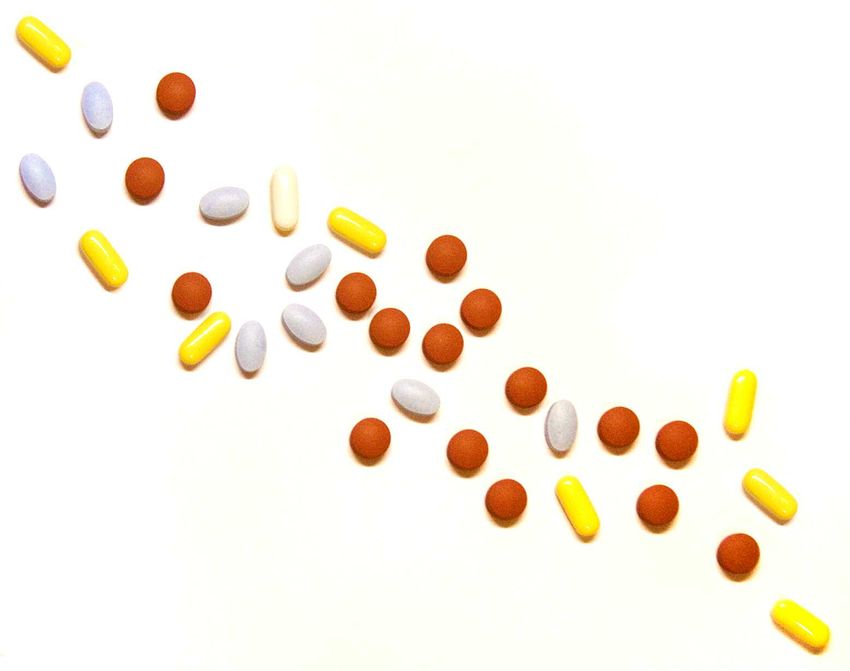
Trends in the Abuse of
                      Prescription Drugs
                                                 by Jane Carlisle Maxwell, Ph.D.

The sale of narcotic analgesic pills is
increasing, as is diversion and the
non-medical use of prescription
drugs. These drugs are easy to obtain
and they are viewed as “safer” than
street drugs. Young adults have the
highest rates of lifetime use of these
drugs and fewer teenagers in 2005
thought that there was great risk in
using these drugs, as compared to             The Center for Excellence in Drug Epidemiology
2004. Emergency department visits
                                          The Gulf Coast Addiction Technology Transfer Center
involving non-medical use of pharma-
ceuticals usually involve multiple                           The University of Texas at Austin
drugs as well as alcohol. And individ-
uals who enter substance abuse treat-
ment with problems with narcotic
analgesics or benzodiazepines differ
from heroin users in their characteris-
tics and their drug use patterns.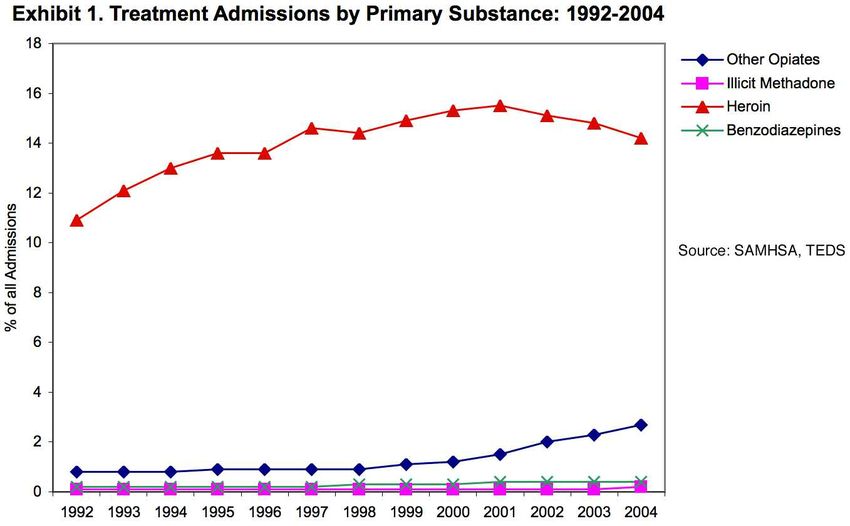
A growing problem is the non-medical use of prescription drugs such as pain
killers or narcotic analgesics, benzodiazepines, and muscle relaxants. Non-med-
ical use is defined as use of prescription-type drugs that were not prescribed for
the individual by a physician or the drugs were used only for the experience or
feeling they caused. Prescription psychotherapeutic drugs include pain relievers,
tranquilizers, stimulants, and sedatives. Pain-relievers of concern include
hydrocodone (Vicodin®, Lortab®, Lorcet®), oxycodone (OxyContin®, Percocet®,
Percodan®, or Tylox®), and methadone, as well as a number of other drugs.
Benzodiazepines of concern include clonazepam (Klonopin®), alprazolam
(Xanax®, Ativan®, or lorazepam), and diazepam (Valium®). Muscle relaxants
which are abused include carisoprodol (Soma®) and cyclobenzaprine (Flexeril®).

Extent of the Prescription
Drug Abuse Problem

Community Epidemiology Work Group
The Community Epidemiology Work Group (CEWG) is sponsored by the
National Institute on Drug Abuse (NIDA). It is a group of 21 researchers from
across the nation who meet twice a year to report on drug abuse patterns and
trends and emerging problems in their local areas. Members use quantitative sta-
tistics and qualitative techniques such as focus groups and key informant inter-
views to monitor drug trends. The full reports of the CEWG can be accessed at
http://www.nida.nih.gov/about/organization/cewg/Reports.html.

The following describes the variations in the growing prescription drug abuse
problem across the nation as summarized in the abstracts and presentations of
CEWG members at their June, 2006 CEWG meeting.

ATLANTA: Prescription benzodiazepines are second only to cocaine in the num-
ber of substance-related deaths across Georgia. Excluding alcohol, narcotic
analgesics accounted for nearly one-half of drug-related deaths in 2005. Multiple
indicators show that hydrocodone is the most commonly abused narcotic analgesic
in Atlanta, followed by oxycodone.

BALTIMORE: Tranquilizers were also used by 11% of persons admitted to treat-
ment with a primary problem with opiates.

BOSTON: Mixed opiate indicators suggest that historically high levels of oxy-
codone abuse may be stabilizing after years of growth. Benzodiazepine misuse
and abuse levels remain fairly stable at relatively high levels as reported in death,
emergency department, and help-line data.

                            2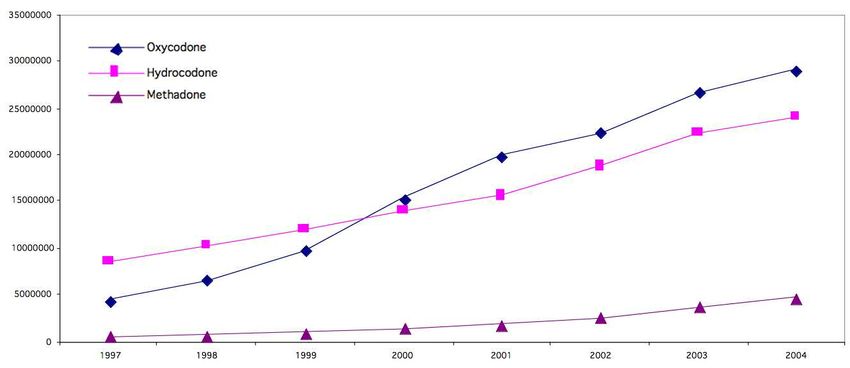
CHICAGO: The top three benzodiazepines in Chicago are alprazolam, diazepam,
and clonazepam, while the top three opiates are hydrocodone, methadone, and
codeine.

DENVER: More than half of treatment providers in Colorado recently reported
an increase in the abuse of opioid prescription drugs, especially of OxyContin®.

DETROIT: There is concern about other opiates due to increases in prescriptions,
emergency department reports, and deaths. Oxycodone is not showing a large
presence in emergency department reports but it is still a problem in law enforce-
ment reports. Hydrocodone is viewed as “legal” by users and is seen as a problem
by law enforcement. Codeine and methadone are also problems.

HAWAII: Opiate use (oxycodone and hydrocodone) is increasing with higher
numbers of deaths and treatment admissions.

LOS ANGELES: Among prescription and over-the-counter medication-related
exposure calls, opiates/analgesics were the most frequently mentioned, followed by
Coricidin HBP® and benzodiazepines. Hydrocodone is more abused than oxycodone.

MINNEAPOLIS: Reports continue of adolescent abuse of prescription medica-
tions and over-the-counter products containing dextromethorphan.

NEW YORK CITY: The most salient feature of the present drug scene is the
general tendency of drug users, regardless of primary drug, to mix and combine
multiple drugs for simultaneous use. Many kinds of prescription drugs continue to
be available on the street and they seem to be growing in popularity based on
indicator data and street observations. The top five pain drugs are Xanax®,
Elavil®, Klonopin®, Percocet®, and Catapres®. Most users buy their drugs from
street sellers, as patients seem less willing to sell their pain medications than their
other non-pain medications. Pain drugs are bought for personal use; 90% of the
users buy to get high and very few buy to reduce withdrawal or for relief of pain.

NEWARK: A variety of pharmaceuticals were mentioned in drug-related deaths
reported by the Essex County Medical Examiner and the 66 mentions of pharma-
ceuticals surpass alcohol mentions and equal half of cocaine mentions.

PHILADELPHIA: The two most frequently abused benzodiazepines continue to
be alprazolam and diazepam, although others are abused or misused.

PHOENIX and ARIZONA: Prescription and over-the-counter medications are
second only to marijuana in reported use, according to survey data.

SAN DIEGO: The number of treatment admissions for all drugs of abuse has
been steadily declining since 2002 with the exception of non-heroin opiates, for
which admissions increased 26.1%. (Overall decline in treatment admissions is
partially due to decreased funding for treatment). Hydrocodone leads oxycodone
in emergency department reports and toxicology laboratory reports.

                                                        3
SAN FRANCISCO: Hydrocodone and oxycodone emergency department
reports increased significantly between 2004 and 2005.
SEATTLE: Benzodiazepines and muscle relaxant indicators are fairly low, with
continued slight increases; use of these substances appears to be mostly secondary
to other drugs.
SOUTH FLORIDA: Prescription opiate use is escalating and alprazolam is “out
of control.” The abuse of these medications has caused the greatest number of
drug-induced and drug-related deaths locally and across Florida. Oxycodone is the
prescription opiate most frequently mentioned by treatment clients. For benzodi-
azepines and, particularly alprazolam, consequences are higher in Broward and
Palm Beach Counties than in the rest of Florida. Carisoprodol is called “Ds”,
“Dance”, “Las Vegas Cocktail” (with Vicodin®), and “Soma Coma” (with
codeine).
ST. LOUIS: Treatment admissions for abuse of other opiates increased 61.5% in
one year. Some of the most popular drugs are benzodiazepines and over-the-count-
er drugs such as cough medicine.
TEXAS: Abuse of alprazolam and carisoprodol is increasing. Of the 87 deaths
with a mention of carisoprodol in 2004, only 3 just involved that drug;
hydrocodone and alprazolam were substances that were most often mentioned
along with carisoprodol in the other 84 deaths. Hydrocodone is a larger problem
than oxycodone but oxycodone abuse is growing. Codeine cough syrup is com-
monly abused and Coricidin HBP®, which is known as “Triple C’s” or “Skittles,”
is popular, especially among youth.
WASHINGTON, DC: Students report that mixing Xanax® with cola drinks will
make them feel very drunk and that others are taking Vicodin® before they start
drinking to get drunker faster.
4National Survey on Drug Use and Health
The National Survey on Drug Use and Health (NSDUH) is conducted by the
Office of Applied Studies of the Substance Abuse and Mental Health Services
Administration. It collects information on the prevalence, patterns, and conse-
quences of alcohol, tobacco, and illegal drug use and abuse in the general U.S.
civilian non-institutionalized population, ages 12 and older. The survey reports
can be found at http://www.oas.samhsa.gov/nsduh.htm.
In 2002, the NSDUH reported that an estimated 29.6 million Americans had used
pain relievers non-medically in their lifetimes; by 2005, the number had increased
to 32.7 million. Table 1 shows the increases in the percentage of persons report-
ing use of these drugs. Non-medical use of prescription pain relievers was second
only to marijuana use in terms of past-year use: 11.3 million were non-medical
users of pain relievers as compared with 25.5 million past-year users of marijuana,
according to combined data from the 2002 through 2004 surveys. Of special con-
cern is that persons between the ages of 18 and 25 reported higher lifetime non-
medical use of pain relievers, benzodiazepines, and muscle relaxants than did
other age groups. Between 2004 and 2005, there was a significant increase in the
number of persons in this group who used hydrocodone, oxycodone, methadone,
clonazepam, or alprazolam.
Males had higher rates of misuse of pain relievers, but among youths aged 12 to
17, the rates of non-medical use of any prescription psychotherapeutic drug were
higher for females (9.9% versus 8.2%). Past-year use of any psychotherapeutic
drug was higher in the West than in the rest of the country but misuse of tranquil-
izers were higher in the South.(1)
Table 1. National Survey on Drug Use and Health,
Lifetime Non-Medical Use of Selected Prescription Drugs,
Percentages, 2002-2005
2002 2003 2004 2005
Vicodin,Lortab, Lorcet 5.6 ** 6.6 6.9 7.2
OxyContin 0.8 ** 1.2 1.3 1.4
Methadone 0.4 0.5 0.5 0.7
Xanax, Alprazolam, Ativan, or Lorazepam 3.5 ** 4.0 3.9 4.2
Clonazepam 1.0 * 1.2 1.1 1.0
Diazepam 6.1 6.2 6.1 6.1
Soma 1.0 1.1 1.1 1.0
*Difference between 2002 and 2003 estimate, p< 0.05
**Difference between 2002 and 2003 estimate, pinitiates for marijuana (2.1 million) or cocaine (872,000). Youths aged 12 to 17
and young adults aged 18 to 25 were the most likely to initiate non-medical use of
prescription psychotherapeutic drugs. In 2005, there were 526,000 new non-
medical users of OxyContin®. Sixty percent of those new users of pain pills
reported that they got the drugs from a friend or relative for free the last time they
used them. Another 17% got the drug from one doctor, 4% reported buying from
a drug dealer or stranger, and 1% bought the drug on the Internet.(2)
Monitoring the Future Survey
The Monitoring the Future Survey (MTF), conducted by the University of
Michigan’s Institute for Social Research, is funded by NIDA. It tracks illicit drug
use and attitudes towards drugs by eighth, tenth, and twelfth graders as well as
college students and young adults. The MTF reports can be accessed at
http://monitoringthefuture.org.
Table 2. Trends in Annual Prevalence of Use of Various Drugs,
Monitoring the Future: 2002–2005
2002 2003 2004 2005
Vicodin
8th Grade 2.5 2.8 2.5 2.6
10th Grade 6.9 7.2 6.2 5.9
12th Grade 9.6 10.5 9.3 9.3
College Students 6.9 7.5 7.4 9.6
Young Adults 8.2 8.6 8.9 9.3
OxyContin
8th Grade 1.3 1.7 1.7 1.8
10th Grade 3.0 3.6 3.5 3.2
12th Grade 4.0 4.5 5.0 5.5
College Students 1.5 2.2 2.5 2.1
Young Adults 1.9 2.6 3.1 3.1
Tranquilizers
8th Grade 2.6 2.7 2.5 2.8
10th Grade 6.3 5.3 5.1 4.8
12th Grade 7.7 6.7 7.3 6.8
College Students 6.7 6.9 6.7 6.4
Young Adults 7.0 6.8 7.4 6.7
The 2005 MTF reported that Vicodin and OxyContin are the two drugs that
account for the increase in the use of prescription pain pills. Although lower rates
were found for OxyContin® than Vicodin® across all age groups, the use of
OxyContin® by 12th graders and young adults had increased significantly since
2002 (Table 2). Most of the reported tranquilizer use in recent years has involved
Valium® and Xanax®.(3)
6Partnership Attitude Tracking Survey
The Partnership Attitude Tracking Survey (PATS): Teens in Grades 7
through 12, 2005. This survey by the Partnership for a Drug-Free America
involved 7,218 adolescents who took the self-administered survey in the spring of
2005. The report is available at http://www.drugfree.org/Files/Full_Teen_Report
The 2005 PATS survey reported that 37% of teenagers had ever used marijuana,
20% had ever used inhalants, 19% had ever used prescription medicine not pre-
scribed for them, and 10% each had ever used cough medicine or cocaine/crack.
Between 2004 and 2005, the proportion of teens who thought there was great risk
in trying prescription pain relievers that were not prescribed for them dropped
from 48% to 44%. Table 3 shows that the primary reasons for abusing prescrip-
tion pain relievers is their widespread availability and easy access.
Table 3. Reason for Using Prescription Pain Relievers:
PATS Attitude Tracking Study: 2005
Easy to get from parents' medicine cabinets . . . . . . . . . . . . . . . . . . . 62%
Are available everywhere . . . . . . . . . . . . . . . . . . . . . . . . . . . . . . . . . 52%
They are not illegal drugs . . . . . . . . . . . . . . . . . . . . . . . . . . . . . . . . . 51%
Easy to get through other people's prescriptions . . . . . . . . . . . . . . . . 50%
Teens can claim to have a prescription if caught . . . . . . . . . . . . . . . . . 9%
They are cheap . . . . . . . . . . . . . . . . . . . . . . . . . . . . . . . . . . . . . . . . . 43%
Safer to use than illegal drugs . . . . . . . . . . . . . . . . . . . . . . . . . . . . . . 35%
Less shame attached to using . . . . . . . . . . . . . . . . . . . . . . . . . . . . . . 33%
Easy to purchase over the Internet . . . . . . . . . . . . . . . . . . . . . . . . . . 32%
Fewer side effects than street drugs . . . . . . . . . . . . . . . . . . . . . . . . . 32%
Can be used as study aids . . . . . . . . . . . . . . . . . . . . . . . . . . . . . . . . . 25%
Parents don't care as much if you get caught . . . . . . . . . . . . . . . . . . 21%
7Drug Abuse Warning Network
The Drug Abuse Warning Network (DAWN ED) collects data on drug-related
visits to a sample of the Nation’s emergency departments (EDs). Visits can include
drug abuse and misuse, adverse reactions, accidental ingestion, overmedication,
malicious poisoning, suicide attempts, underage drinking, and patients seeking
detoxification or drug abuse treatment. DAWN is conducted by the Substance
Abuse and Mental Health Services Administration. The reports are at
https://dawninfo.samhsa.gov/pubs/shortreports/default.asp
In 2004, DAWN reported that there were nearly 1.3 million emergency depart-
ment visits associated with drug misuse or abuse, and nearly half a million
involved non-medical use of pharmaceuticals (Table 4). These visits typically
involved multiple drugs. Only 33% of the opiates/opioids, 23% of the benzo-
diazepines, and 16% of the muscle relaxants involved a single drug. Alcohol was
also involved in 20% of all opiate/opioid visits, 29% of benzodiazepine visits, and
24% of muscle relaxant visits. Patients aged 21 to 54 had the highest rates of
emergency department visits for these drugs.(4)
Table 4. 2004 DAWN ED Visits Involving Non-medical Use
of Selected Pharmaceuticals
Number %
Opiates/opioids 158,281 31.9
Hydroodone/combinations 42,491
Oxyodone/combinations 36,559
Methadone 31,874
Benzodiazepines 144,385 29.1
Alprazolam 49,842
Clonazepam 26,238
Muscle relaxants 28,338 5.7
Carisoprodol 17,366
Cyclobenzaprine 5,932
All ED visits involving nonmedical use 495,732 100
of pharmaceuticals
8Treatment Episode Data Set
Treatment Episode Data Set (TEDS). TEDS is an admission-based data collec-
tion system of the Substance Abuse and Mental Health Services Administration
(SAMHSA) that includes admissions to facilities that are licensed or certified by
the State substance abuse agency to provide substance abuse treatment. The
reports are at http://www.oas.samhsa.gov/dasis.htm#teds2
From 1994 to 2004, the number of persons who were admitted to treatment pro-
grams across the US with a primary problem with opiates other than heroin
increased from 14,1971 (0.8% of all admissions in 1994) to 60,017 (3.2% of all
admissions in 2004) (Exhibit 1). In comparison, the number of persons with a
primary problem with heroin increased from 216,452 (13.0%) in 1994 to 265,895
(14.2%) in 2004. The number of clients admitted with a primary problem with
illicit methadone has remained low, at 1,414 (0.1%) in 1994 and 3,226 (0.2%) in
2004. Admissions for benzodiazepines have increased from 3,257 (0.2%) in 1994
to 7,827 (0.4%) of all admissions in 2004.(5)
As Table 5 shows, in comparison to individuals entering treatment with a problem
with heroin, individuals with problems with prescription drugs were less likely to
be male or persons of color. Although there was little difference in average age at
admission, prescription drug abusers were more likely to have begun their opiate
use at an older age and to be first admissions to treatment. They were also less
likely to use daily and they were more likely to be referred by other health care
9Table 5. Characteristics of U.S. Clients Entering Treatment as Reported on TEDS: 2004
Other*
Heroin Methadone Opiates* Benzodiazepines
% Male . . . . . . . . . . . . . . . . . . . . . . . . . . . . . . . 68 56 53 47
% White . . . . . . . . . . . . . . . . . . . . . . . . . . . . . . 50 80 89 86
% Black . . . . . . . . . . . . . . . . . . . . . . . . . . . . . . . 24 10 4 5
% Hispanic . . . . . . . . . . . . . . . . . . . . . . . . . . . . . 23 8 3 7
Average Age . . . . . . . . . . . . . . . . . . . . . . . . . . . . 36 35 34 36
% Began Use at Age 30+ . . . . . . . . . . . . . . . . . . 14 32 25 29
% Used Daily . . . . . . . . . . . . . . . . . . . . . . . . . . . 78 14 19 18
% Used Orally . . . . . . . . . . . . . . . . . . . . . . . . . . 2 81 73 94
% Injected . . . . . . . . . . . . . . . . . . . . . . . . . . . . . 63 7 12 1
% Inhaled . . . . . . . . . . . . . . . . . . . . . . . . . . . . . 32 4 13 3
% First Admissions . . . . . . . . . . . . . . . . . . . . . . . 22 37 40 43
% Receiving Opioid Treatment** . . . . . . . . . . . . 31 28 18 2
% Referred by CJ System . . . . . . . . . . . . . . . . . . 15 15 16 18
% Self Referred . . . . . . . . . . . . . . . . . . . . . . . . . 58 50 50 41
% Referred by Health Care Provider . . . . . . . . . 5 11 10 14
% Employed . . . . . . . . . . . . . . . . . . . . . . . . . . . . 17 26 29 21
% GED or Year 12 Completed . . . . . . . . . . . . . . 17 24 31 28
*Includes codeine, hydrocodone, hydromorphone, meperidine, morphine, opium, oxycodone, pentazocine,
propoxyphene, tramadol, and other drugs with morphine-like effects. Non-prescritpion methadone excluded.
**Received methadone or buprenorphine
TEDS data run 9/25/2006.
professionals (who may have recognized the abuse or dependence problems of
these individuals).
DAWN Medical Examiner Reports
The DAWN Medical Examiner Reports (DAWN ME) include deaths directly
caused by drug use, misuse, or abuse, as well as deaths where the drug use, misuse,
or abuse contributed to the death but did not cause it. The numbers are representative
only of the locales for which they are reported and cannot be extrapolated nation-
wide. The DAWN ME reports are available at
https://dawninfo.samhsa.gov/pubs/shortreports/default.asp
In 2003, six states participated in the DAWN mortality component. The rates of
opiate deaths per 100,000 ranged from 7.2 in New Hampshire, 7.8 in Maine, 8.7
in Vermont, 10.8 in Maryland, 11.5 in Utah, to 11.6 in New Mexico. These deaths
involved prescription pain medications as well as heroin (whose metabolite
cannot be distinguished from the metabolites of other opiates). In each state,
between 66% and 93% of these deaths involved more than one drug. Males out-
numbered females in opiate-related deaths and the highest rates involved those
under ages 21-54.(6)
10National Center for Health Statistics
Data from the National Center for Health Statistics (NCHS) showed that opioid
analgesics such as hydrocdone, oxycodone, and methadone were more likely than
cocaine or heroin to be the cause of unintentional drug poisoning deaths in the US
between 1999 and 2002. Opioid analgesic deaths increased by 91% in that time
period, while cocaine deaths increased 23% and heroin deaths increased 12%.(7)
Between 1999 and 2003, the number of methadone-related unintentional poison-
ing deaths increased 213%, and this increase tracked the increase in methadone
used as an analgesic rather than methadone used in narcotic treatment programs.(8)
National Forensic Laboratory Information System
The National Forensic Laboratory Information System (NFLIS), sponsored by
the Drug Enforcement Administration (DEA), is a program that systematically
collects results from toxicological analyses conducted by state and local forensic
laboratories on substances seized in law enforcement operations. As of June
2006, 42 state forensic laboratory systems and 89 local or municipal forensic
laboratories, representing a total of 259 individual labs, were participating in
NFLIS The NFLIS reports are at http://www.deadiversion.usdoj.gov/nflis.
Between 2001 and 2005, narcotic analgesics and benzodiazepines represented
nearly 5% of all drugs analyzed (Table 6). In comparison, in 2005, 33% of all
exhibits were cannabis and 32% were cocaine. Alprazolam, hydrocodone, and
oxycodone were the most commonly reported controlled prescription drugs,
accounting for nearly 63% of all narcotic analgesics and benzodiazepines reported.
Among narcotic analgesics, hydocodone increased nearly 125% between 2001
and 2005. Oxycodone increased from 2001 to 2004 but leveled off between 2004
and 2005, while methadone nearly tripled between 2001 and 2005. Alprazolam
increased over 75% between 2001 and 2005 and clonazepam nearly doubled,
while diazepam decreased about 20%.(9)
Table 6. Percent of Total Identified Drugs That Were Narcotic Analgesics,
Benzodiazepines, or Muscle Relaxants, NFLIS: 2000-2005
2000 2001 2002 2003 2004 2005
% Hydrocodone/
combinations 0.64 0.78 0.98 1.19 1.40 1.56
% Oxycodone/
combinations 0.43 0.70 0.85 0.95 1.20 1.16
% Methadone 0.00 0.00 0.23 0.31 0.39 0.40
% Aprazolam 0.66 0.90 1.11 1.19 1.40 1.56
% Clonazepam 0.22 0.26 0.32 0.33 0.39 0.41
% Carisoprodol 0.00 0.00 0.15 0.19 0.17 0.19
11Automation of Reports and
Consolidated Orders System
DEA’s Automation of Reports and Consolidated Orders System (ARCOS)
reports sales of prescription drugs. Since 2000, sales of oxycodone have
surpassed hydrocodone. Methadone sales have increased at a much slower rate
(Exhibit 2).
Exhibit 2. ARCOS Retail Drug Distribution by Drug Code for the U.S.: 1997-2004
The increase in methadone sales reflects increased use of methadone pills for
analgesia.
There are three formulations of methadone: liquid, diskettes, and pills. Since 2000,
distribution of methadone tablets has increased by 237%, while distribution of
diskettes has increased by 98% and liquid methadone has increased by 18%. Some
97% of the liquid methadone is purchased by narcotic treatment programs and
89% of the 5 and 10 mg. pills which are used for analgesia are purchased by
pharmacies. Fifty percent of the 40 mg. diskettes are purchased by pharmacies and
46% are purchased by narcotic treatment programs.
12Conclusions
The growing abuse of prescription drugs and the patterns of their use are
documented in multiple data sources reviewed in this publication:
The sale of narcotic analgesic pills is increasing, as is diversion and the non-med-
ical use of prescription drugs (ARCOS, NFLIS, and NCHS). The sales of
hydrocodone and oxycodone increased at faster rates than did methadone, with the
largest increases in methadone sales being pills and diskettes which are distributed
through pharmacies for analgesia, rather than the liquid form used in narcotic
treatment programs (ARCOS).
Vicodin and OxyContin are the two drugs that are most likely to account for the
increase in the use of prescription pain pills (MTF, CEWG) and abuse of alprazolam
and carisoprodol is also increasing (CEWG, NFLIS).
.
Individuals ages 19-25 have the highest rates of lifetime use of these drugs and the
rates are increasing (NSDUH). The use of OxyContin® by 12th graders and young
adults had increased significantly since 2002 (MTF). At the same time, fewer
teenagers in 2005 thought that there was great risk in using these drugs, as
compared to 2004 (PATS).
Prescription drugs are easy to obtain, especially from family or friends, and they
are viewed as “legal,” less shameful to use, and safer than illegal drugs which are
more likely to be purchased from street dealers (PATS, CEWG).
Abuse of prescription drugs is often in combination with other prescription drugs
and alcohol, usually “to get high” (CEWG, DAWN ED) and adverse events such
as emergency department visits and deaths where there has been non-medical
use of opiates, opioids, benzodiazepines, and muscle relaxants usually involve
multiple drugs and alcohol (DAWN ED, DAWN ME).
Admissions to treatment for use of other opiates are increasing, and these users of
narcotic analgesics not only differ from heroin users in terms of socio-demographic
characteristics, but they began their use at a later age, are more likely to be first
admissions to treatment, and to not use on a daily basis. They also are more likely
to come to substance abuse treatment because of a referral from another health
care provider
13(1) Colliver, J. D., Kroutil, L. A., Dai, L., & Gfroerer, J. C. (2006). Misuse of prescription drugs:
Data from the 2002, 2003, and 2004 National Surveys on Drug Use and Health (DHHS
Publication No. SMA 06-4192, Analytic Series A-28). Rockville, MD: Substance Abuse and
Mental Health Services Administration, Office of Applied Studies.
(2) Substance Abuse and Mental Health Services Administration (2006). Results from the 2005
National Survey on Drug Use and Health: National Findings (Office of Applied Studies, NSDUH
Series H-30, DHHS Publication No. SMA 06-4194). Rockville, MD.
(3) Johnston, L. D., O’Malley, P. M., Bachman, J. G., & Schulenberg, J. E. (2006). Monitoring the
Future national survey results on drug use, 1975-2005. Volume I: Secondary school students (NIH
Publication No. 06-5883). Bethesda, MD: National Institute on Drug Abuse; Johnston, L. D.,
O’Malley, P. M., Bachman, J. G., & Schulenberg, J. E. (2006). Monitoring the Future national sur-
vey results on drug use, 1975-2005. Volume II: College students and adults ages 19-45 (NIH
Publication No. 06-5884). Bethesda, MD: National Institute on Drug Abuse.
(4) Substance Abuse and Mental Health Services Administration, Office of Applied Studies (2006).
Emergency department visits involving nonmedical use of selected pharmaceuticals, The New
DAWN Report, Issue 23.
(5) Substance Abuse and Mental Health Services Administration, Office of Applied Studies (2006).
Treatment Episode Data Set (TEDS). Highlights - 2004. National Admissions to Substance Abuse
Treatment Services, DASIS Series: S-31, DHHS Publication No. (SMA) 06-4140, Rockville, MD.
(6) Substance Abuse and Mental Health Services Administration, Office of Applied Studies (2006).
Opiate-related drug misuse deaths in six states: 2003. The New DAWN Report, issue 19.
(7) Paulozzi, L. J., Budnitz, D. S., & Yongli, X. (2006). Increasing deaths from opioid analgesics
in the United States. Pharmacoepidemiology and Drug Safety 15(9): 613-617.
(8) National Center for Health Statistics, National Vital Statistics System. Methadone-related unin-
tentional poisoning deaths 1999-2003 and rates for 1999 and 2003, data run April 24, 2006.
(9) Strom, K.J., Wong, L., Weimer, B.J., Ancheta, J., & Rachal, V. (2006). NFLIS Special Report:
Controlled Prescription Drugs, 2001–2005. Washington DC: U.S. Drug Enforcement
Administration.
© November 2006. The Gulf Coast Addiction Technology Transfer Center (GCATTC)
grants permission to reproduce and distribute any part of this document for non-com-
mercial use. Appropriate credits appreciated. The GCATTC is located in the Center for
Social Work Research at The University of Texas at Austin and serves Texas, Louisiana,
and Mississippi. The purpose of the center is to work through multiple collaborative
networks to bridge research and practice. It also includes the National Center of
Excellence in Drug Epidemiology.
The Gulf Coast Addiction Technology Transfer Center (GCATTC)
The Center for Social Work Research, School of Social Work
The University of Texas at Austin
1717 West 6th Street, Suite 335
Austin, Texas 78703
Web site: www.utattc.net
14You can also read