The Cape Town New Water Programme - WESTERN CAPE PROPERTY DEVELOPMENT FORUM 2018 Peter Flower Director: Water and Sanitation City of Cape Town
←
→
Page content transcription
If your browser does not render page correctly, please read the page content below
The Cape Town New Water Programme
WESTERN CAPE PROPERTY DEVELOPMENT FORUM 2018
                                            Peter Flower
                         Director: Water and Sanitation
                                     City of Cape Town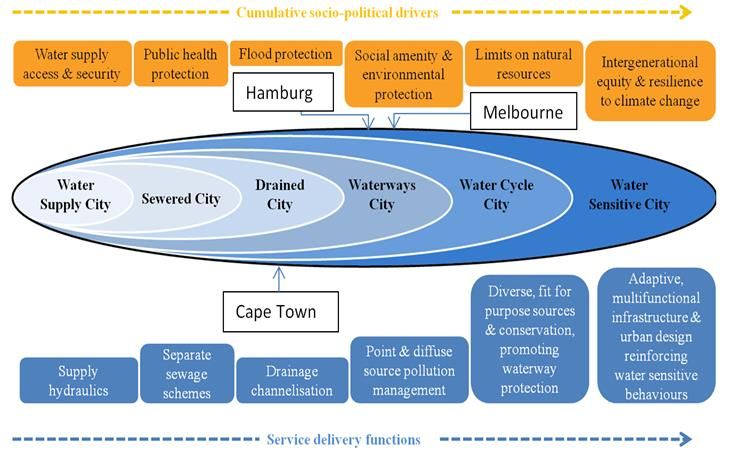
Cape Town’s water is part of an integrated system
                             Cape Town gets its water from a system of dams that supply
                             agriculture and other urban areas. The current system is
                             heavily dependent on rainfall.

                             This complex system is managed by the national Department
                             of Water and Sanitation.

                             About a third of the water in this system is used by agriculture
                             and 7% by other urban areas (smaller towns).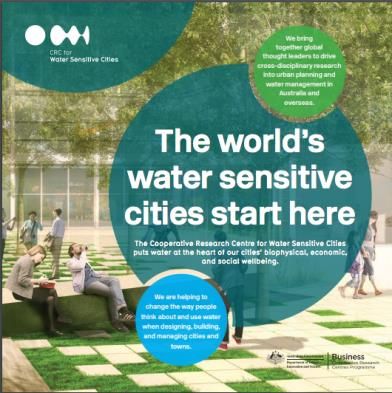
Why is there a shortage of water in Cape Town?
                                      The National Department of Water and Sanitation
       Cape Town is experiencing an   is responsible for planning and implementing
        unprecedented multi-year      water resources schemes to meet water demand
             drought event.           for cities, industries, mining and agriculture.

                                      The Department plans at a 1 in 50 year level of
                                      assurance. This means that during droughts with a
                                      severity of 1:50 years or more, restrictions need to
                                      be imposed to reduce demand.

                                      The current drought is much more severe that a 1
                                      in 50 drought event. The best estimate of the
                                      return interval of the meteorological drought in
                                      the region of WCWSS dams is 311 years, with 90%
                                      confidence that it actually falls between 105 and
                            2015      1280 years1.
                            2016
                                      The next augmentation scheme for Cape Town
                            2017      was planned for 2022/3 and is being accelerated
                                      by the national Department. This scheme
                                      (augmentation of Voёlvlei Dam by pumping from
                                      Berg River) is unlikely to be ready before 2021.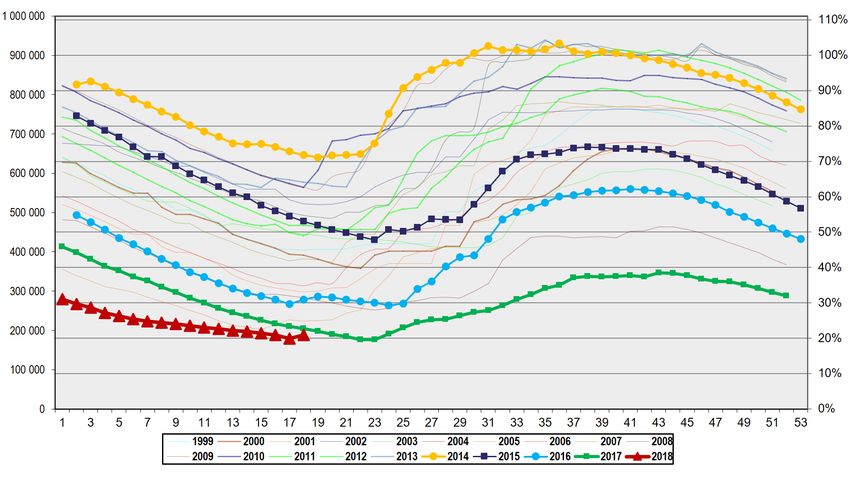
What happened to Day Zero?

           22 January 2018 - Projection of 13.5% dam level = 12 April                       7 May 2018 - Projection of 13.5% dam level beyond July 2018,
           2018, Weekly drawdown = 1.4%, Agriculture : CCT, 48% : 47%                       Weekly drawdown = 0.1%, Agriculture : CCT, 1% : 89%

The level of water in the dams supplying Cape Town will not drop below 13.5% this year if restrictions are adhered to and assuming rainfall similar to last year.
Monitoring dam levels (inflow, evaporation and withdrawals) and managing withdrawals is key to maintaining the integrity of the system and getting through
the drought.

Day Zero calculation is based on conservative assumptions of consumption beyond the City’s control, including releases to agriculture, urban demand,
evaporation and rainfall. The projected Day Zero date is based on the previous weeks’ average volume extracted from the system, extrapolated into the
future to the intersection point of 13.5% dam level without adjusting for potential rainfall, reduction in demand etc. Unlike previous years, DWS stopped releases
to irrigation boards once allocations were reached late in January onwards thus dramatically reducing drawdown from the system. Furthermore, a sizeable
transfer was made by an adjacent catchment area in February, also reducing the drop in dam level. These two aspects, as well as a reduction in urban
demand led to the Day Zero date moving well beyond the anticipated start of the rainy season in 2018.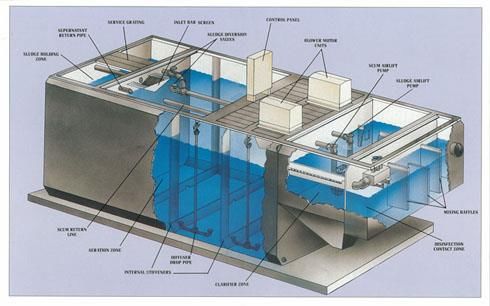
GETTING THROUGH THE DROUGHT

DEMAND MANAGEMENT                   DAM MANAGEMENT                  NEW WATER

•   Restriction Level 6B        •   Dam systems             •   Groundwater
•   Communications              •   Rainfall                •   Re-use
•   System integrity            •   DWS steercom            •   Desalination
•   Pressure reduction          •   Agricultural Releases
•   Household flow regulators   •   Dam levels              Considerations
•   Punitive Tariffs            •   Modeling                • Cost
•   Adaptation                                              • Timing
•   Information driving                                     • Sustainability
    behavior change
Demand management
3000
Daily consumption MLD
2500
2000 983 1028
737 846
1500 254 451 136
1000 1010 1100 1100 1218 1039
55 28 27 27 28
500 979 856 884 917
821 764 794
329 368 361 201
0 284 275 184 125 77 83 94 136
Feb-18
May-18
Nov-17
Dec-17
Jan-18
Jun-18
Apr-18
Jul-18
Oct-18
Mar-18
Aug-18
Sep-18
Evaporation - Maximum Urban (DWS average of last 5 years) Agriculture unrestricted
RESTRICT TO
3000
Daily consumption MLD
2500
2000
1500
295 393 411
1000 102 339 181
605 605 670 22 11 55
500 556 571 538 471 11
452 11
420
11
437 486 504
329 368 361 201
0 284 275 184 125 77 83 94 136
Feb-18
May-18
Jul-18
Jan-18
Apr-18
Oct-18
Nov-17
Dec-17
Jun-18
Mar-18
Aug-18
Sep-18
Evaporation - Maximum 45% restricted Urban Agriculture 60% restricted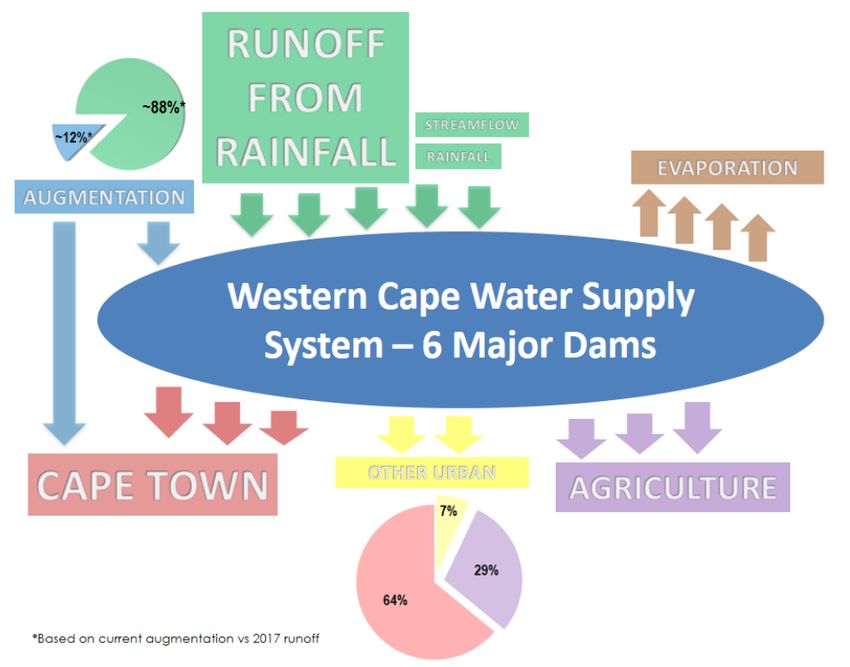
20 year Dam levels                                               97%

    84.1%                                                                2014

                                                                 71%

                                                                 60.3%
    55.4%                                                                2015

    46.5%                                                                2016

                                                                 38.4%

    31.0%

                                                                         2017

                                             Hydrological year
               2018   1.7% lower than 2017

                                             Start 1 Nov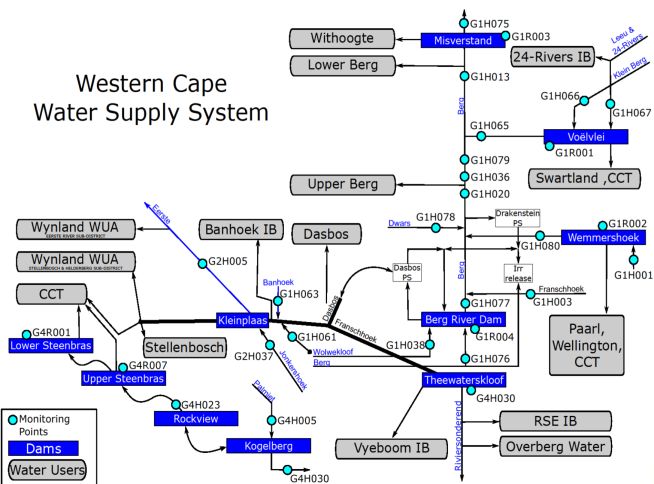

0.0%
                                                                          5.0%
                                                                                         15.0%
                                                                                                 20.0%
                                                                                                         25.0%
                                                                                                                               30.0%
                                                                                                                                       35.0%
                                                                                                                                                    40.0%

                                                                                 10.0%
                                                      J AN - 1 8
                                                                                                                                               Or this!

                                                       FEB-18

                                                      M AR - 1 8

                                                      AP R - 1 8

                                                      M AY - 1 8

                              13.50%
                                                                                                                 We are here

                                                      JUN-18

                                                       JUL-18

                                                      AU G - 1 8

Restricted, No Augmentation
                                                       SEP-18

                                                      OCT-18

                                                      NOV-18

                                                      DEC-18

Restricted, 75% rain
                              Restricted, 100% 2017

                                                      J AN - 1 9

                                                       FEB-19

                                                      M AR - 1 9

                                                      AP R - 1 9

                                                      M AY - 1 9
                              600MLD, 100% 2017

                                                      JUN-19
Restricted, 50% rainfall

                                                       JUL-19

                                                      AU G - 1 9

                                                       SEP-19

                                                      OCT-19

                                                      NOV-19
Population Growth and Water Use Efficiency
700 6.0
Reducing per capita
water consumption
Water Treated per year (million m3) 600
5.0
500
Population (millions)
4.0
400
3.0
300
2.0
200
1.0
100
0 0.0
1950 1960 1970 1980 1990 2000 2010 2020
Water Treated Population Expon. (Population)For Cape Town, this means that demand must now be
managed down to below 450 Ml/day.
While Cape Town has significantly reduced its demand (measured here as production from the treatment works),
from a peak of 1200 Ml/day in 2015 down to about 500 Ml/day, a further reduction in demand is needed to below
450 Ml/day immediately due to not meeting the 500 Ml/day target since July 2017
Demand reduction is saving
400 Ml/day
Mar 2017 = 820 Ml/day
Mar 2018 = 520 Ml/day
Further measures are in place to reduce demand, including:
• punitive drought tariffs
• demand management devices & flow restrictors
• more aggressive pressure management and leak detectionDemand management: Water going into the network
Water into network
(based on litres per person per
Litres per person per day, population
day (based in area)
on population in service service area)
400
350
300
Buffalo City
Nelson Mandela Bay
250
Mangaung
Ekurhuleni Metro
200
City Of Johannesburg
City Of Tshwane
150 eThekwini
Cape Town
100 (All metros)
50
-
2005 2006 2007 2008 2009 2010 2011 2012 2013 2014 2015 2016 2017 2018•
•
•
•
•
(36%)
Staff productivity
First Line Response
Mains Replacement
Reduction of NRW: 24% (41%)
Reduction in water losses:16%
Number of Bursts per Months
100
200
300
500
600
700
800
900
400
0
Jul-06
Oct-06
Jan-07
Apr-07
Jul-07
Oct-07
Jan-08
Apr-08
Jul-08
Oct-08
Jan-09
Apr-09
Jul-09
Oct-09
Jan-10
Apr-10
Jul-10
Oct-10
Jan-11
Apr-11
Jul-11
Oct-11
Jan-12
Apr-12
Jul-12
Oct-12
Jan-13
Apr-13
Jul-13
Oct-13
No. Burst Water Mains
Jan-14
Apr-14
Jul-14
Oct-14
Jan-15
Apr-15
Jul-15
Oct-15
Jan-16
Improved efficiencies through multiple interventions
Apr-16
Jul-16
Oct-16
Burst/ 100km
Jan-17
Apr-17
Jul-17
0
10
20
40
50
60
70
80
30
Bursts / 100km / yearConsumption Reduction Through Advanced Pressure Management
Evolution of augmentation programme
International expert advise:
1.   Assuming it will not rain again is not realistic
2.   Prioritise ground water (Cape Flats Aquifer and Table Mountain Group Aquifer)
3.   Do not pursue temporary desalination and reuse
4.   Plan and execute permanent re-use & desalination at an optimum scale
5.   A turnkey approach for desalination with a water purchase agreement is likely to
     yield the lowest cost per unit of water
6.   Do not delay decisions on permanent reuse and desalination.

                  TIME              •   Reduces uncertainty
                                    •   More information becomes available
                                    •   Better estimates of time & cost
Evolution of augmentation programme (May 2018)
350
Provisional system augmentation programme (MLD)
300
250
200
150
100
50
0
May-18
Feb-19
May-19
Feb-20
Feb-21
Feb-22
Jun-18
Jan-19
Mar-19
Jun-19
Jan-20
Mar-20
May-20
Jun-20
Jan-21
Mar-21
May-21
Jun-21
Jan-22
Mar-22
May-22
Jun-22
Aug-18
Sep-18
Nov-18
Dec-18
Aug-19
Sep-19
Nov-19
Dec-19
Aug-20
Sep-20
Nov-20
Dec-20
Aug-21
Sep-21
Nov-21
Dec-21
Jul-18
Jul-19
Jul-20
Jul-21
Apr-18
Oct-18
Apr-19
Oct-19
Apr-20
Oct-20
Apr-21
Oct-21
Apr-22
Springs & rivers Emergency desalination Permanent desalination
Water transfers Temporary re-use Permanent re-use
Groundwater existing Additional groundwater (conservative) Groundwater over & above (best case)Evolution of augmentation programme (Jan 2018)
600
500
400
Permanent desalination
Emergency desalination
MLD
300 Water Reclamation
Ground Water Abstraction (TMG)
Ground Water Abstraction (sandy)
200
Springs
Temporary transfers
100
0CAPE TOWN – A WATER SENSITIVE CITY
The Water Sensitive / Smart / Wise City? Australia: Water Sensitive City & Water Smart (Brisbane) The International Water Association (IWA): Water Wise City Water Smart : United States
What Makes a City Water Sensitive / Smart / Wise City? Water is integral to almost every feature of an urban landscape. Our city, development hubs and suburbs are complex, ever evolving places, and the way we interact with other people constantly changes too. In a water sensitive city, we interact with the urban water (hydrological) cycle in ways that: provide the water security essential for economic prosperity through efficient use of diverse available resources; enhance and protect the health of waterways and wetlands, the river basins that surround them, and the coast and bays; mitigate flood risk and damage; and create public spaces that collect, clean, and recycle water.
The Water Sensitive City

                           Concept borne out of the Millenium Drought (2000 to 2012) in
                           Australia which ended with flooding, to meet three
                           challenges that critically affect cities and towns in Australia
                           and across the world:

                           •   population growth and changes in lifestyle and values;
                           •   climate change and climatic variability; and
                           •   challenging economic conditions.

                           An Australian Government initiative, the Cooperative
                           Research Centre for Water Sensitive Cities (CRCWSC) was
                           established in July 2012 to help change the way we design,
                           build and manage our cities and towns by valuing the
                           contribution water makes to economic development and
                           growth, our quality of life, and the ecosystems of which cities
                           are a part.
Water Sensitive City (continued)
For CAPE TOWN to become WATER SENSITIVE / SMART / WISE we must adopt and
subscribe to looking at practical and innovative solutions and mechanisms to make
this City more water sensitive, just like over 80 like minded authorities worldwide.
23The Water Sensitive City (continued)
What is a Water Sensitive City:
• In relation to water:
Liveability – the capacity to meet societal water needs of a City for potable, public
health, environmental health, human thermal comfort & urban aesthetics.
Resilience – the capacity to maintain the function of a service under a wide range of
conditions e.g. droughts and floods through recovery and / or adaption.
Sustainability – the carrying capacity of social, ecological and economic
environments and its ability meet water related needs.
Productivity –the capacity to generate direct or indirect economic value from water-
related actions.
24The Water Sensitive City (continued)
The 3 Pillars (Principles) of a Water Sensitive City are:
City is a Catchment – all available water resources (sewage, rainwater, stormwater, groundwater)
within the urban footprint are considered valuable. Infrastructure systems integrate centralised and
decentralised technologies to utilise these resources at different scales in fit-for-purpose applications.
City provides an Ecosystem Service – Water infrastructure and the urban landscape are planned and
designed both functionally and aesthetically, to provide multiple benefits that include stormwater
treatment, flood protection, heat mitigation, ecological health and landscape amenity.
Citizens & Communities are Water-Conscious - people appreciate the many values of water, feel
connected to their water environments engage in water sensitive behaviours. Urban Water cycle
management is practised that leads to water sensitive outcomes.2.3 The Water Sensitive City (continued)
Water Sensitive City: 7 Index Goals & 34 Indicators:Cape Town’s Water Environment
Cape Town is starting to experience the intensification of extreme weather events, droughts
and floods.
o Worst storm event in 30 years from 6 to 8 June 2017.
o Declining annual rainfall over the Western Cape Supply System catchment areas and the
City’s metropolitan area from 2015 to date.
o Extreme flood events e.g. over Somerset West Area, Lourens River catchment in November
2013.
The pressure on the City’s water resources are compounded by the impacts of a variable and
changing climate.
Currently in the third year of an extreme drought (worst in the last century)
Water is the primary casualty of climate change.
Cape Town, both currently and in the future, faces increasing pressure on its current surface
water resources.
There is considerable scope for a proportion of the City’s potable water use to be replaced by
lower quality water e.g. garden irrigation, car washing, toilet flushing, etc.
The World Economic Forum has ranked “water crises” a top 3 risks that can impact on
economic development.Cape Town’s Water Environment (continued) Water is fundamental to our quality of life, economic growth and the environment. It is evident that Cape Town’s demand for water may be approaching its supply capacity. The City’s traditional approach to urban water management of using a parallel series of systems for potable water, sewerage and stormwater drainage is no longer sustainable.
Why does Cape Town need to be a Water Sensitive City?

1. Resources are limited: We need to do more with less.

   With increasing numbers of people living in metropolitan areas, water( energy and materials) needs
   to be used carefully, re-used and renewed.

2. City Densification is both an opportunity for Economic Growth and a Threat to Liveability.

    A more populated, denser City will be required to provide more efficient water services
    (water, wastewater & stormwater). Water services are essential for the well-being of our
    Citizens, their safety and social inclusion, as well as to maintain our environment & biodiversity.

3. An uncertain future underlies the Planning of our City

   Our historic development is not appropriate for the planning of future water systems. Climate
   change and population growth are uncertainties. Planning our future water systems with
   increased modularity and reduced dependencies enable a better reactivity and increased
   resilience to unforeseen trends and events (droughts & floods).
Water Sensitive City / Water Wise City
• Water & Sanitation Department’s vision:
“To be a beacon in Africa through the progressive realisation
of Cape Town as a Water Sensitive City”
• Why?
o Declining rainfall,
o Increased frequency of flood events,
o Pressure on surface water resources compounded by impacts of climate
change, in which water is a primary casualty,
o Water crises are a top 3 risk to economic development - World
Economic Forum,
o Water is fundamental to quality of life and the environment,
o The traditional approach to urban water management with parallel
systems for potable water, sewerage / wastewater, groundwater &
stormwater is no longer sustainable.
Ave. SA water per capita consumption = 375 l/day, World ave. = 175 l/day.
Cape Town = 195 (115) l/Progressing Towards Becoming a Water Sensitive City
Cape Town’s next step: The Water Cycle City = Integrated Urban Water Management
(IUWM).
• In order for the City to increase its water resilience it must focus on the following:
Reduce potable water demand – behavioural measures.
Utilisation of alternative resources: wastewater, groundwater incl. springs, seawater and rainwater /
stormwater.
Increasing “fit for purpose” water utilisation.
Protecting water source quality.
Increase water use efficiency management of:
Potable water supply.
On grid alternative “fit for purpose” water supply.
Off-grid supplies e.g. domestic greywater systems.
Manage water quality and thereby the nature and level of risk to human health from all water resources
/ sources.
Total water cycle planning and management to enhance resilience, sustainability and efficiency.
Integrated water planning and management to transform Cape Town into a Water Sensitive City.Cape Town’s Actions: Increasing Water Resilience
To increase Cape Town’s water resilience our response must be to focus on:
Reducing potable water demand – behavioural measures.
Utilisation of alternative resources: wastewater, groundwater incl. springs, seawater and rainwater / stormwater.
Increasing “fit for purpose” water utilisation.
Protecting water source quality.
Increase water use efficiency management of:
o potable water supply.
o
on grid alternative “fit for purpose” water supply.
o off-grid supplies e.g. domestic greywater systems.
Manage water quality and thereby the nature and level of risk to human health from all water resources / sources.
Total water cycle planning and management to enhance resilience, sustainability and efficiency.
Integrated water planning and management to transform Cape Town into a Water Sensitive / Water Wise City. Benchmarking & Strategy Project
Project is jointly funded and led by Provincial Government of the Western Cape:
Department of Environmental Affairs & Development Planning (DEA &DP).
Water Sensitive City Benchmarking Assessment of the Benchmarking Tool to undertake Water Sensitive
City against the CRC Water Sensitivity 7 Index Goals & 34 Benchmarking for all Towns & Cities in the Western
Indicators, adapted for SA Circumstances. Cape
Implementation Strategy Framework to utilise for Towns
Implementation Strategy for Cape Town towards
& Cities in the Westen Cape to progress towards being
becoming a Water Sensitive City.
Water Sensitive.
Project is being undertaken by the Future Water Institute (UCT) in collaboration
with the Cooperative Research Centre for Water Sensitive
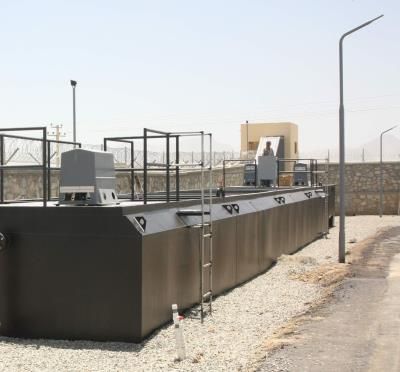
Cities (CRCWSC)PACKAGE WASTEWATER TREATMENT
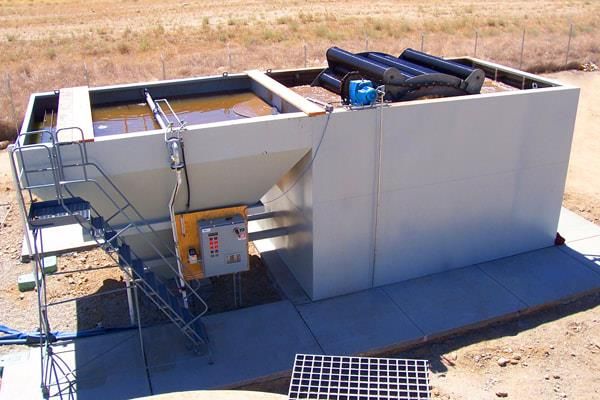
PACKAGE TYPE WASTEWATER TREATMENT PLANTS

 “A package type wastewater treatment plant is a pre-engineered and pre-manufactured, compact
wastewater treatment plant designed for the onsite (decentralized) treatment of domestic wastewater
         generated by a population of up to 5000 population equivalents (approx. 1 Ml/d).”

                                                                                                      35
ADVANTAGES OF PACKAGE WASTEWATER TREATMENT PLANTS
• Pre-engineered and pre-fabricated: Simple and cost effective installation;
• Systems are usually modular and treatment capacity can be expanded relatively easily;
• High level of automation and minimal operator input required;
• Provides wastewater treatment for remote sites and areas that do not have access to centralized (municipal)
wastewater treatment;
• Provides developers the option of designing self sufficient (off-grid) type developments.
36DISADVANTAGES OF PACKAGE WASTEWATER TREATMENT PLANTS
• Onus of obtaining all required licenses (e.g. Water Use License) and ensuring subsequent
compliance is on the treatment plant owner;
• Treatment plant owner is held fully liable for:
– Plant performance;
– Ongoing operational, maintenance and treated effluent analysis cost;
– Sludge treatment and / or disposal cost;
– Potential of onsite spillages and odour generation.
37CITY OF CAPE TOWN WASTEWATER BRANCH:
VIEW ON PACKAGE TYPE WASTEWATER TREATMENT PLANTS
The City of Cape Town Wastewater Branch is currently not actively encouraging the use of packaged wastewater
treatment plants for the following reasons:
– Policing the compliance and upkeep of privately owned package plants does not fall within the City’s
mandate, however any incidents at the respective plants that could endanger public health would
become the City’s mandate;
– Most package plants located in urban areas will require an emergency bypass to the sewer, and therefore
the Wastewater Branch must cater for this flow in the sewer network and at the respective municipal
wastewater treatment plant in any event;
– The City would like to maximise the availability of treated effluent at our wastewater treatment plants for
treated effluent reuse as well as future direct reuse;
38CITY OF CAPE TOWN WASTEWATER BRANCH:
VIEW ON PACKAGE TYPE WASTEWATER TREATMENT PLANTS
Should a developer wish to install a packaged wastewater treatment plant, the Wastewater Branch currently
stipulates the following:
– The City takes no responsibility for the licensing and compliance of a private packaged wastewater
treatment plant;
– Any routine treated effluent analyses that may be required by a license issued to a packaged
treatment plant remains the owners responsibility;
– The City will not approve or recommend any packaged treatment plant technology: The owners of
the plants must satisfy themselves that the technology they procure is capable of meeting
respective license treated effluent discharge limits;
– No treated effluent is to be discharged to the sewer, treated effluent generated on site must be
reused onsite;
– No sludges may be discharged to the sewer, all sludges produced onsite must be handled, treated
and legally disposed of by the treatment plant owner.
39Thank You
You can also read