Trends of inequalities in childhood immunization coverage among children aged 12-23 months in Kenya, Ghana, and Côte d'Ivoire
←
→
Page content transcription
If your browser does not render page correctly, please read the page content below
Donfouet et al. BMC Public Health     (2019) 19:988
https://doi.org/10.1186/s12889-019-7309-9

 RESEARCH ARTICLE                                                                                                                              Open Access

Trends of inequalities in childhood
immunization coverage among children
aged 12-23 months in Kenya, Ghana, and
Côte d’Ivoire
Hermann Pythagore Pierre Donfouet1,2* , Gaye Agesa1 and Martin Kavao Mutua1

  Abstract
  Background: Immunization is one of the most cost-effective health intervention to halt the spread of childhood
  diseases, and improve child health. Yet, there is a substantial disparity in childhood immunization coverage. The
  overall objective of the study is to investigate the trends of within-country inequalities in childhood immunization
  coverage among children aged 12–23 months in Kenya, Ghana, and Côte d’Ivoire. The three countries included in
  this study are countries that are on the verge of entering the accelerated phase of the Gavi, the Vaccine Alliance’s
  co-sharing of costs of vaccine and eventually assuming full costs of vaccines. Côte d’Ivoire is in the Gavi preparatory
  transition phase, entering the accelerated transition phase in 2020, with an expected transition to full self-financing
  in 2025. Ghana is expected to enter the accelerated transition phase in 2021 and to full self-financing in 2026 while
  Kenya will enter in 2022 and fully self-finance in 2027.
  We examine the pattern of inequality in childhood immunization coverage over time through an equity lens by
  mainly exploring the direction of inequality in coverage.
  Methods: We use data from the Demographic Health Surveys and Multiple Indicator Cluster Surveys. The rate
  difference, rate ratio, and relative concentration index are used as measures of inequality.
  Results: Results of the study suggest that in most years inequality in immunization coverage in the three countries
  persist over time, and it favors the most-advantaged households. However, there is a sharp decrease pattern in
  inequalities in childhood immunization coverage in Ghana over time.
  Conclusion: Policymakers could be more strategic in addressing pro-rich inequality in immunization coverage by
  designing health interventions through an equity lens. Using inequality data and putting disadvantaged households
  at the center of health intervention designs could increase the efficiency of the primary health care system and
  reduce the incidence of mortality and morbidity as a result of vaccine-preventable disease.
  Keywords: Childhood immunization coverage, Inequality, Tailoring immunization programmes
  JEL codes: D63, I1, O12

* Correspondence: hdonfouet@aphrc.org
1
 African Population and Health Research Center, APHRC Campus, 2nd Floor,
Manga Close, Off Kirawa Road, P.O. Box: 10787-00100, Nairobi, Kenya
2
 University of Rennes, CNRS, CREM-UMR 6211, F-35000 Rennes, France

                                      © The Author(s). 2019 Open Access This article is distributed under the terms of the Creative Commons Attribution 4.0
                                      International License (http://creativecommons.org/licenses/by/4.0/), which permits unrestricted use, distribution, and
                                      reproduction in any medium, provided you give appropriate credit to the original author(s) and the source, provide a link to
                                      the Creative Commons license, and indicate if changes were made. The Creative Commons Public Domain Dedication waiver
                                      (http://creativecommons.org/publicdomain/zero/1.0/) applies to the data made available in this article, unless otherwise stated.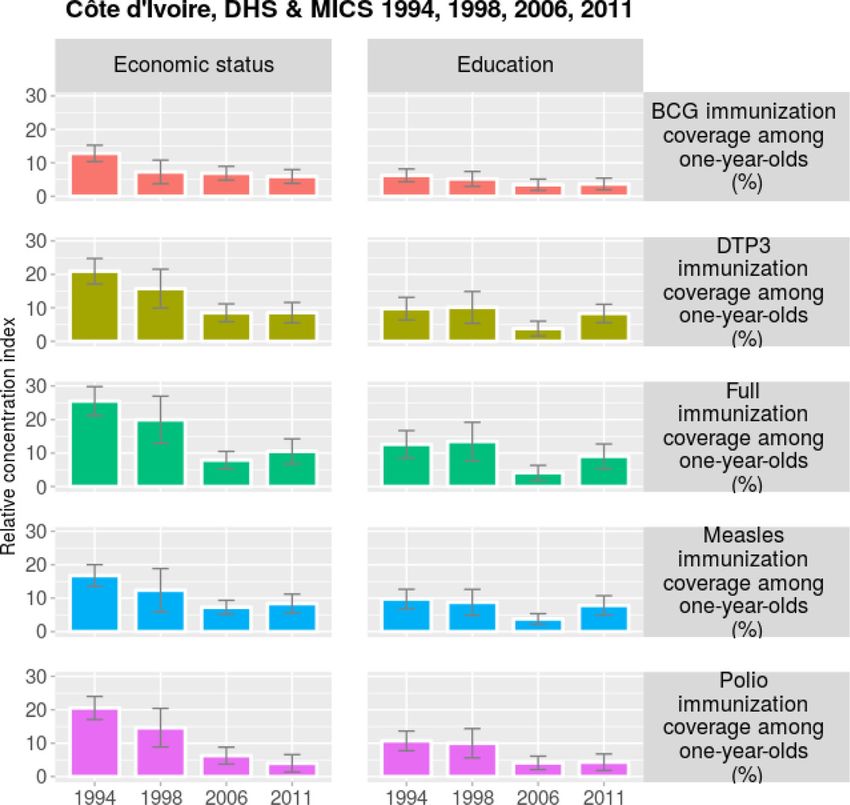
Donfouet et al. BMC Public Health   (2019) 19:988                                                            Page 2 of 10

Background                                                    evidence on inequality in immunization coverage, these
Over the past three decades, vaccines have been useful        CSOs could be an effective lever of influence on govern-
in reducing childhood mortality [1–4]. Each year              ment decisions to increase domestic financing for
immunization averts 2.5 million deaths from vaccine-          immunization and reduce equity in coverage of routine
preventable diseases (VPDs), in children younger than         immunization.
five years [5]. Given these benefits of vaccines, the Ex-       This study uses data from cross-sectional Demo-
panded Program on Immunization (EPI), which is com-           graphic Health Surveys (DHS) for each country between
mitted to universal access to vaccines as a way to reduce     the years 1993 (or 1994) and the latest survey to exam-
incidence of childhood disease, has been implemented in       ine the pattern of inequality in immunization coverage
all sub-Sahara African (SSA) countries. Since its intro-      through an equity lens by mainly exploring the direction
duction in 1978, this program has contributed to a re-        of inequality in immunization coverage over time.
duction of diseases such as measles, polio and seen an        Knowledge of the variation of inequality may inform
increase in the coverage of childhood vaccines [6]. How-      whether child health interventions implemented in dif-
ever, children from low socio-economic backgrounds or         ferent countries are associated with reduced inequality
whose mothers have low level of education are missing         in immunization coverage. Furthermore, the analysis
these vital vaccines [7–12].                                  could help policymakers to develop immunization inter-
   Immunization coverage is an important indicator in         ventions through an equity lens. Another important con-
access and use of routine vaccinations. Although coverage     tribution of the paper is the uncovering of the large
has improved in most SSA countries, the within-country        variation in inequalities across countries. The fluctua-
inequalities still exist. Inequality refers to the observed   tions of inequalities across countries could provide im-
differences in coverage between different population          portant information for comparison. This could also
subgroups. Measuring and monitoring these inequalities        shed more light on why some immunization interven-
could be useful in designing health interventions that put    tions are more or less successful in curbing inequalities
the most-disadvantaged subgroups at the forefront. Fur-       in different contexts.
thermore, Gavi, the Vaccine Alliance has identified the         In the next section, we describe the data source and
need to monitor inequalities and this forms a core part of    measure of inequality in immunization coverage. In sec-
its policy [13, 14].                                          tion 3, results are presented whereas in section 4, the
   To motivate our empirical analysis, the conceptual         findings are discussed with some policy recommenda-
framework of social determinants of health [15] is used       tions. Section 5 concludes.
to explain why inequality in immunization coverage
could favor the most-advantaged subgroups. According          Methods
to the theory of social determinants of health, factors       Data source
such as social-cultural conditions and environmental          Data used in this study were obtained from the DHS
context may influence individuals’ life and consequently,     covering the 1993–2014 period (Kenya and Ghana),
their actions towards disease prevention. Examples of         DHS and Multiple Indicator Cluster Surveys (MICS)
social determinants include income, education which           covering the 1994–2011 period (Côte d’Ivoire) and ana-
could explain these inequalities. Hence, wealthy and          lyzed using the Health Equity Assessment Toolkit
more educated mothers could be more knowledgeable             (HEAT). The periods differ by country due to data
about the benefits of vaccines and more inclined to have      availability.
their children immunized. Individuals’ social position           The HEAT [16] is a software developed by the World
could, therefore, be the main driver of inequality [5].       Health Organization (WHO) used to monitor health in-
   To our knowledge, there are limited studies which in-      equalities on 30 reproductive, maternal, newborn and
vestigate the trends of within-country inequalities in        child health indicators, disaggregated by five dimensions
immunization coverage for children aged 12–23 months          of inequality (economic status, education, place of resi-
in Kenya, Ghana, and Côte d’Ivoire over time. The three       dence, subnational region and child’s sex). It covers most
countries included in this study are countries which are      of the low-and-middle-income countries. The DHS and
in the pipeline of exiting from Gavi’s financial support in   MICS are uploaded in the HEAT. The DHS are nationally
2027 (Kenya), 2026 (Ghana), and 2025 (Côte d’Ivoire).         representative household survey conducted in low-and-
These countries are also part of the Immunization             middle-income countries for the purpose of monitoring
Advocacy Initiative (IAI) project. The IAI project is led     and evaluating population, health and nutrition programs.
by the African Population and Health Research Center          It is a face-to-face survey on women aged 15–49 adminis-
and it aims at building the capacity of civil society orga-   tered by highly trained enumerators. In DHS, specific
nizations (CSOs) in countries which will soon transit         questions were asked to women about children’s health.
from the Gavi support. Armed with technical skills and        Questions related to immunization coverage are of
Donfouet et al. BMC Public Health   (2019) 19:988                                                                              Page 3 of 10

particular interest. The enumerators either record the         Table 1 Immunization coverage indicators among children
dates of different vaccines from the child health book/vac-    aged 12–23 months
cination card or ask questions about whether or not the        Variables              Definitions
child has ever had some vaccines. We focus on routine          BCG coverage           The percentage of children who have received
vaccines among children aged 12–23 months. The DHS             (bcgv)                 one dose of Bacille Calmette-Guérin (BCG)
                                                                                      vaccine in a given year. The numerator is the
are implemented by ICF International and funded by the                                number of children aged 12–23 months receiving
United States Agency for International Development. The                               one dose of BCG vaccine while the denominator
MICS are household surveys that collect information on                                is the total number of children aged 12–23 months
                                                                                      surveyed.
children under the age of five and women aged 15–49 in
several countries. MICS are comparable to DHS and con-         DTP3 coverage          The percentage of children who have received
                                                               (dptv)                 three doses of the combined diphtheria,
tain similar questions related to immunization coverage.                              tetanus toxoid, and pertussis (DTP3) vaccine in a
MICS are managed by the United Nations Children’s                                     given year. The numerator is the number of
Fund.                                                                                 children aged 12–23 months receiving three
                                                                                      doses of DTP3 vaccine while the denominator is
  In the study, we use four immunization coverage indi-                               total number of children aged 12–23 months
cators: Bacille Calmette-Guérin (BCG) coverage, diph-                                 surveyed.
theria, tetanus toxoid and pertussis (DTP) coverage,           Full immunization      The percentage of children who have received
measles coverage, poliomyelitis coverage, and full             coverage (fullv)       one dose of Bacille Calmette-Guérin (BCG)
immunization coverage. BCG coverage is defined as the                                 vaccine, three doses of polio vaccine, three
                                                                                      doses of the combined diphtheria, tetanus
percentage of children aged 12–23 months who have re-                                 toxoid and pertussis (DTP3) vaccine, and one
ceived one dose of BCG vaccine given at birth, in a given                             dose of measles vaccine. The numerator is the
year. DTP coverage is the percentage of children who                                  number of children aged 12–23 months receiving
                                                                                      one dose of BCG vaccine, three doses of polio
have received three doses of the combined DTP vaccine                                 vaccine, three doses of DTP3 vaccine, and one
given at age six, ten, and fourteen weeks respectively, in                            dose of measles vaccine while the denominator
a given year. Measles coverage is defined as the percent-                             is the total number of children aged 12–23 months
                                                                                      surveyed.
age of children aged 12–23 months who have received at
                                                               Measles coverage       The percentage of children who have received
least one dose of measles-containing vaccine given in          (mslv)                 at least one dose of measles-containing vaccine
some countries at the age of nine months, in a given                                  in a given year. The numerator is the number of
year. Poliomyelitis coverage is the percentage of children                            children aged 12–23 months receiving at least
                                                                                      one dose of measles-containing vaccine while the
aged 12–23 months who have received three doses of                                    denominator is total number of children
polio vaccine given at age six, ten, and fourteen weeks                               aged 12–23 months surveyed.
respectively, in a given year. Full immunization coverage      Polio coverage         The percentage of children who have received
is the percentage of children aged 12–23 months who            (poliov)               three doses of polio vaccine in a given year.
have received one dose of BCG vaccine, three doses of the                             The numerator is the number of children aged
                                                                                      12–23 months receiving three doses of polio
polio vaccine, three doses of the combined DTP vaccine,                               vaccine while the denominator is the total
and one dose of measles vaccine. Table 1 presents the def-                            number of children aged 12–23 months
inition of the indicators of immunization coverage.                                   surveyed.
                                                               Notes: Data sources are from DHS, MICS and analyzed using the
                                                               HEAT software
Inequality measures of ordered dimensions
Different statistics are used to measure inequality depend-
ing on whether the inequality dimensions are ordered or
non-ordered [17]. Ordered dimensions such as economic          quintiles, ranging from the poorest quintile to the richest
status and education have an inherent ordering of sub-         quintile. Additionally, we use mother’s education as an-
groups, implying that households in the poorest quintile       other dimension of inequality. Education was an ordinal
(with less education) have less of something compared to       variable taking three categories: no education, primary
those with more wealth (more education). Non-ordered           education level, and secondary or higher.
dimensions, by contrast, have subgroups that have no in-         In assessing the inequality in immunization coverage in-
trinsic ordering of subgroups such as gender, place of resi-   dicators, three inequality measures are used: rate differ-
dence (urban vs. rural), subnational region. In this study,    ence (absolute inequality), rate ratio (relative inequality),
inequalities measures of ordered dimensions are used.          and the relative concentration index. These measures are
The economic status of households was determined using         commonly used in the literature. The rate difference and
a wealth index, which captures the households’ ownership       rate ratio are simple measures of inequality which do not
of assets and access to some services. For each country se-    account for the population share and only looks at the
lected, the wealth index was constructed using principal       extreme categories. Simply stated, the rate difference is
component analysis and households are classified into          the difference of immunization outcomes between the
Donfouet et al. BMC Public Health (2019) 19:988 Page 4 of 10
Table 2 Inequality measures of ordered dimensions
Inequality dimensions Inequality measures Definitions Formula
Economic status Rate difference (d) Difference of immunization outcomes between the most-advantaged d = Ymax − Ymin
Education and most-disadvantaged subgroups.
Rate ratio (r) Immunization outcomes in the most-advantaged divided by the r ¼ YYmax
min
immunization outcomes in the most-disadvantaged subgroups.
P
Relative concentration It is twice the area between the line of equality and the concentration P j ð2X j −1ÞY j
index (rci) curve. rci ¼ ð j
μ Þ100
Notes: Ymax, Ymin are the immunization outcomes of the most-advantaged subgroup, most-disadvantaged subgroup, respectively. Xj, Pj, Yj are the relative rank,
population share, and immunization outcomes of subgroup j, respectively. μ is the national average
most-advantaged (richest quintile, secondary school or and is defined as twice the area between the line of equal-
higher) and most-disadvantaged subgroups (poorest quin- ity and the concentration curve. It provides information
tile, no education), whereas the rate ratio is the on the extent to which immunization coverage is concen-
immunization outcomes in the most-advantaged (richest trated among the disadvantaged or the advantaged house-
quintile, secondary school or higher) divided by the holds. In the HEAT, the relative concentration index is
immunization outcomes in the most-disadvantaged sub- bounded between − 100 and + 100 since it is multiplied by
groups (poorest quintile, no education). A positive value 100. Positive values indicate a concentration of the
of the rate difference indicates that immunization cover- immunization coverage among the advantaged, while nega-
age tends to favor the most-advantaged households. tive values indicate a concentration of the immunization
Similarly, a rate ratio greater than one means that coverage among the disadvantaged. We explore the signifi-
immunization coverage tends to favor the most-advan- cance of the relative concentration index using a t-test at
taged households. The relative concentration index is a the 5% level of significance. We also report the 95%
complex and sophisticated measure of inequality [18]. It confidence intervals in each figure for every country. The
accounts for the population share in different subgroups confidence intervals are estimated via bootstrap methods.
Table 3 Inequality in childhood immunization coverage using economic status as inequality dimension, Kenya
Economic status Years
1993 1998 2003 2008 2014
Indicators Statistics Value SE Value SE Value SE Value SE Value SE
bcgv d 5.77 2.29 5.57 1.96 26.20 3.98 3.74 2.47 5.60 1.39
r 1.06 0.03 1.06 0.02 1.37 0.08 1.04 0.03 1.06 0.02
rci 1.34 0.44 1.35 0.40 6.04 0.93 0.59 0.47 1.20 0.26
dptv d 17.57 3.33 16.44 4.84 15.81 5.49 11.94 4.70 9.19 2.34
r 1.23 0.05 1.24 0.08 1.28 0.11 1.15 0.07 1.11 0.03
rci 3.96 0.74 4.26 1.12 5.55 1.44 2.58 1.00 2.14 0.47
fullv d 21.59 4.26 11.82 6.12 20.37 5.41 7.98 5.68 11.16 3.98
r 1.33 0.08 1.24 0.14 1.53 0.18 1.13 0.10 1.18 0.07
rci 5.53 1.02 4.87 1.81 8.24 2.02 2.25 1.56 3.44 0.94
mslv d 20.13 4.29 24.43 4.49 33.11 4.63 18.32 4.35 16.70 2.11
r 1.29 0.07 1.38 0.09 1.60 0.12 1.24 0.07 1.22 0.03
rci 4.23 0.93 5.70 1.06 9.13 1.34 4.46 0.99 4.07 0.44
poliov d 17.84 3.32 7.93 5.20 11.21 5.44 1.85 5.35 1.51 3.61
r 1.23 0.05 1.12 0.08 1.20 0.11 1.03 0.07 1.02 0.05
rci 4.38 0.75 2.44 1.26 3.89 1.50 −0.04 1.31 0.43 0.76
Notes: bcgv, dptv, fullv, mslv, poliov are BCG immunization coverage, DTP3 immunization coverage, full immunization coverage, measles coverage and polio
coverage among children aged 12–23 months, respectively. d, r and rci are rate difference, rate ratio and relative concentration index, respectively. SE is the
standard errors. Economic status is used as the dimension of inequality. Economic status is determined using the wealth index. The wealth index is constructed
on household assets and access to basic services using the principal component analysis. The wealth index is divided into quintiles. Data sources are from DHS,
and analyzed using the HEAT softwareDonfouet et al. BMC Public Health (2019) 19:988 Page 5 of 10
The survey sampling design was taken into account for es- findings mask inequality in childhood immunization
timating all inequality measures. coverage over time.
Because our data cover several time points, we
examine the pattern of inequality in immunization Analysis of inequality in immunization coverage in Kenya
coverage over time through an equity lens by mainly With regard to Kenya (Table 3), overall results suggest that
exploring the variation of inequality in immunization immunization coverage favors the advantaged households
coverage over time. Table 2 summarizes these inequality over time irrespective of all inequality measures used except
measures. for the relative concentration index of polio in the year 2008
(− 0.04). The inequality in immunization coverage is persist-
Results ent over time. A t-test on the coefficients of the relative con-
Main results centration index of all immunization coverage indicators
In Additional file 1: Table S1 we provide the coverage of suggests that for the year 1993, all relative concentration
childhood immunization over time for Kenya, Ghana, and indexes are positive and statistically different from zero. The
Côte d’Ivoire. With regard to full immunization coverage, same finding is valid for the year 1998 except for polio
results suggest that over time, the three countries have immunization. For the year 2003, the coefficients of the
not achieved the Global Vaccine Action Plan (GVAP) tar- relative concentration index of all immunization coverage
get goals of at least 90% national coverage. By focusing on indicators are positive and statistically different from zero. In
each routine vaccine, the GVAP coverage target was not the same vein, for the year 2008, the coefficients of the
achieved by Côte d’Ivoire irrespective of the time period. relative concentration index of all immunization coverage
For Kenya and Ghana, with regard to the DPT vaccine, indicators are positive and statistically different from zero
the GVAP target goals of at least 90% national coverage except for BCG immunization, full immunization, and polio
were almost achieved only in 2014. However, these immunization. Results also suggest that for the year 2014,
Fig. 1 Trends in inequality in childhood immunization coverage, KenyaDonfouet et al. BMC Public Health (2019) 19:988 Page 6 of 10
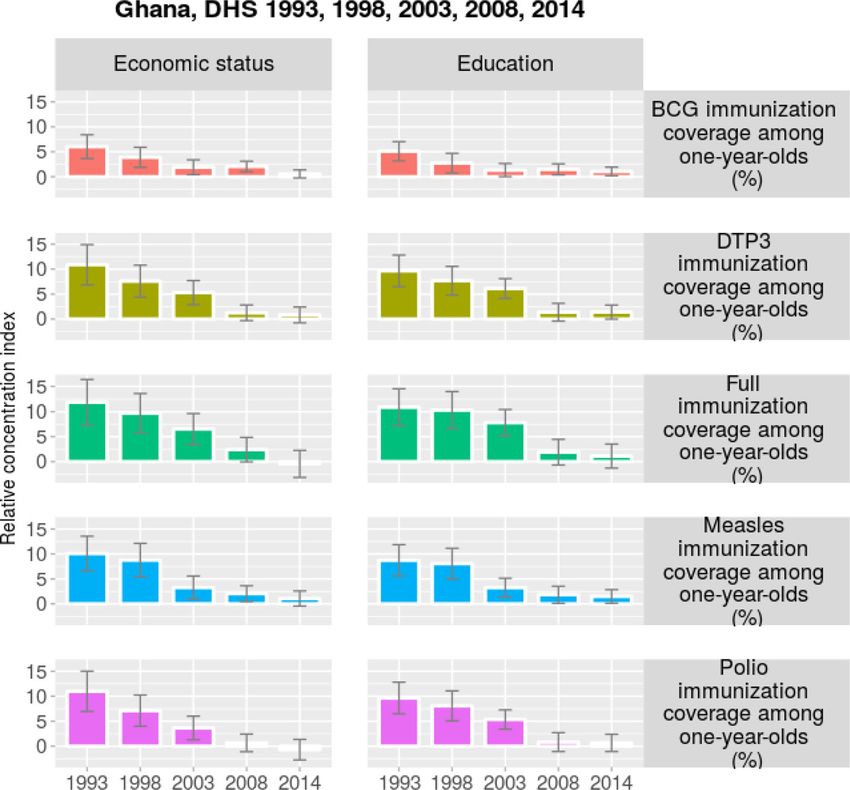
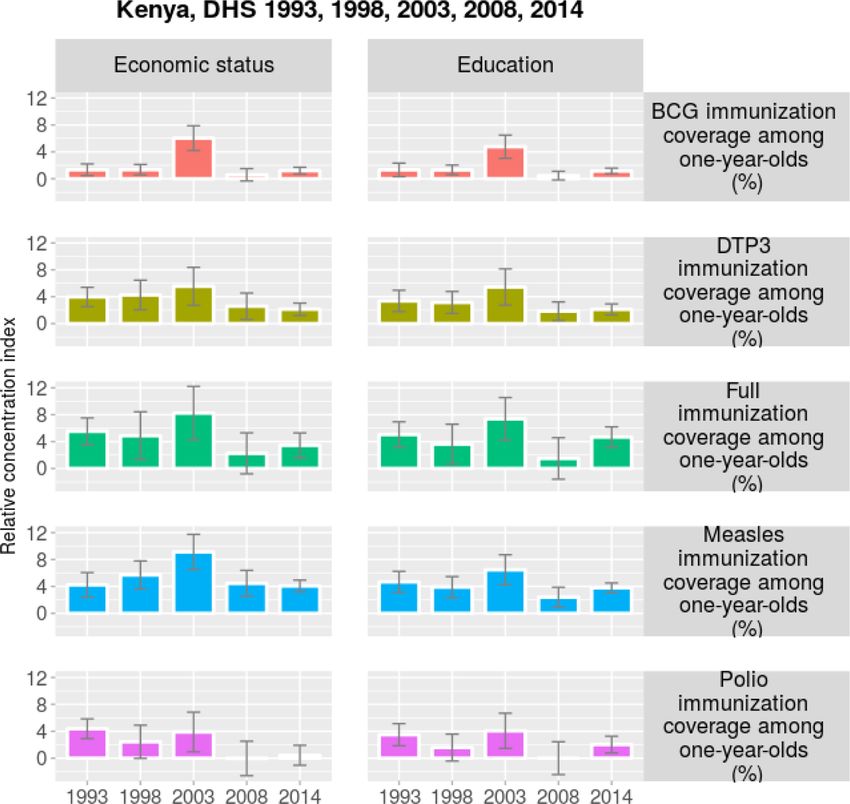
the coefficients of the relative concentration index of all Analysis of inequality in immunization coverage in Côte
immunization coverage indicators are positive and statisti- d’Ivoire
cally different from zero except for polio immunization. In most years there is a pro-rich inequality in
In Fig. 1, over time inequality in immunization immunization coverage in Côte d’Ivoire (Table 5). Because
coverage in Kenya follows an inverted U-shape curve the 95% confidence intervals do not contain zero, it is rele-
except for polio immunization. The turning point oc- vant to ascertain that the coefficients of the relative concen-
curs in 2003. This result suggests an improvement of tration index in immunization coverage is positive and
the equity of immunization coverage, indicating that statistically different from zero in all years (Fig. 3). Further-
with time the Kenyan government has been aware of more, in most years there is a decreasing pattern of inequal-
inequality in immunization coverage and endeavored ity in immunization coverage over time. Hence, though
to reduce it. The 95% confidence intervals displayed there is still a pro-rich inequality in immunization coverage
in Fig. 1 corroborates the findings drawn on the sig- in Côte d’Ivoire, this inequality is reduced over time.
nificance of the coefficients of the relative concentra-
tion index when a t-test is used. Sensitivity analysis
We explore the robustness of the findings using
Analysis of inequality in immunization coverage in Ghana education as the dimension of inequality. In Kenya,
Table 4 shows that in most cases, inequality in results indicate that inequality in immunization co-
immunization coverage in Ghana favors the ad- verage persists over time and favors the advantaged
vantaged households. A t-test on the coefficients of households (Additional file 1: Table S2). In most
the relative concentration index of all immunization years, a t-test on the relative concentration index of
coverage coefficients indicates that inequality in all immunization coverage coefficients, suggests that
immunization coverage is positive and statistically dif- inequality in immunization coverage is positive and
ferent from zero in most years. Figure 2 indicates a statistically different from zero. Furthermore, Fig. 1 suggests
decreasing pattern of inequality in immunization an inverted U-shape curve except for polio immunization.
coverage over time. It seems over time, the Ghanaian The findings are similar to Ghana and Côte d’Ivoire except
government has consistently shrunk inequality in that inequality in immunization coverage decreases over
immunization coverage. time (Additional file 1: Table S3 and Table S4).
Table 4 Inequality in childhood immunization coverage using economic status as inequality dimension, Ghana
Economic status Years
1993 1998 2003 2008 2014
Indicators Statistics Value SE Value SE Value SE Value SE Value SE
bcgv d 28.09 5.42 17.74 4.44 7.64 3.84 9.29 2.84 3.16 2.84
r 1.42 0.11 1.23 0.07 1.09 0.05 1.10 0.03 1.03 0.03
rci 6.04 1.22 3.91 1.02 1.91 0.76 2.07 0.54 0.57 0.54
dptv d 39.95 6.80 31.54 5.77 21.69 5.27 4.14 4.17 3.83 4.17
r 1.92 0.26 1.52 0.13 1.33 0.09 1.05 0.05 1.04 0.05
rci 10.88 2.06 7.59 1.63 5.29 1.23 1.25 0.80 0.82 0.80
fullv d 41.67 6.73 32.26 6.35 24.70 5.86 8.09 5.76 −2.57 5.76
r 2.11 0.32 1.66 0.18 1.45 0.13 1.11 0.08 0.97 0.08
rci 11.83 2.33 9.70 1.98 6.54 1.57 2.40 1.25 −0.47 1.25
mslv d 41.37 5.69 29.57 6.10 13.83 5.16 7.23 4.03 6.41 4.03
r 1.87 0.20 1.50 0.14 1.18 0.08 1.08 0.05 1.07 0.05
rci 10.09 1.77 8.76 1.72 3.27 1.17 2.06 0.81 1.08 0.81
poliov d 39.95 6.80 26.81 5.94 15.47 5.20 2.56 4.55 −4.30 4.55
r 1.92 0.26 1.44 0.12 1.23 0.09 1.03 0.05 0.95 0.05
rci 10.98 2.06 7.12 1.59 3.65 1.21 0.66 0.90 −0.71 0.90
Notes: bcgv, dptv, fullv, mslv, poliov are BCG immunization coverage, DTP3 immunization coverage, full immunization coverage, measles coverage and polio
coverage among children aged 12–23 months, respectively. d, r and rci are rate difference, rate ratio and relative concentration index, respectively. SE is the
standard errors. Economic status is determined using the wealth index. The wealth index is constructed on household assets and access to basic services using
the principal component analysis. The wealth index is divided into quintiles. Data sources are from DHS, and analyzed using the HEAT softwareDonfouet et al. BMC Public Health (2019) 19:988 Page 7 of 10 Fig. 2 Trends in inequality in childhood in childhood immunization coverage, Ghana Discussions Furthermore, the different shapes of inequality in In most years, this study shows that inequality in immunization coverage over time and space raise some immunization coverage in Kenya, Ghana, and Côte d’Ivoire questions: what explains the differences over space and is persistent over time, and it favors the most-advantaged time? All three countries benefited from Gavi financial households. This result could be explained by the fact that support. Why were these interventions more or less the most-advantaged households could be more informed successful in curbing inequalities in different contexts? about the benefits of immunization/vaccines which in turn For instance, using the most recent estimates on full increases their demand for immunization. They could also immunization for year 2014, Kenya and Ghana have no have more access to health facilities offering immunization major difference in full immunization coverage (the me- services. In Kenya, over time we observe an inverted U- dian value is 73.2, 78.6%, for Kenya and Ghana, respect- shape curve in inequality in immunization coverage except ively) but very different shapes of inequality over time: for polio immunization with the turning occurring in 2003. monotonic decrease in Ghana, and inverted U-shape in Results from Ghana suggest a decreasing pattern of Kenya. We argue that several factors could explain this inequality in immunization coverage over time. This result finding. First, the role and actions of CSOs in these suggests that policymakers in these countries seem to have countries could explain this variation since they are deployed some laudable efforts to reach the disadvantaged considered by Gavi as key actors in delivering health households, and thus reduce inequality though it still a services and immunization to the remote areas and dis- concern. Our findings are similar to Restrepo-Méndez et al. advantaged households. It is well established in the [7]‘s study who found a pro-rich inequality in full literature that CSOs can be used as a tool to address immunization coverage in some low-and-middle-income inequality [19, 20]. Hence, in countries with weak CSOs, countries though inequality in immunization coverage over public health spending meant for immunization could time and its pattern in Kenya, Ghana, and Côte d’Ivoire be more profitable to the most-advantaged households. were not explored. An inspection of the Civil Society Organization
Donfouet et al. BMC Public Health              (2019) 19:988                                                                            Page 8 of 10

Table 5 Inequality in childhood immunization coverage using                          Concerning Ghana, it is difficult to trace when the CHVs
economic status as inequality dimension, Côte d’Ivoire                               emerged. But, in the literature [21, 22] CHVs were
Economic status         Years                                                        spearheaded by faith-based organizations namely in
                        1994            1998           2006           2011           1999 where a community-based project was established
Indicators Statistics Value SE          Value SE       Value SE       Value SE       to provide essential health services. Given the success of
bcgv         d          46.74 4.26 31.85 6.71 27.80 4.36 23.85 4.28                  this project, in 2005 the Ghanaian government adopted
                                                                                     and named it as the community-based health planning
             r          1.96     0.16 1.47      0.15 1.39      0.08 1.33      0.08
                                                                                     and services (CHPS) programme as a national health
             rci        12.83 1.24 7.27         1.80 6.88      1.06 5.90      1.05
                                                                                     policy [23]. In Côte d’Ivoire, CHVs still provide health
dptv         d          47.96 5.02 51.45 7.63 34.13 5.20 28.56 5.44                  promotion services but they are unregulated because
             r          2.85     0.40 2.33      0.43 1.55      0.13 1.55      0.14   there are no clear national guidelines governing their
             rci        20.95 1.94 15.72 2.97 8.49             1.37 8.55      1.56   roles [24]. Third, total expenditures on routine
fullv        d          48.44 4.55 55.11 7.51 31.20 5.19 28.82 5.45                  immunization from all sources per capita ($US) could
                                                                                     also explain this variation. As displayed in Additional file
             r          4.08     0.74 2.85      0.64 1.50      0.12 1.73      0.18
                                                                                     1: Table S5, using more recent estimates on total expen-
             rci        25.48 2.21 19.92 3.58 7.91             1.33 10.52 1.92
                                                                                     ditures on routine immunization from all sources per
mslv         d          47.80 4.46 48.95 9.23 29.13 4.34 29.19 4.82                  capita, in most years Ghana has been spending more on
             r          2.55     0.28 2.06      0.40 1.42      0.09 1.54      0.12   routine immunization per capita than Kenya and Côte
             rci        16.75 1.67 12.37 3.31 7.26             1.06 8.36      1.45   d’Ivoire. Fourth, the sharp decrease of inequalities in
poliov       d          51.68 4.77 47.95 7.84 26.29 5.38 15.65 5.15                  immunization coverage in Ghana could be explained by
                                                                                     the adoption a more ambitious health reform such as
             r          2.84     0.38 2.19      0.39 1.39      0.11 1.24      0.09
                                                                                     the National Health Insurance Scheme (NHIS) aimed at
             rci        20.53 1.76 14.62 2.95 6.26             1.30 3.97      1.34
                                                                                     providing equitable access and financial protection for
Notes: bcgv, dptv, fullv, mslv, poliov are BCG immunization coverage, DTP3
                                                                                     healthcare services to Ghanaian citizens. As outlined by
immunization coverage, full immunization coverage, measles coverage and
polio coverage among children aged 12–23 months, respectively. d, r and rci          Grépin and Dionne [25], the adoption of NHIS in Ghana
are rate difference, rate ratio and relative concentration index, respectively. SE   was more comprehensive and inclusive since it called for
is the standard errors. Economic status is determined using the wealth index.
The wealth index is constructed on household assets and access to basic              universal coverage and a health package that covered
services using the principal component analysis. The wealth index is divided         nearly the entire disease burden present in the country.
into quintiles. Data sources are from DHS and MICS, and analyzed using the
HEAT software
                                                                                     In Ghana, the share of immunization delivery costs is
                                                                                     implicitly covered by NHIS payments to healthcare pro-
Sustainability Index (CSOSI) published by the USAID                                  viders. In the same vein, the Ghanaian government has
for Kenya and Ghana for the most recent years suggest                                been a strong voice and advocate of child health and
that the two countries are within the sustainability evol-                           strong political will to Gavi’s mission. For instance, John
ving category. But, the CSOSI do not shed more lights                                Mahama (president from 2012 to 2017) contributed to
on the classification of CSOs in each country with                                   the co-hosting of Gavi’s mid-term review in 2013.
regard to their advocacy capacity to immunization. This                                 The study has several policy implications. First, in Kenya,
indicates that more research is needed to explore the                                Ghana and Côte d’Ivoire, policymakers could be more stra-
link between the CSOs immunization advocacy and in-                                  tegic in addressing pro-rich inequality in immunization
equality in immunization. Second, shifting responsibi-                               coverage by designing health interventions through an equity
lities in health from higher to lower levels could also                              lens. Though reaching every district is already implemented,
explain this variation. In Kenya and Ghana, from our                                 the Tailoring Immunization Programmes (TIP) to reach the
interaction with CSOs working in these countries, the                                disadvantaged households could be an effective strategy. The
community health volunteers (CHVs) seem to be more                                   TIP [26, 27] aims at: (i) identifying households susceptible to
functional than in Côte d’Ivoire in terms of linking com-                            vaccine-preventable diseases; (ii) diagnosing supply-and de-
munities to health facilities and regulation. These CHVs                             mand-side barriers and motivators to vaccination; and (iii)
provide vital health services to their communities,                                  recommending evidence-informed responses to sustain vac-
enhance immunization coverage, and in some Kenyan                                    cination. Therefore, the TIP could help policymakers in those
counties, they are currently being considered as part of                             countries to involve all stakeholders, analyze the barriers to
the formal healthcare system. It is not therefore surpris-                           vaccination, research and design customized solutions/strat-
ing that inequality in immunization in Côte d’Ivoire is                              egies to increase immunization coverage of disadvantaged
much higher than in Kenya and Ghana. For instance, the                               households, implement and monitor these customized solu-
CHVs have been major players in the delivery of essen-                               tions/strategies. Another prominent strategy is the adoption
tial health service since the 1980s in Kenya and the                                 of a health system reform that is more inclusive and invest-
country adopted the community health strategy in 2007.                               ing more in immunization services with the aim of reaching
Donfouet et al. BMC Public Health (2019) 19:988 Page 9 of 10
Fig. 3 Trends in inequality in childhood in childhood immunization coverage, Côte d’Ivoire
more the underserved population. It seems this has Tailoring immunization programmes to reach the dis-
been the case for Ghana and it is not surprising that advantaged households could be an effective strategy. Our
there is a sharp decrease pattern in inequalities in findings suggest that investing more in immunization
childhood immunization coverage. Second, results suggest services with the aim of reaching more the underserved
that for improvement in coverage and equitable access to population combined with a strong political could be a
immunization, measuring and monitoring of immunization promising strategy.
coverage should be integrated into the country health However, the current study has some limitations.
strategic plan. This could ensure that in terms of First, the study does not fully explain the childhood
immunization coverage no child is left behind. The immunization coverage over time. We could have
major limitation of the paper is that the concentration decomposed the estimated concentration index to identify
index is not decomposed to identify factors that could factors that explain the concentration of childhood
explain the concentration of immunization coverage immunization coverage among the rich over time. Second,
among the most-advantaged households over time. the effect of migration policies in each country is not
explored.
Conclusions
The main results of the study suggest that in most years Additional file
inequality in immunization coverage in the three coun-
Additional file 1: Table S1. Coverage of childhood immunization over
tries persist over time, and it favors the most-advantaged time. Table S2. Inequality in childhood immunization coverage using
households. Policymakers could be more strategic in education as inequality dimension, Kenya. Table S3. Inequality in
addressing pro-rich inequality in immunization coverage childhood immunization coverage using education as inequality
dimension, Ghana. Table S4. Inequality in childhood immunization
by designing health interventions through an equity lens.Donfouet et al. BMC Public Health (2019) 19:988 Page 10 of 10
coverage using education as inequality dimension, Côte d’Ivoire. 6. Schlumberger M, Bamoko A, Yameogo T, Rouvet F, Ouedraogo R, Traore B,
Table S5. Comparison of the total expenditures on routine immunization et al. Positive impact on the expanded program on immunization when
from all sources (US$ per capita) over time. (DOCX 45 kb) sending call-back SMS through a computerized immunization register, Bobo
Dioulasso (Burkina Faso). Bulletin de la Société de Pathologie Exotique
(1990). 2015;108(5):349–54.
Abbreviations 7. Restrepo-Méndez MC, Barros AJ, Wong KL, Johnson HL, Pariyo G, França GV,
BCG: Bacille Calmette-Guérin; CSOs: Civil society organizations; et al. Inequalities in full immunization coverage: trends in low-and middle-
DHS: Demographic Health Surveys; DTP: Diphtheria, tetanus toxoid and income countries. Bull World Health Organ. 2016;94(11):794–805.
pertussis; EPI: Expanded Program on Immunization; GVAP: The Global Vaccine 8. Gram L, Soremekun S, ten Asbroek A, Manu A, O'leary M, Hill Z, et al.
Action Plan; HEAT: Health Equity Assessment Toolkit; IAI: Immunization Socio-economic determinants and inequities in coverage and timeliness
Advocacy Initiative; MICS: Multiple Indicator Cluster Surveys; VPDs: Vaccine- of early childhood immunisation in rural Ghana. Tropical Med Int
preventable diseases Health. 2014;19(7):802–11.
9. Schoeps A, Ouedraogo N, Kagone M, Sie A, Müller O, Becher H. Socio-
Acknowledgements demographic determinants of timely adherence to BCG, Penta3, measles, and
The authors would like to thank Dr. Hesborn Wao for the constructive complete vaccination schedule in Burkina Faso. Vaccine. 2013;32(1):96–102.
comments provided in an earlier draft. We also thank the four reviewers who 10. Özer M, Fidrmuc J, Eryurt MA. Maternal education and childhood
provided detailed comments which contributed to improve the quality of immunization in Turkey. Health Econ. 2018;27(8):1218–29.
the paper. 11. Vikram K, Vanneman R, Desai S. Linkages between maternal education and
childhood immunization in India. Soc Sci Med. 2012;75(2):331–9.
12. Abuya B, Onsomu E, Kimani J, Moore D. Influence of maternal
Authors’ contributions
education on child immunization and stunting in Kenya. Matern Child
HPPD conceived the idea of the paper, drafted the paper, led the data
Health J. 2011;15(8):1389–99.
analysis and interpretation of the results and discussions as well, and
13. Gandhi G. Charting the evolution of approaches employed by the global
approved the manuscript before submission; GA reviewed the paper,
Alliance for vaccines and immunizations (GAVI) to address inequities in
discussed the policy implication of the paper, and approved the manuscript
access to immunization: a systematic qualitative review of GAVI policies,
before submission; MKM contributed to the data analysis, interpretation of
strategies and resource allocation mechanisms through an equity lens
the results and discussions as well, and approved the manuscript before
(1999–2014). BMC Public Health. 2015;15:1) :1–35.
submission. All authors read and approved the final manuscript.
14. Arsenault C, Harper S, Nandi A, Rodríguez JMM, Hansen PM, Johri M. An
equity dashboard to monitor vaccination coverage. Bull World Health
Funding Organ. 2017;95(2):128–34.
No funding was obtained for this study. 15. WHO. Commission on social determinants of health: final report. Geneva:
World Health Organization; 2008.
Availability of data and materials 16. Hosseinpoor AR, Nambiar D, Schlotheuber A, Reidpath D, Ross Z. Health
All data used and analyzed during the current study are publicly available equity assessment toolkit (HEAT): software for exploring and comparing
from the Demographic Health Survey. The data sets are found/uploaded in health inequalities in countries. BMC Med Res Methodol. 2016;16:1) :1–10.
the Health Equity Assessment Toolkit (HEAT). The findings can be replicated 17. HEAT. Software for exploring and comparing health inequalities in countries.
using the HEAT available at this link: https://whoequity.shinyapps.io/HEAT/ Built-in database edition. Geneva: World Health Organization; 2018.
18. WHO. State of inequality: reproductive maternal newborn and child health:
Ethics approval and consent to participate interactive visualization of health data. Geneva: World Health Organization; 2015.
This paper uses secondary data (Demography Health Survey). The data are 19. Bernhard M, Jung D-J. Civil society and income inequality in post-
publicly available and do not require any permission for use. The data could communist Eurasia. Comparative Politics. 2017;49(3):373–97.
be used for teaching, analysis and paper writing. The data do not contain 20. Ekiert G, Kubik J, Wenzel M. Civil society and three dimensions of inequality
any code that could identify respondents. The usual disclaimer applies. in post-1989 Poland. Comparative Politics. 2017;49(3):331–50.
21. Nyonator FK, Awoonor-Williams JK, Phillips JF, Jones TC, Miller RA. The
Consent for publication Ghana community-based health planning and services initiative for scaling
Not applicable. up service delivery innovation. Health Policy Plan. 2005;20(1):25–34.
22. Aikins A-G, Koram K. Health and healthcare in Ghana. In: Aryeetey E, Kanbur
R, editors. The economy of Ghana sixty years after independence. Oxford
Competing interests
Scholarship Online: United Kingdom; 2017. p. 1957–2017.
All authors declare no competing interest. Furthermore, though the
23. Adongo PB, Tapsoba P, Phillips JF, Tabong PT-N, Stone A, Kuffour E, et al.
corresponding author is an Associate Editor of BMC Public Health, HPPD
The role of community-based health planning and services strategy in
declares no competing interest.
involving males in the provision of family planning services: a qualitative
study in southern Ghana. Reprod Health. 2013;10:1) :1–15.
Received: 25 March 2019 Accepted: 12 July 2019
24. Muriuki AM, Moss T. The impact of Para-professional social workers and
community health care workers in Côte d'Ivoire: contributions to the
protection and social support of vulnerable children in a resource poor
References country. Child Youth Serv Rev. 2016;67:230–7.
1. McGovern ME, Canning D. Vaccination and all-cause child mortality from 25. Grépin KA, Dionne KY. Democratization and universal health coverage: a
1985 to 2011: global evidence from the demographic and health surveys. case comparison of Ghana, Kenya, and Senegal. Global Health Governance.
Am J Epidemiol. 2015;182(9):791–8. 2013;6(2):1–27.
2. Aaby P, Bukh J, Lisse IM, Smits AJ. Measles vaccination and reduction in 26. Butler R, MacDonald NE. Diagnosing the determinants of vaccine hesitancy
child mortality: a community study from Guinea-Bissau. J Infect. 1984; in specific subgroups: the guide to tailoring immunization Programmes
8(1):13–21. (TIP). Vaccine. 2015;33(34):4176–9.
3. Koenig MA, Khan MA, Wojtyniak B, Clemens JD, Chakraborty J, Fauveau V, et 27. WHO. The guide to tailoring immunization programmes (TIP). Copenhagen,
al. Impact of measles vaccination on childhood mortality in rural Copenhagen, Denmark: World Health Organization; 2013.
Bangladesh. Bull World Health Organ. 1990;68(4):441–7.
4. Higgins JP, Soares-Weiser K, López-López JA, Kakourou A, Chaplin K,
Christensen H, et al. Association of BCG, DTP, and measles containing Publisher’s Note
vaccines with childhood mortality: systematic review. BMJ. 2016;355:1–13. Springer Nature remains neutral with regard to jurisdictional claims in
5. Bryce J, Black RE, Walker N, Bhutta ZA, Lawn JE, Steketee RW. Can the world published maps and institutional affiliations.
afford to save the lives of 6 million children each year? Lancet. 2005;
365(9478):2193–200.You can also read