Trudeau Government Rejects Chrétien's Fiscal Prudence - Fraser Institute
←
→
Page content transcription
If your browser does not render page correctly, please read the page content below

NEWS AND INFORMATION FOR SUPPORTERS AND FRIENDS OF THE FRASER INSTITUTE

 SPRING 2020

           Trudeau Government Rejects
            Chrétien’s Fiscal Prudence

ALSO INSIDE    30 Alberta's fair deal   12 Government and private sector compensation   32 Climate realities
FRASER
 INSTITUTE      MESSAGE FROM THE INSTITUTE'S PRESIDENT

                              Dear Fraser Institute Friends and Supporters,

                              It is clear that the Trudeau government has rejected the fiscal
                              prudence of its Liberal predecessor under Mr. Chrétien—from which
                              Canada benefited greatly. The most obvious difference is to the
                              approach each took to deficits and debt (see page 16). The Chrétien
                              government inherited a $40 billion deficit and took decisive action to
                              balance the budget. In contrast, the Trudeau government inherited a
                              budget surplus and has purposefully run deficits totaling $77 billion,
                              with no end in sight.
                              In this issue of The Quarterly we celebrate the 25th anniversary of
                              the Chrétien government’s historic 1995 budget, which dealt with a
                              then-decades-long problem of overspending that nearly bankrupted
                              the country (see pages 2 to 5 for a summary of our essay series on the
                              1995 budget).
                              Before you dive into this issue, however, I’d like to share with you
                              the impact that the Fraser Institute had on the 1995 federal budget.
                              After years of warning Canadians about the perils of excessive,
Niels Veldhuis                deficit-financed government spending and the alarming growth of
President, Fraser Institute   government debt in Canada, the Fraser Institute held a conference
                              in Toronto in November 1994 called Hitting the Wall: Is Canada
                              Bankrupt? One journalist in attendance was John Fund of the Wall
                              Street Journal and shortly after, he wrote an influential editorial for the
                              paper, entitled “Canada Bankrupt?” In it, he wrote:
                                  Turn around and check out Canada, which has now
                                  become an honorary member of the Third World in the
                                  unmanageability of its debt problem. If dramatic action isn’t
                                  taken in next month’s federal budget, it’s not inconceivable
                                  that Canada could hit the debt wall.
                              The piece set off a wave of concern around the world regarding
                              Canada’s debt problem. It also ultimately led to the 1995 budget.
                              Indeed, then-Associate Deputy Minister of Finance and later Governor
                              of the Bank of Canada, David Dodge, called the WSJ editorial a
                              “seminal event” in Canada’s political life and very influential in the
                              creation of the 1995 budget.
                              The Chrétien government changed course—and changed Canada from
                              a fiscal basket case to a recognized world leader in fiscal prudence.
                              That is why educating Canadians about the federal government’s
                              damaging fiscal policies is so important to the Fraser Institute.
                              I hope you enjoy this edition of The Quarterly. After you’ve finished
                              reading it, please pass it on to your friends, family, and colleagues.
                              As always, I thank you for your ongoing support.
                              Best,

                              Niels
New Research
                                Essays Celebrating the Budget that Changed Canada                    2
                                Canada Remains Only High-Income Universal Health-Care Country
                                to Eschew Private Medical Insurance 6
                                Interest Cost on Debt will Cost Each Canadian More than $1,000 per Year                        8
                                Only 9% of Ontario's Job-Creation Happened Outside GTA and Ottawa Since 2008                                   10
                                Comparing the Wages and Benefits of Workers in the Government
                                and Private Sectors 12
                                Catching up With Canada: A Prosperity Agenda for Atlantic Canada                        14

     Recent Columns
                                Trudeau Government Rejects Almost Every Principle of Historic 1995
                                Chrétien Budget 16
                                Focus on Economic Growth—Not Redistribution through Tax Hikes on the Rich                              18
                                Carney’s Climate Plans May Push Oil and Gas Production from Canada to
                                State-Owned Firms Abroad 20
                                Trudeau Sets Another Record—and Not in a Good Way                        22
                                Struggling First Nations Share Common Characteristics                    24
                                Ontario Won’t Be “Open for Business” Without Business Property Tax Reform                            26
                                Quebec and BC Spend Less on Education than Other Provinces—
                                While Outperforming Most 28
                                Any “Fair Deal” for Alberta Requires a Fundamental Rethink of Fiscal Federalism
                                in Canada 30
                                You Can Believe in Climate Science Without Supporting Every Proposed
                                Climate Policy 32

     Education Programs
                                Over ten thousand students and teachers influenced and new
                                Economics of Superheroes curriculum released 34

     Staff Profile
                                Tegan Hill          36

     Cover: Liberal Party of Canada Flickr Photos

RETURN UNDELIVERABLE CANADIAN ADDRESSES TO: The Fraser Institute, 4th Floor, 1770 Burrard Street, Vancouver, British Columbia Canada V6J 3G7
FRASER
 INSTITUTE           NEW RESEARCH
                     INFOGRAPHIC

Essays Celebrating the Budget that
Changed Canada

William Watson and Jason Clemens, Editors

February 28th, 2020, is the 25th anniversary of
one of the most important federal budgets in
Canada’s history. It took decisive steps to solve
runaway deficits and mounting debt that began
in the late 1960s. We invited noted economists
and analysts to write on different aspects of the
historic 1995 budget. The following is a brief
summary of some of their essays.

O     ne of the first essays in the series, by University
      of Windsor Professor Lydia Miljan and Fraser Insti-
tute economists Tegan Hill and Niels Veldhuis, explores
the importance of spending reductions—as opposed
to tax increases—in the success of the 1995 budget.
No fewer than 24 budget speeches in the previous
three decades had claimed to introduce some sort of
spending restraint. But the 1995 federal budget actually
did: nominal program spending fell from $123.3 billion in
                                                               Miljan, Hill, and Veldhuis conclude that the spending
1994-95 to $111.3 billion in 1996-97.
                                                               reductions enacted in the 1995 budget and the process
The focus on spending reductions was underpinned by a          it used vastly improved the state of federal finances
formal process of “Program Review” that set hard targets       and helped initiate a decade of balanced budgets and
for each department that approached and even exceeded          declining debts.
50 percent. The process included a six-step analysis to
                                                               Several essays in the series explore specific aspects
assess and prioritize existing government spending:
                                                               of the spending reductions. Former Fraser Institute
• Does the program serve the public interest?                  senior fellow Mark Milke, for instance, examines how the
                                                               federal budgets of 1995 and 1996 made big cuts in what
• Is it affordable?
                                                               is variously known as subsidies to business, corporate
• Is government intervention necessary?                        welfare, or crony capitalism. The Chrétien government
•W
  hat is the appropriateness of the federal                   undertook fundamental reform with an overall target of
 government’s involvement?                                     cutting subsidies to business by roughly 60 percent, or
                                                               $2.3 billion, with cuts varying by sector from just over
• Is there potential for private/public sector
                                                               a third in cultural industries to more than 97 percent in
   cooperation?
                                                               transportation. Some programs were entirely eliminated
• Is it efficient?                                             (grain transportation subsidies, for example) while in

2   The Quarterly: News and information for supporters and friends of the Fraser Institute
FISCAL BALANCE AND NET DEBT, 1990/91 – 2010/11
40,000 700,000
30,000
20,000 600,000
Surplus / Deficit in millions of dollars
10,000
Net debt in millions of dollars
0 500,000
-10,000
-20,000 400,000
-30,000
-40,000 300,000
-50,000
-60,000 200,000
19
19
19
19
19
20
20
20
20
20
20
90
92
94
96
98
00
02
04
06
08
10
\0
\9
\9
\9
\9
\0
\0
\0
\0
\0
\1
1
3
5
7
9
1
3
5
7
9
1
Surplus or deficit Net Debt
other cases government enterprises were privatized air University of Calgary economist Professor Ronald Knee-
traffic control, for example) or saw their privatizations bone and Fraser Institute economist Jake Fuss look at
completed, as with CNR, Petro-Canada, and National the role of the 1995 budget in reforming social assistance.
Sea Products Limited. As Milke notes, these two budgets The 1995 budget reduced spending in the Canada Assist-
did not end corporate welfare, but for a time at least, ance Plan (CAP), one of the key federal transfers to the
cuts in grants to business played an important role in provinces, but it also switched it to block funding. Specif-
re-establishing a balanced budget and sound govern- ically, CAP was transitioned from a cost-sharing program
ment finances. in which the federal government had very limited control
‘‘
of the costs to a block grant that provided the prov-
inces with a set amount of funding. Critically, the federal
The Chrétien government government also removed almost all the restrictions
introduced the full indexation attached to the funding. As Kneebone and Fuss explain,
less federal control over how federal transfer money was
of the personal income tax in 2000, a spent led to innovations and experimentation.
reform that ensured taxpayers would
Economist David Henderson provides a particularly
thereafter only be taxed on real, rather interesting essay on the “fiscal anchor” the Chrétien
than inflation-generated increases in government used. A fiscal anchor, or budget rule, guides
a government in its spending and tax decisions. The
their incomes. In 2001 the government
Chrétien government imposed a requirement for not
removed a 5 percent surtax that had only a balanced budget but reductions in the absolute
applied to the top tax brackets. It also value of government debt. Two techniques that allowed
it to succeed were contingency buffers built into the
reduced statutory personal income tax budget and consistent underestimation of revenues. For
rates… and materially reduced the instance, in three budget years (1997, 2000, and 2003)
capital gains tax.” actual revenues exceeded budgeted revenues by more
than $15 billion. The government’s strong fiscal discipline,
made possible by its commitment and adherence to a
Spring 2020 3
INCOME TAX RATE CHANGES, 2000 – 2001
32%
30.45% Tax rates for 2000
30% 29 %
29%
28% Tax rates for 2001
26%
26%
25%
24%
22%
22%
20%
18% 17%
16% 16%
Taxable
Ta
Taxa
xabl
ble Income
e In
Inco
co
$
30,004 $
60,009 $
74,240
$
30,754 $
61,509 $
100,000
durable fiscal anchor, eventually enabled it to reduce the lower tax rates and fewer exceptions and exclusions.
country’s debt substantially. Successive federal governments largely complied with
these recommendations with the result that the “marginal
Two essays explore how the achievement of a balanced
effective tax rate” on capital for large and medium-
budget in 1997-98 through the reforms of the 1995
sized businesses declined from more than 45 percent in
budget allowed for meaningful tax reductions. The first
2000 to a low of about 17 percent in 2012. This change
essay focuses on the personal income and capital gains
coincided, as would be expected, with an increase in
tax reductions introduced by the Chrétien government
investment spending as a share of GDP, relatively more
starting in 1998. The first major tax cut, though, was the
economic activity in services, and no appreciable decline
full indexation of the personal income tax in 2000, a
in revenues from corporate taxation.
reform that ensured taxpayers would thereafter only be
taxed on real, rather than inflation-generated increases
in their incomes. In 2001 the government removed a 5
percent surtax that had applied to the top tax brackets. MARGINAL EFFECTIVE TAX RATES FOR LARGE AND
It also reduced statutory personal income tax rates: from MEDIUM-SIZED CORPORATIONS, 1997 – 2016
17 to 16 percent, from 25 to 22 percent, and from 29 to 26 50%
percent. It introduced a new top bracket with the previous
rate of 29 percent for those with taxable incomes greater
40%
than $100,000. The Chrétien government also materially
reduced the capital gains tax. The authors conclude that
30%
the tax relief helped improve the country’s economic
performance and competitiveness.
20%
In a companion piece, noted economist Jack Mintz
summarizes the federal government’s reform of the busi-
10%
ness tax system. Canada’s main tax problem in the late
1990s was high and uncompetitive business tax rates
that were tilted to favour primary and manufacturing 0%
19
19 7
19 8
20 9
20 0
20 1
20 2
20 3
20 4
20 5
20 6
20 7
20 8
20 9
20 0
20 1
20 2
20 3
20 4
20 5
businesses over services. The Technical Committee that
9
9
9
0
0
0
0
0
0
0
0
0
0
1
1
1
1
1
1
16
Mintz chaired recommended a more neutral system with
4 The Quarterly: News and information for supporters and friends of the Fraser Institute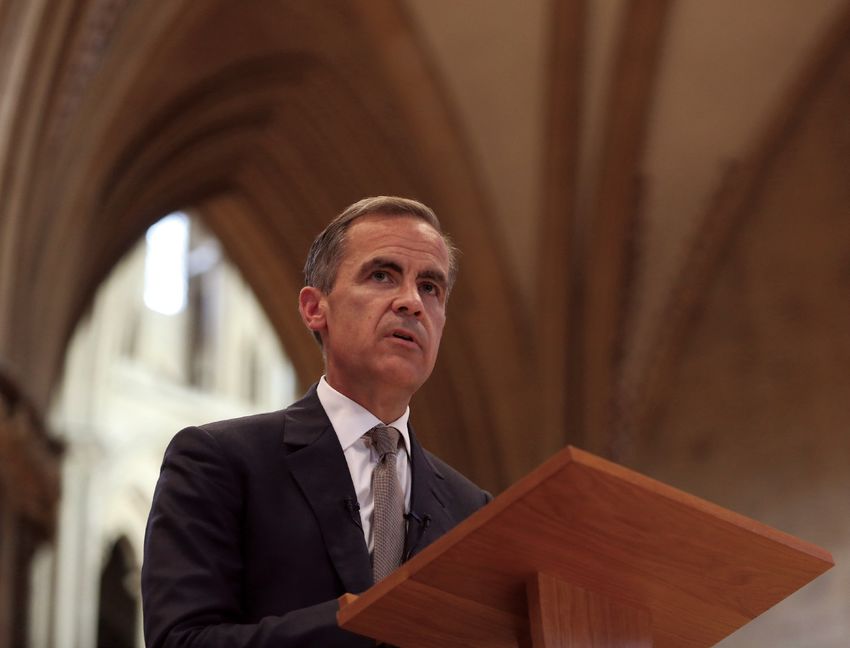
the Great Recession that followed positioned Canada
PROGRAM SPENDING, 1965/66 – 2003/04 better than most G7 countries not only to weather the
fiscal storm but then to return expeditiously to the
180,000
productive policies of the Chrétien era. Drummond also
160,000 warns, however, that the deficits of today that continue
140,000 in excess of $20 billion despite the economy operating
Millions of dollars (Nominal)
120,000 close to or even at capacity raise serious questions about
100,000 the federal government’s commitment to the responsible
80,000 path chosen in 1995.
60,000 As these essays show, the depth and breadth of the
40,000 reforms enacted in the 1995 budget are impressive,
20,000 indeed historic. They set the stage for more than a
0 decade of fiscal responsibility and economic prosperity
and provided a strong fiscal foundation that stood
19
19
19
19
19
19
19
19
19
20
65
69
73
77
81
85
89
93
97
01
Canada in good stead during the turbulence of the
\6
\7
\7
\7
\8
\8
\9
\9
\9
/0
6
0
4
8
2
6
0
4
8
2
2008-09 financial crisis and recession. The hallmarks of
‘‘
fiscal responsibility established in 1995 and continued
for at least 10 years—restrained and prioritized
… the bold policy actions spending, balanced budgets, declining debt, gener-
alized tax relief, and greater federal-provincial decen-
the federal government took tralization—ultimately served the country well. In view
in the mid-1990s put Canada’s public of the challenges and difficulties Canadians and their
politicians faced in reversing 30 years of fiscal drift, it
finances onto a virtuous circle that
is surprising and disappointing on this 25th anniversary
continues to affect federal finances of such an important milestone in the country’s fiscal
today… the determined actions of history that the current federal government has rejected
budget balance, debt reduction, and universal tax relief
the Chrétien-Martin governments as fiscal principles. It is our hope that helping Canadians
transformed a deficit of over $30 understand the success of the 1995 budget—and the
costs of the alternative approaches that are once again
billion in 1995-96 into a surplus of being favoured—will encourage a return to sounder and
$14.3 billion by 1999-00.” more productive fiscal policies.
The final essay in the series is by Don Drummond, Asso-
ciate Deputy Minister in the Department of Finance
during the reforms, who explains how the bold policy
actions the federal government took in the mid-1990s
put Canada’s public finances onto a virtuous circle that
continues to affect federal finances today. Drummond
shows how the determined actions of the Chrétien-
Martin governments transformed a deficit of over $30
billion in 1995-96 into a surplus of $14.3 billion by 1999- WILIAM WATSON JASON CLEMENS
00. The government’s electoral success during this time
William Watson is a Professor of Economics at McGill
showed that Canadians generally bought into the fiscal and a Fraser Institute Senior Fellow. Jason Clemens is
policies of the government—restrained and prioritized Executive Vice President of the Fraser Institute.
They are editors of the publication The Budget that
spending, balanced budgets, declining debt, and tax Changed Canada: Essays on the 25th Anniversary of
relief. Importantly, Drummond explains how the fiscal the 1995 Budget.
policies of the decade preceding the crash of 2008 and
Spring 2020 5
FRASER
    INSTITUTE     NEW RESEARCH
                  INFOGRAPHIC

Canada Remains Only High-Income
Universal Health-Care Country to Eschew
Private Medical Insurance

Steven Globerman

In its sole reliance on government providing
“first-dollar” coverage of medically necessary
                                                                    2020

services, Canada’s health care system is unique
among high-income countries with universal                                 Understanding Universal Health Care
                                                                            Reform Options: Private Insurance
health care. In particular, virtually all high-income
countries including Australia, Germany, Switzer-
land, and the Netherlands allow residents to use
private insurance to pay for some or all medically
necessary services.

H     ere in Canada, the role of private health insurance
      was litigated in the Chaoulli case in Quebec and in
the recent case involving Dr. Brian Day’s surgical clinic
in British Columbia. In both cases, the provincial govern-
ments took strong stands against allowing private health                              Steven Globerman

insurance for medically necessary services. Yet their
arguments seem increasingly weak in light of ongoing
developments in the health care sector.

Why the opposition to private health care?                      obtain faster or “better” health care than those with
One common concern, as noted in the new Fraser Insti-           lower incomes. While private insurance would likely
tute study Understanding Universal Health Care Reform           facilitate faster access to medical treatment were it
Options: Private Insurance, is that private health insur-       legal, it would also likely reduce wait times for patients
ance will so undermine universal coverage that health           who rely solely on public insurance as the patients with
insurance becomes unaffordable for lower-income                 private insurance would rely more on resources funded
Canadians. However, other countries have successfully           by private insurers and less on resources funded by
addressed this concern through government subsidies             the government. This has broadly been true in coun-
and regulations that prevent income levels and pre-ex-          tries where private insurance is used, in part, to obtain
isting health conditions from interfering with full             faster access to providers (surgeons, for example).
coverage of basic health care.
                                                                Consequently, it’s no coincidence Canada has the
A related concern is that private insurance will produce        longest wait times for medical services among all high-
a “two-tier” system where patients with higher incomes          income countries.

6     The Quarterly: News and information for supporters and friends of the Fraser Institute
Furthermore, there’s no consistent evidence that               mortality and morbidity. A robust private health insur-
allowing private insurance markets results in poorer           ance market would provide Canadians with increased
health care outcomes for patients who rely solely on           options to access new medical therapies and procedures
public insurance. Nor do private insurance markets             (digital consultations, for example) that public health
erode political support for taxpayer-funded health             officials, who tend to be focused on cost containment,
insurance. Indeed, by facilitating reduced wait times,         may be unwilling to deem “medically necessary” under
private markets act as a “safety net” for the government       the public insurance scheme.
insurance scheme, thereby undergirding the continued
                                                               Simply put, Canadian patients are entitled to make
willingness of wealthier taxpayers to fund the public
                                                               informed choices about their health care. Private health
insurance scheme through progressive marginal income
                                                               insurance, within our universal system, will provide more
tax rates.
                                                               choice for patients when making some of the most

‘‘
                                                               critical decisions of their lives.
            Canadian patients are entitled
            to make informed choices
   about their health care. Private health
   insurance, within our universal system,
   will provide more choice for patients
   when making some of the most critical
   decisions of their lives.”

And it’s not just about wait times. Crucially, relying on a
single public insurer will delay the adoption of medical
innovations. Politicians and bureaucrats have less
incentive than private-sector organizations to adopt
innovations that may be costly in the short-run but that
have positive net benefits in the long-run. In part, this is
because politicians and senior bureaucrats are unlikely
to be in office long enough to be rewarded (in the case
of politicians, by voters) for promoting the use of costly
new drugs and procedures whose benefits are realized
by patients (and the health care system more broadly)
over time.

The emergence of personalized medicine has already
                                                                                      Steven Globerman is Resident
resulted in new drugs capable of curing hitherto incur-                               Scholar and Addington Chair in
able diseases. And much more such innovation is on the                                Measurement at the Fraser Institute.
way. Again, these new treatment protocols are expen-                                  He is the author of Understanding
                                                                                      Universal Health Care Reform
sive in the near-term but promise to reduce ongoing                STEVEN GLOBERMAN   Options: Private Insurance.
costs of care over time, not to mention reductions in

                                                                                                           Spring 2020       7
FRASER
    INSTITUTE     NEW RESEARCH
                  INFOGRAPHIC

Interest on Government Debt will Cost
Each Canadian More than $1,000 per Year

Jake Fuss and Milagros Palacios

For most Canadian families, the topic of govern-
ment debt likely never comes up at the dinner
                                                                   FRASER
                                                                   RESEARCH              BULLETIN
table. And it’s easy to see why. With mortgages,                                                                                                               February 2020

vehicle leases, and credit card bills, many Cana-                  Interest Costs and their Growing
dians have enough household debt to keep them                      Burden on Canadians
                                                                   by Jake Fuss and
occupied, so government debt ranks fairly low on                   Milagros Palacios

their list of concerns.

B    ut actually, government debt now represents a
     substantial burden for every Canadian regardless
of where you live. In fact, as noted in a new Fraser Insti-
                                                                   Summary


                                                                    In recent years, deficit spending and grow-
                                                                   ing government debt have become a trend for
                                                                                                                        Canada’s most populous province, is the next
                                                                                                                        highest at $1,550 per person.


                                                                                                                         At the federal level, the amount that will be
                                                                                                                        spent on interest payments in 2019-20 ($24.4
                                                                   many Canadian governments. Like households,
                                                                                                                        billion) is higher than what the government ex-
tute study, The Growing Debt Burden for Canadians,                 governments are required to pay interest on
                                                                   their debt. These interest payments consume
                                                                   resources that could have been used for tax
                                                                                                                        pects to spend on Employment Insurance ben-
                                                                                                                        efits ($19.3 billion) and the Canada Child Benefit
                                                                                                                        ($24.1 billion).
government debt—both federal and provincial (adjusted              relief or for health care, education, and social
                                                                   services.
                                                                                                                         Ontarians are projected to spend $22.6 bil-
                                                                                                                        lion on combined federal and provincial inter-

                                                                    On aggregate, the provinces and federal
for any financial assets held by the government)—is                government are expected to spend $54.8 billion
                                                                   on interest payments in 2019-20. For a Cana-
                                                                                                                        est costs in 2019-20, which is more than the
                                                                                                                        province receives from the Canada Health
                                                                                                                        Transfer (CHT) and the Canada Social Transfer
                                                                   dian family of four, interest costs will translate
expected to reach nearly $1.5 trillion this year.                  to an average of $5,830.
                                                                                                                        (CST). Meanwhile, total expenditures on inter-

‘‘
                                                                                                                        est costs for Albertans ($6.4 billion) and British

                                                                    Residents in Newfoundland & Labrador face           Columbians ($5.9 billion) are more than what
                                                                   by far the highest combined federal-provincial       each province expects to spend on social ser-
                                                                   interest payments per person ($3,343). Ontario,      vices this year.

               Federal and provincial
                                                                   fraserinstitute.org                                                   FRASER RESEARCH BULLETIN 1

               government debt (adjusted
                                                                this year. However, the burden of interest costs varies
     for any financial assets held by the
                                                                widely across the country as some provinces are more
     government) is expected to reach                           indebted than others.
     nearly $1.5 trillion this year.”                           For example, the Ontario government expects to spend
                                                                almost $13 billion on government debt interest costs in
                                                                2019/20—more than what the province spends on post-
                                                                secondary education. In other words, each Ontarian will
Like households, governments must pay interest on               pay approximately $886 in interest payments on the
their debt, which is ultimately paid by Canadians in the        provincial debt.
form of taxes. These interest payments divert resources
                                                                In Newfoundland and Labrador, the province spends
away from services such as health care and education.
                                                                $1.4 billion on annual government debt interest costs,
Put differently, interest costs create a wedge between
                                                                nearly double what it spends on education and early
the taxes we pay and the actual services we receive.
                                                                childhood development. Consequently, provincial
In every province, Canadians will pay more than $500            interest costs equal $2,675 per person, the highest
per person in provincial government debt interest costs         number ion the country.

8     The Quarterly: News and information for supporters and friends of the Fraser Institute
Canada's Interest Costs
Interest on government debt will cost each Canadian more than a thousand dollars this year
3,343
Combined federal and provincial interest costs per person,
3,500
3,000
2,500
2019/20 ($)
2,000
1,468 1,550
1,446 1,370
1,500 1,309 1,317 1,236
1,156 1,210
1,000
500
0
BC AB SK MB ON QC NB NS PE NL
Federal Provincial
But Canadians don’t just pay provincial interest costs; they budget deficits and debt accumulation. Ultimately,
also pay interest on federal debt. Ottawa is expected to Canadians bear the burden of interest costs and younger
spend $24.4 billion on federal government debt interest generations will continue to pay the price in the future
costs in 2019/20—billions more than what we spend on for today’s debt accumulation.
employment insurance benefits, for example.
‘‘
Government debt can sometimes be an afterthought
for many people because we don’t necessarily see the
Ottawa is expected to spend impact on our lives. There are more interesting things
to discuss at coffee shops, restaurants, and the family
$24.4 billion on federal dinner table, but this issue affects everyone in Canada
government debt interest costs in no matter where you live. When you realize how much
2019/20—billions more than what Canadian families spend every year just on interest
payments to service government debt, the issue doesn’t
we spend on employment insurance seem so trivial anymore.
benefits, for example.”
In total, the provinces and federal government are
expected to spend $54.8 billion on combined federal and
provincial interest payments this year. On a per-person
basis, Newfoundlanders & Labradorians pay the highest
combined government debt interest costs in Canada
JAKE FUSS MILAGROS PALACIOS
($3,343 per person) followed by Ontarians ($1,550)
Jake Fuss is an economist and Milagros Palacios
while British Columbians pay the lowest ($1,156). is Associate Director in the Addington Centre for
Measurement at the Fraser Institute. They are co-authors
Clearly, government debt comes at a cost, and there of the study The Growing Debt Burden for Canadians.
are negative consequences associated with persistent
Spring 2020 9FRASER
INSTITUTE NEW RESEARCH
INFOGRAPHIC
Only 9% of Ontario's Job-Creation
Happened Outside GTA and Ottawa
Since 2008
Ben Eisen and Steve Lafleur
Ontarians have suffered more than their share of
economic pain over the past 15 years. For much of FRASER
RESEARCH BULLETIN
the 2000s, the province’s manufacturing sector February 2020
was struggling—and then the 2008/09 reces- Uneven Recovery: Job Creation in Ontario’s
Urban Centres between 2008 and 2018
sion made things much worse. Unfortunately, in
the years that followed, the province’s recovery
was tepid.
T his pain, however, has been spread unevenly across
the province. Toronto (and its surrounding area) and
Ottawa have been spared the worst of the economic
Summary
Past analyses from the Fraser Institute
by Ben Eisen
have experienced weak or negative job creation
completed in 2015 and 2017 have measured between 2008 and 2018.
damage. But if you look outside the province’s two largest
labour market performance in various regions
across Canada in the period during and follow-
In aggregate, from 2008 to 2018, the two
GTA CMAs combined (Toronto and Oshawa)
ing the 2008/09 recession.
experienced employment growth totaling 17.3
metropolitan areas, you’ll find that large numbers of
This short paper updates this work with
the most recent available data, focusing more
percent. In Ottawa, this figure was 9.7 percent.
By comparison, net job creation in the rest of
narrowly on one specific metric—job creation. the province over the course of this decade was
Ontarians have suffered even more than provincial-level More specifically, it measures job creation in
urban centres across Ontario.
just 1.9 percent.
In total, 91 percent of all net job creation
economic statistics suggest.
Ontario’s economic recovery has been un- in Ontario between 2008 and 2018 occurred
even. Some Census Metropolitan Areas (CMAs) in either the two GTA CMAs or Ottawa. Just
such as Toronto and Ottawa have enjoyed com- 9.0 percent of net job creation in Ontario
‘‘
paratively robust job creation. Some, including during this decade occurred elsewhere in the
London, Sudbury, Peterborough, and others province.
fraserinstitute.org FRASER RESEARCH BULLETIN 1
We found that [between 2008
and 2018] 91 percent of all net
took place in the GTA and Ottawa compared to 9
job creation in Ontario took place in the percent in the rest of the province.
GTA and Ottawa compared to 9 percent Here’s another way to look at it. Between 2008 and
in the rest of the province.” 2018, the number of jobs in increased by 17.3 percent in
the GTA and 9.7 percent in Ottawa—compared to just
1.9 percent in the rest of the province. In short, outside
of Toronto and Ottawa, there was almost no net job
creation over 10 years.
The numbers tell the story. In a recent study, Uneven
Recovery: Job Creation in Ontario’s Urban Centres It’s also important to recognize that when we discuss
between 2008 and 2018, we analyzed job growth weak economic performance outside of Toronto and
between 2008 and 2018 (the latest year of comparable Ottawa, we’re not just talking about small towns
data) in Ontario’s 15 largest population centres. We and rural areas. Other major population centres
found that 91 percent of all net job creation in Ontario have stagnated.
10 The Quarterly: News and information for supporters and friends of the Fraser InstituteMapping job growth in Ontario
Comparing job creation among the different regions of the province from 2008–2018
%
%
%
Consider that southwestern Ontario, which has experi- Of course, job creation in Toronto and Ottawa is good
enced weak job growth, has approximately as many news, but a deeper look outside the two largest cities
residents as the Maritime provinces combined. London reveals a lost decade with respect to job growth.
is about the same size as Halifax. Northern Ontario, Hopefully as policymakers at Queen’s Park and Parlia-
which also experienced slow rates of job creation during ment Hill become more aware of the magnitude of
the 10-year period, is more populous than any individual Ontario’s economic woes, they will recognize the need
Maritime province. for pro-growth policies that can help spur job creation,
‘‘
wage growth, and prosperity for Ontarians no matter
where they live in the province.
As long as large and populous
regions of Ontario struggle, the
province and the country will be unable
to meet their full economic potential.”
Subsequently, poor net job creation rates in Ontario
BEN EISEN STEVE LAFLEUR
(outside Toronto and Ottawa) is an important story not
only for the provincial economy, but for the national Ben Eisen is a senior fellow and author of Uneven
Recovery: Job Creation in Ontario’s Urban Centres
economy. As long as large and populous regions of
between 2008 and 2018. Steve Lafleur is a senior policy
Ontario struggle, the province and the country will be analyst at the Fraser Institute.
unable to meet their full economic potential.
Spring 2020 11FRASER
INSTITUTE NEW RESEARCH
INFOGRAPHIC
Comparing the Wages and Benefits
of Workers in the Government and
Private Sectors
Milagros Palacios, Nathaniel Li,
and Alex Whalen
Over the past few months, the Institute has
published a series of reports comparing the
compensation of government workers with their GOVERNMENT SECTOR PRIVATE SECTOR
private sector counterparts. The Institute has QUEBEC
GETS PAID
long been a leader in measuring the differences in
compensation between the two sectors to better
9.2% more
FOR SIMILAR
WORK
understand the drivers of government spending.
ONTARIO
GETS PAID
E ach of the reports published looked at the differ-
ence in both wages and benefits to better under-
stand differences in compensation between the govern-
10.3%
FOR SIMILAR
WORK
more
ment and private sectors. Using Statistics Canada 2018 ALBERTA
GETS PAID
data, analyses were completed for British Columbia,
Alberta, Ontario, Quebec, and Atlantic Canada (the 9.3%
FOR SIMILAR
more
WORK
small population size of the four Atlantic provinces
necessitated grouping them together for analytical BC
GETS PAID
reasons). Each analysis included government workers at
the federal, provincial, and local levels. 5.8% more
FOR SIMILAR
‘‘
WORK
Government employees enjoy
higher levels of compensation where government workers receive, on average, wages
in benefits such as pensions, job that are 11.9 percent higher than comparable workers
in the private sector receive. In Ontario, average wages
security, retirement age, and
for government workers was 10.3 percent more, while
absenteeism.” the gap was 9.3 percent in Alberta, 9.2 percent in
Quebec, and 5.8 percent in British Columbia. (This
wage premium accounts for differences between indi-
vidual workers in the two sectors such as age, gender,
A significant wage gap was observed across all the education, tenure, experience, and type of work, among
provinces studied. The gap is largest in Atlantic Canada, other characteristics.)
12 The Quarterly: News and information for supporters and friends of the Fraser InstituteCOMPARING NON-WAGE BENEFITS OF retirement age, and absenteeism. For example, govern-
GOVERNMENT AND THE PRIVATE SECTOR ment workers in Newfoundland & Labrador lead all prov-
inces with a retirement age 4.2 years lower than workers
Average age Rate (%) of in the private sector. Quebec government workers lead
of retirement pension coverage
Province in absenteeism, missing 6.5 more days per year than
Public Private Public Private those in the private sector. Quebec government-sector
Newfoundland & workers also lead in pension coverage (95.1 percent of
59.7 63.9 93.8 28.3
Labrador
them have pension coverage compared with 22 percent
P.E.I. 62.4 65.7 80.4 16.7 in the private sector). PEI has the highest rate of govern-
ment sector defined-benefit pensions at 97.9 percent,
Nova Scotia 61.1 64.0 91.7 22.4
thirty-six times higher than the private sector.
New Brunswick 61.3 63.6 91.9 22.8 The Institute did not publish wage comparisons
for Saskatchewan and Manitoba (due to resource
Quebec 60.5 63.5 95.1 22.0
constraints), however, non-wage data are available for
Ontario 61.8 63.8 82.7 24.6 all provinces and reveal a consistent gap between the
government and private sectors.
Alberta 62.8 64.5 70.2 20.3
The government-sector wage (and benefits) bill is a
Bristish Columbia 62.3 64.2 91.6 16.6
large expense for every government. At a time when
many of these governments are tackling debts and defi-
cits, the data suggest that compensation in the govern-
It is important to keep in mind that the wage gap
ment sector is out of line with that in the private sector.
mentioned above is after adjusting for variables. If the
Governments across the country would do well to pay
comparison doesn’t adjust for these variables, the wage
closer attention to this gap.
gap is as high as 40 percent between the government
and private sectors.
‘‘
The government-sector
wage and benefits bill is a large
expense for every government. At a
time when many of these governments
are tackling debts and deficits, the
data suggest that compensation in the
government sector is out of line with
that in the private sector.”
MILAGROS PALACIOS ALEX WHALEN NATHANIEL LI
Milagros Palacios is Associate Director in the Addington
Centre for Measurement, Nathaniel Li is an economist,
and Alex Whalen is a policy analyst at the Fraser Institute.
They are co-authors, with Steve Lafleur, of a series
But wages are just one component of total compen- of studies comparing government and private sector
sation. Government employees enjoy higher levels of compensation.
compensation in benefits such as pensions, job security,
Spring 2020 13FRASER
INSTITUTE NEW RESEARCH
INFOGRAPHIC
Catching up with Canada: A Prosperity
Agenda for Atlantic Canada
Ben Eisen, Milagros Palacios,
Fred McMahon, and Alex Whalen
Taken as a whole, Atlantic Canada is a lagging
economic region in Canada. But this has not
Catching Up with Canada
always been the case. The region has expe- A Prosperity Agenda for Atlantic Canada
rienced significant periods of prosperity and Ben Eisen, Milagros Palacios, Fred McMahon, and Alex Whalen
economic optimism. This history gives hope that
the region’s current status as a relatively weak
economic performer within Canada should not
necessarily be viewed as an intractable reality.
A recent study, Catching Up with Canada: A Pros-
perity Agenda for Atlantic Canada, begins by
recounting past moments of growth and optimism in
the Atlantic Region.
It then goes on to measure the size of the current “pros-
perity gap” between Atlantic Canada and the rest of the 2019
country across a broad range of economic indicators.
Key findings include:
• Gross Domestic Product per person in Atlantic country than Atlantic Canada for as long as Statistics
Canada today is just 83.5 percent of the average in Canada data on the metric exists.
the rest of Canada, a difference of $9,773 per person.
The “prosperity gap” is large—but it may not be intract-
• Atlantic Canada’s unemployment rate has able. The paper outlines options for policy reform drawn
consistently been several points higher than in from proven real-world successes in other jurisdictions
the rest of the country. In 2018, for instance, the (with a special focus on Ireland and the US state of Mich-
unemployment rate in the region was 9.2 percent igan) that can help boost employment rates, productivity,
compared to 5.6 percent in the rest of Canada. and real per-capita GDP in the intermediate to long term.
• Employment rates are consistently higher in the rest
Further, the study calculates the rate of growth that
of Canada than in Atlantic Canada. In 2018, this gap
would be necessary for Atlantic Canada’s living stan-
was 6.3 percentage points.
dards to catch up with those in the rest of the country
• In 2017, the household income per person gap (measured as GDP per person) over 20 years. In short,
between the Atlantic provinces and the rest of it measures the growth rate that would be needed so
Canada was 10.3 percent. a child born in the region today would enter a regional
• Labour productivity as measured by real GDP per economy every bit as prosperous as the rest of Canada
worker has been consistently higher in the rest of the when he or she came of age.
14 The Quarterly: News and information for supporters and friends of the Fraser InstituteNo reason for Atlantic Canada to be poorer than the rest of Canada
9.2%
62.0 %
55.7%
5.6%
Atlantic
Atlantic
Canada
Canada
LB
RoC
RoC
Employment Rate Unemployment Rate
NF
$
59,243 $
48,801
$
44,237
$
49,469 PEI
NB
Rest of Canada
Rest of Canada
NS
Atlantic
Atlantic
Canada
Canada
GDP per Capita Household Income
per Capita
‘‘
Global evidence suggests country. However, the outcome will be significantly influ-
enced by the extent to which the general public supports
rapid convergence by struggling a pro-growth agenda and puts pressure on policymakers
regions is possible if they embrace to do the same. Global evidence suggests rapid conver-
gence by struggling regions is possible if they embrace a
a consistently pro-growth policy
consistently pro-growth policy framework.
framework.”
Private forecasters predict long-run nation-wide GDP
inflation-adjusted per-person growth of approximately
0.7 percent in the decades to come. If those forecasts
come to pass, the study shows that Atlantic Canada’s real
per capita GDP would need to increase by 1.6 percent
BEN EISEN MILAGROS PALACIOS FRED McMAHON
over the next 20 years in order for its economy to fully
converge with the rest of Canada’s. The study draws on
Ben Eisen is a Senior Fellow, Milagros
the experiences of other fast-growing jurisdictions, and Palacios is Associate Director in the
on international macroeconomic literature to support Addington Centre for Measurement,
the view that this target is plausible—particularly if the Fred McMahon is a resident fellow and
holder of the Dr. Michael A. Walker
region adopts pro-growth policy strategies such as have Chair in Economic Freedom, and Alex
been adopted in jurisdictions like Ireland and Michigan. Whalen is a policy analyst at the Fraser
Institute. They are the co-authors of
Clearly, forces outside the control of policymakers will the study Catching Up with Canada: A
ALEX WHALEN Prosperity Agenda for Atlantic Canada.
help determine whether living standards in Atlantic
Canada fully converge with those in the rest of the
Spring 2020 15FRASER
INSTITUTE RECENT COLUMNS APPEARED IN
THE WINNIPEG FREE PRESS
REUTERS / Reuters Photographer – stock.adobe.com
Trudeau Government Rejects
Almost Every Principle of Historic
1995 Chrétien Budget
Jason Clemens and Niels Veldhuis
February 2020 is the 25th anniversary of the
1995 federal budget, the most important and
historic in at least a half century. Not only did the
T he first and most obvious difference is the two
governments’ approach to deficits (or the willing-
ness to borrow money to finance spending today that
1995 budget solve a three-decade long problem exceeds available revenues). As the book End of the
of overspending that led to large and increasing Chrétien Consensus? details, the Chrétien government
took decisive action to eliminate a near $40 billion
deficits and debt, but it also reformed federal-
deficit when it took office.
provincial relations for the better and laid the
foundation for tax relief that strengthened Cana- In contrast, the Trudeau government purposefully went
dian competitiveness and improved economic into deficit to finance increased spending. While initially
performance. As we celebrate the enormity of promising to run deficits for just three years totaling
the Chrétien government’s achievements, it’s $25.1 billion, the Trudeau government ended up running
deficits estimated at $77.0 billion with no end in sight.
worth considering how the current govern-
ment has rejected almost every principle of the Moreover, as one chapter in a recent study, The Budget
1995 budget. that Changed Canada: Essays on the 25th Anniversary
16 The Quarterly: News and information for supporters and friends of the Fraser Instituteof the 1995 Budget explains, the Chrétien government the personal income tax rate imposed on entrepreneurs,
imposed a comparatively strict fiscal rule on itself— business owners, and professionals from 29 percent
continue to balance the budget and pay down the to 33 percent. And while it has lowered the personal
national debt, which meant running surpluses each year. income tax rate for middle-income earners, it has simul-
This enabled it to reduce the national debt (specifically, taneously eliminated a host of tax credits, which has
the accumulated deficit) from $562.8 billion in 1996-97 resulted in personal income taxes being higher for 81
to $481.5 billion in 2005-06 when the Liberals were percent of middle-income families.
unseated by the Tories.
‘‘
The government (along with the nine participating
provinces) also increased the Canada Pension Plan tax.
The current Liberal government All told, once the CPP tax increase is fully implemented,
98.8 percent of middle-income families will experience
… has increased the personal
a tax increase.
income tax rate imposed on
Unlike the Chrétien government and the 1995 budget,
entrepreneurs, business owners, and
which empowered the provinces through decentraliza-
professionals from 29 percent to tion and led to generally improved federal-provincial
33 percent.” relations, the Trudeau government has favoured a much
more centralized muscular approach to federal-provincial
relations, leading to increasing strains.
The enormous successes of the 1995 budget should
The Trudeau government, on the other hand, has imposed inform Canadians and policymakers about the benefits
a much weaker rule on itself—lowering the level of debt of sound fiscal policies—balanced budgets, lower debt,
compared to the size of the economy. This weaker prioritized spending, and lower taxes to ensure compet-
rule allows the government to continue borrowing and
itiveness. The 25th anniversary of the ’95 budget gives
increasing the debt so long as it increases at a rate less
the current federal government an opportunity to genu-
than the economy is growing. This has resulted in the
inely reflect on its successes—and its own markedly
national debt increasing from $628.9 billion the year
different approach.
before the Trudeau government took office to an esti-
mated $713.2 billion this year (2019-20).
And it’s not even clear the degree to which the govern-
ment will actually hold itself to this rule since between
2018 and 2019 the debt-to-the-economy ratio increased
in violation of the rule.
Another key difference between the 1995 budget and
today’s budgets are taxes. As the Liberals explained then,
tax cuts should only be considered when the budget is
balanced otherwise taxes are simply being deferred to
the future. In addition, the Liberals then were committed
JASON CLEMENS NIELS VELDHUIS
to tax relief that improved the country’s competitive-
ness and the “incentives for Canadians to learn, work, Jason Clemens is Executive Vice-President and
save and invest.” This led to major personal income tax Niels Veldhuis is President of the Fraser Institute.
They are co-authors, with Milagros Palacios and
reductions as well as cuts to the capital gains tax. Matthew Lau, of End of the Chrétien Consensus?
They are also contributors to the recent The Budget
In contrast to the 1995 budget and its own rhetoric, that Changed Canada: Essays on the 25th Anniversary
the current Liberal government has increased personal of the 1995 Budget.
income, payroll, and capital gains taxes. It has increased
Spring 2020 17FRASER
INSTITUTE RECENT COLUMNS APPEARED IN
THE FINANCIAL POST
Focus on Economic Growth—
Not Redistribution through
Tax Hikes on the Rich
Philip Cross
Two of the most misleading myths about recent earners in Canada have long been the only group whose
economic trends in Canada are that the distribu- share of taxes paid is greater than its share of income.
tion of income is becoming more skewed to “the Over the past two decades it has paid more than half of
rich” and that these same “rich” largely avoid all income taxes, including fully 54.1 percent in 2017.
paying taxes. In fact, as I show in the recent Fraser The tax burden on the top decile increased noticeably
Institute study, Should Upper-Income Canadians during the debt crisis of the 1990s. More recently, the
Pay More Income Tax? the top decile’s share of top decile has been asked to pay more in part to finance
income declined between 2007 and 2017, from 36.1 lower- and middle-class tax cuts and credits designed to
percent to 34.2 percent. This top tenth of earners counter the effect of years with little or no income growth
includes anyone earning $96,000 or more as of for average Canadians. But marginal tax rates above 50
2017, a threshold few would regard as anything percent have not generated substantially higher revenues
other than middle class. for governments, which means middle-class tax cuts
have been financed largely by rising government debt.
D uring NDP Leader Jagmeet Singh’s concession It’s hardly surprising that people resist tax rates above 50
speech on election night, his supporters chanted percent, a level beyond which even former NDP Leader
“Tax the rich!”—as if somehow “the rich,” however defined, Thomas Mulcair said, “you’re not talking taxation, you’re
are not paying taxes. In fact, the top 10 percent of income talking confiscation.”
18 The Quarterly: News and information for supporters and friends of the Fraser InstituteOne reason for the shift in the tax burden to upper- Unfortunately, as the Cato Institute’s Alan Reynolds has
income families has been the widespread misconception put it, “the growth and inequality of incomes are topics
that they are prospering while everyone else stagnates. that seem to inspire many people to form very strong
This is the modern variant of the 19th-century critique of opinions about very weak statistics.” The way the rich-
capitalism that “the rich get richer, the poor get poorer.” poor divide is usually talked about creates the wrong
But, as mentioned, the share of income going to the top impression that the same people occupy the same rela-
decile has actually fallen over the past decade. tive points in the income distribution over time—that a
‘‘
distinct group of “rich” people reaps above-average
incomes year after year. That’s just wrong. The truth is
Marginal tax rates above that people move—a lot—from group to group over time.
In this country, for example, 36.1 percent of people in the
50 percent have not generated
top decile in 2017 were not in the top decile five years
substantially higher revenues for earlier. Just over half of people in the top five percent in
governments, which means middle-class 2017 had experienced at least one year in the previous
five when they were not in that group.
tax cuts have been financed largely by
‘‘
rising government debt.”
When the economic pie stops
growing, different groups in
society conclude that lobbying for a
Average incomes have lagged, not because the top decile
is consuming a larger share of incomes, but because GDP larger slice is the only way to raise their
growth has slowed. If per-capita income growth after disposable income.”
2000 had been sustained at 2.5 percent a year instead
of the 0.9 percent actually recorded, real incomes in
Canada would be one-third higher today, the equivalent
of $18,498 more for every person. That is considerably Policymakers and researchers should focus on higher
more than recent increases in government transfers to economic growth, not increasing taxes on small slices of
the average Canadian. the population. Canada should focus on boosting growth
by stimulating investment, improving our trade competi-
The fact that Canada has bucked the trend of rising
tiveness, opening large sectors of our economy that are
upper-incomes seen in most industrialized countries has
still sheltered from international competition, lowering
largely gone unnoticed, even at home, as anti-inequality
the cost of energy, and reducing the tax burden.
rhetoric imported from the U.S. and Europe has driven
public discourse. The result has been an increasing
focus on the distribution of income and taxes. When the
economic pie stops growing, different groups in society
conclude that lobbying for a larger slice is the only way
to raise their disposable income.
The danger is that prioritizing redistribution reinforces
the trend to slow growth. Robert Lucas, 1995 Nobel
Philip Cross is a former Chief
Prize winner in economics and one of the most influ- Economic Analyst for Statistics
ential macroeconomists of his generation, declared in Canada and a Fraser Institute
Senior Fellow. He is the author of
2004 that “of the tendencies that are harmful to sound Should Upper-Income Canadians
PHILIP CROSS Pay More Income Tax?
economics, the most seductive, and in my opinion the
most poisonous, is to focus on questions of distribution.”
Spring 2020 19FRASER
INSTITUTE RECENT COLUMNS APPEARED IN
THE GLOBE AND MAIL
Carney’s Climate Plans May Push Oil
and Gas Production from Canada to
State-Owned Firms Abroad
Bank of England Flickr photo
Elmira Aliakbari and Ashley Stedman
Soon, former Bank of Canada governor Mark It’s first important to understand what Carney generally
Carney will join the United Nations as a special intends to do with his new position. Carney (and others)
envoy on climate change and finance, where he want to use international financial regulations to make it
‘‘
will push financial institutions and banks to adopt
new measures that account for climate risk. In
a recent interview Carney stated, “Financial If financial institutions and banks
services have been too slow to cut investment are squeezed by climate risk
in fossil fuels, a delay that could lead to a sharp regulations, private energy companies
increase in global temperatures.”
will find it harder to secure external
A nd while the details of Carney’s vision are still vague,
the new financial regulations will likely have a
disproportionate impact on private fossil fuel compa-
financing, which will likely result in less
investment and production in the future.”
nies over state-owned entities.
20 The Quarterly: News and information for supporters and friends of the Fraser Institutemore difficult (i.e., more costly) for financial institutions have a distinct advantage over private energy firms in
to invest in and lend to traditional energy companies. Canada and countries that adopt climate financing.
This is a backdoor way to divert investment dollars away
As a result of this disproportionate negative impact on
from traditional energy and into other sectors.
private energy firms, and given the rising global demand
The result? Future oil and gas production will likely be for oil and gas, future oil and gas production will likely
restrained in countries that rely on the private sector for shift away from countries dominated by private energy
financing (such as Canada and the United States), while firms to countries with large state-owned enterprises.
expanding in countries where government provides the
Such a production shift would likely undermine the
financing (such as Mexico and Venezuela).
intended purpose of climate financing, which is to
‘‘
reduce investment in fossil fuels.
State-owned energy companies, And so long as the demand for energy continues to
able to use government funds to increase, there will continue to be investment opportu-
nities in regions able to access capital and build new
circumvent financial market mechanisms
projects. As conversations about climate financing ramp
that account for climate risk, will likely up, fuelled by Carney and many others, state-owned
have a distinct advantage over private firms may rise to meet global oil and gas demand at the
expense of private firms in Canada and the U.S. That
energy firms in Canada and countries
should be a major concern for policymakers.
that adopt climate financing.”
The energy industry in some countries—again, including
Canada and the US—is largely in the private sector.
To get external financing, privately owned companies
access capital markets through financial intermediaries
to secure equity or debt financing. However, if financial
institutions and banks are squeezed by climate risk
regulations, private energy companies will find it harder
to secure external financing, which will likely result in
less investment and production in the future.
Meanwhile, state-owned oil and gas companies such
as PEMEX in Mexico and Petroleos de Venezuela SA
(PDVSA) in Venezuela will have another option to
access capital—funding from the state itself. Govern-
ments can provide direct investment funding to these
companies to boost production. For example, last year
the Mexican government provided PEMEX with a $5
billion capital injection. In fact, according to Reuters,
the Mexican government has acted as “an implicit
ELMIRA ALIAKBARI ASHLEY STEDMAN
guarantor for the company.”
Elmira Aliakbari is Associate Director of Natural
Consequently, state-owned energy companies, able to Resource Studies and Ashley Stedman is a Senior Policy
use government funds to circumvent financial market Analyst at the Fraser Institute.
mechanisms that account for climate risk, will likely
Spring 2020 21You can also read