TSX: FNV | NYSE: FNV - Corporate Presentation - Franco ...
←
→
Page content transcription
If your browser does not render page correctly, please read the page content below
TSX: FNV | NYSE: FNV

  CORPORATE PRESENTATION
  FEBRUARY 2021
Corporate Presentation
March 2021
Cautionary Statement
   Forward Looking Statements

   This presentation contains “forward looking information” and “forward looking statements” within the meaning of applicable Canadian securities laws and the United States Private Securities Litigation Reform Act of 1995, respectively, which may include, but are not limited to, statements with respect
   to future events or future performance, management’s expectations regarding Franco-Nevada’s growth, results of operations, estimated future revenues, carrying value of assets, future dividends and requirements for additional capital, mineral reserve and mineral resource estimates, production
   estimates, production costs and revenue, future demand for and prices of commodities, expected mining sequences, business prospects and opportunities, audits being conducted by the Canada Revenue Agency (“CRA”), the expected exposure for current and future assessments and available
   remedies, the remedies relating to and consequences of the ruling of the Supreme Court of Panama in relation to the Cobre Panama project, the aggregated value of common shares which may be issued pursuant to the Company’s at-the-market equity (“ATM”) program, and the Company’s expected
   use of the net proceeds of the ATM program, if any. In addition, statements (including data in tables) relating to reserves and resources and gold equivalent ounces are forward looking statements, as they involve implied assessment, based on certain estimates and assumptions, and no assurance can
   be given that the estimates and assumptions are accurate and that such reserves and resources and gold equivalent ounces will be realized. Such forward looking statements reflect management’s current beliefs and are based on information currently available to management. Often, but not always,
   forward looking statements can be identified by the use of words such as “plans”, “expects”, “is expected”, “budgets”, “scheduled”, “estimates”, “forecasts”, “predicts”, “projects”, “intends”, “targets”, “aims”, “anticipates” or “believes” or variations (including negative variations) of such words
   and phrases or may be identified by statements to the effect that certain actions “may”, “could”, “should”, “would”, “might” or “will” be taken, occur or be achieved. Forward looking statements involve known and unknown risks, uncertainties and other factors, which may cause the actual results,
   performance or achievements of Franco-Nevada to be materially different from any future results, performance or achievements expressed or implied by the forward looking statements. A number of factors could cause actual events or results to differ materially from any forward looking statement,
   including, without limitation: the price at which common shares are sold in the ATM program and the aggregate net proceeds received by the Company as a result of the ATM program; fluctuations in the prices of the primary commodities that drive royalty and stream revenue (gold, platinum group
   metals, copper, nickel, uranium, silver, iron-ore and oil and gas); fluctuations in the value of the Canadian, Australian dollar and Mexican Peso and any other currency in which revenue is generated, relative to the U.S. dollar; changes in national and local government legislation, including permitting and
   licensing regimes and taxation policies, and the enforcement thereof; regulatory, political or economic developments in any of the countries where properties in which Franco-Nevada holds a royalty, stream or other interest are located or through which they are held; risks related to the operators of
   the properties in which Franco-Nevada holds a royalty, stream or other interest, including changes in the ownership and control of such operators; influence of macroeconomic developments; business opportunities that become available to, or are pursued by Franco-Nevada; reduced access to debt
   and equity capital; litigation; title, permit or license disputes related to interests on any of the properties in which Franco-Nevada holds a royalty, stream or other interest; whether or not Franco-Nevada is determined to have “passive foreign investment company” (“PFIC”) status as defined in Section
   1297 of the United States Internal Revenue Code of 1986, as amended; potential changes in Canadian tax treatment of offshore streams; excessive cost escalation as well as development, permitting, infrastructure, operating or technical difficulties on any of the properties in which Franco-Nevada
   holds a royalty, stream or other interest; access to sufficient pipeline capacity; actual mineral content may differ from the reserves and resources contained in technical reports; rate and timing of production differences from resource estimates, other technical reports and mine plans; risks and hazards
   associated with the business of development and mining on any of the properties in which Franco-Nevada holds a royalty, stream or other interest, including, but not limited to unusual or unexpected geological and metallurgical conditions, slope failures or cave-ins, flooding and other natural disasters,
   terrorism, civil unrest or an outbreak of contagious disease; the impact of the COVID-19 (coronavirus) pandemic; and the integration of acquired assets. The forward looking statements contained in this presentation are based upon assumptions management believes to be reasonable, including,
   without limitation: the ongoing operation of the properties in which Franco-Nevada holds a royalty, stream or other interest by the owners or operators of such properties in a manner consistent with past practice; the accuracy of public statements and disclosures made by the owners or operators of
   such underlying properties; no material adverse change in the market price of the commodities that underlie the asset portfolio; Franco-Nevada’s ongoing income and assets relating to determination of its PFIC status; no material changes to existing tax treatment; the expected application of tax laws
   and regulations by taxation authorities; the expected assessment and outcome of any audit by any taxation authority; no adverse development in respect of any significant property in which Franco-Nevada holds a royalty, stream or other interest; the accuracy of publicly disclosed expectations for the
   development of underlying properties that are not yet in production; integration of acquired assets; and the absence of any other factors that could cause actions, events or results to differ from those anticipated, estimated or intended. However, there can be no assurance that forward looking
   statements will prove to be accurate, as actual results and future events could differ materially from those anticipated in such statements and investors are cautioned that forward looking statements are not guarantees of future performance. In addition, there can be no assurance as to the outcome of
   the ongoing audits by the CRA or the Company’s exposure as a result thereof. Franco-Nevada cannot assure investors that actual results will be consistent with these forward looking statements and investors should not place undue reliance on forward looking statements due to the inherent
   uncertainty therein.

   For additional information with respect to risks, uncertainties and assumptions, please refer to the “Risk Factors” section of Franco-Nevada’s most recent Annual Information Form filed with the Canadian securities regulatory authorities on www.sedar.com and Franco-Nevada’s most recent Annual
   Report filed on Form 40-F filed with the SEC on www.sec.gov. The forward-looking statements herein are made as of the date herein only and Franco-Nevada does not assume any obligation to update or revise them to reflect new information, estimates or opinions, future events or results or otherwise,
   except as required by applicable law.

   Non-IFRS Measures

   Cash Costs, Adjusted Net Income, Adjusted EBITDA and Margin are intended to provide additional information only and should not be considered in isolation or as a substitute for measures of performance prepared in accordance with International Financial Reporting Standards (“IFRS”). They do not
   have any standardized meaning under IFRS, and may not be comparable to similar measures presented by other issuers. Management uses these measures to evaluate the underlying operating performance of the Company as a whole for the reporting periods presented, to assist with the planning and
   forecasting of future operating results, and to supplement information in its financial statements. The Company also uses Margin in its annual incentive compensation process to evaluate management’s performance in increasing revenue and containing costs. Management believes that in addition to
   measures prepared in accordance with IFRS such as Net Income and Earnings per Share (“EPS”), our investors and analysts use these measures to evaluate the results of the underlying business of the Company, particularly since the excluded items are typically not included in guidance. While the
   adjustments to Net Income and EPS include items that are both recurring and non-recurring, management believes these measures are useful measures of the Company’s performance because they adjust for items which may not relate to or have a disproportionate effect on the period in which they
   are recognized, impact the comparability of our core operating results from period to period, are not always reflective of the underlying operating performance of our business, and/or are not necessarily indicative of future operating results. For a reconciliation of these measures to various IFRS
   measures, please see the end of this presentation or the Company’s most recent Management’s Discussion and Analysis filed with the Canadian securities regulatory authorities on www.sedar.com and with the SEC on www.sec.gov.

   This presentation does not constitute an offer to sell or a solicitation of an offer to purchase any security in any jurisdiction.

TSX: FNV | NYSE: FNV                                                                                                                                                                                                                                                                                         2
The Gold Investment That Works

                                                       Compounded Average Annual Total Returns Since FNV Inception1, 3, 4

Leading gold
focused streaming
and royalty company

NYSE and TSX listed

~$21 B market cap.2

Held by Fidelity,
BlackRock, Capital
World, MFS

                                 1.   FNV Inception – December 20, 2007
                                 2.   As at February 28, 2021
                                 3.   Compounded annual total returns to February 28, 2021
                                 4.   Source: TD Securities; Bloomberg

TSX: FNV | NYSE: FNV                                                                                                        3
The Gold Investment That Works
  Our Approach:

  Shareholders                          Operators                             Community
  Lower-risk gold investment to hedge   Long term alignment and financial     High governance standards, diversity,
  against market instability            flexibility                           responsible mining and contributing to
                                                                              social licence

                       Business          Portfolio                 Track Record                   Growth
                        Model

TSX: FNV | NYSE: FNV                                                                                                   4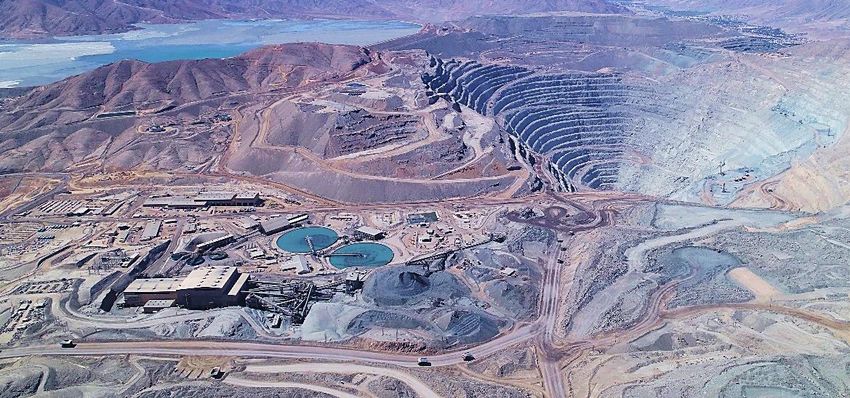
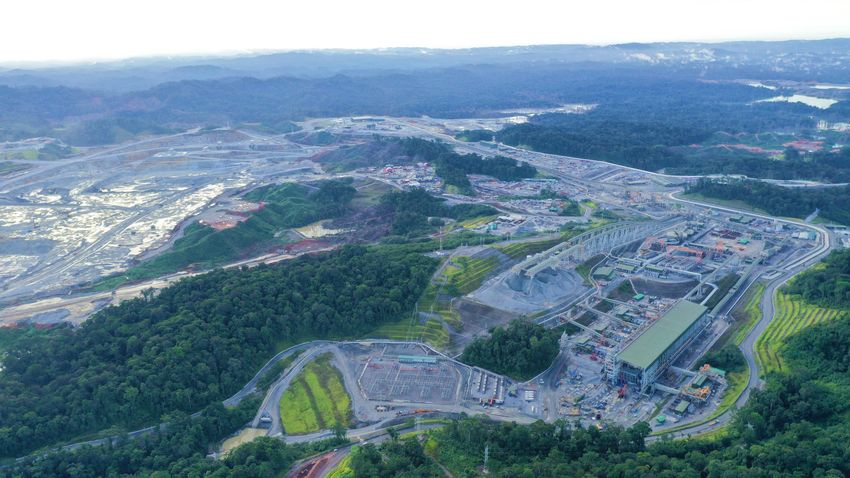
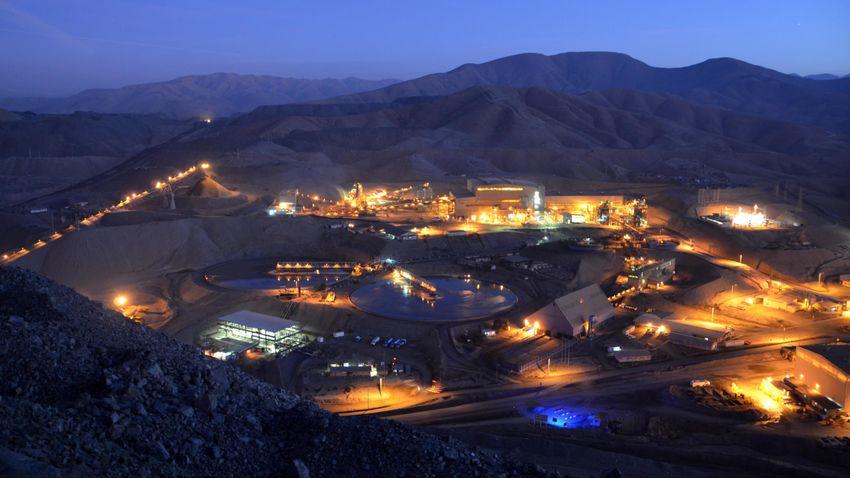
Business Model   Antapaccay

TSX: FNV | NYSE: FNV                 5
Proven Business Model
                                                          Maximize

Long-Term Optionality

FNV does not operate, develop or
explore for mines. Instead it has a broad   Exploration    Security of     Focus on
portfolio of royalties and streams on         Upside        Tenure           New
many operations allowing it to:                                          Investments
                                                                                                  Minimize

                                                                                         Cost        Margin       Involvement
                                                                                       Exposure   Encroachment   in Operations

TSX: FNV | NYSE: FNV                                                                                                             6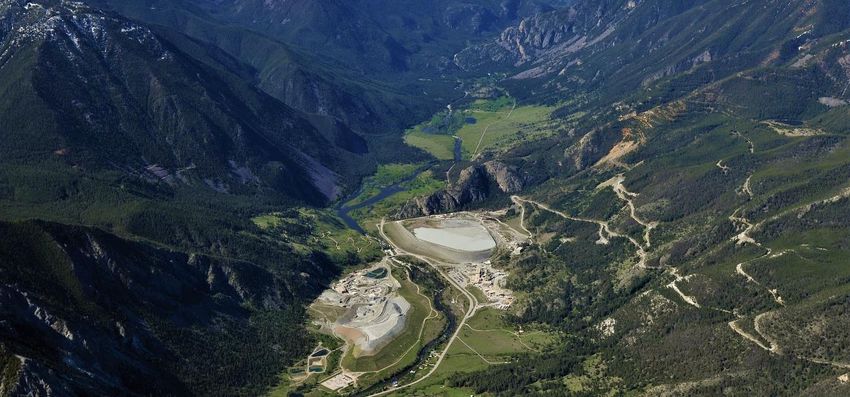
Why We Are Different

                                                Shareholder Alignment
                                                .
                                                Share ownership
                                                .

            Streams and Royalties               Low G&A                 Cyclical Investing
            .
            Stable long-life streams and gold                           Board experience investing in cyclical
            royalty optionality                                         markets
                                                                        .
                                                                        Focus on gold. Add other resource
                                                                        optionality opportunistically

        Asset Selection
        .
        Board/management technical skills
        .                                                               Financial Flexibility
        Focus on exploration optionality                                .
        .                                                               Maximize capital available for industry
        Ensure good tenure                                              downturns

TSX: FNV | NYSE: FNV                                                                                              7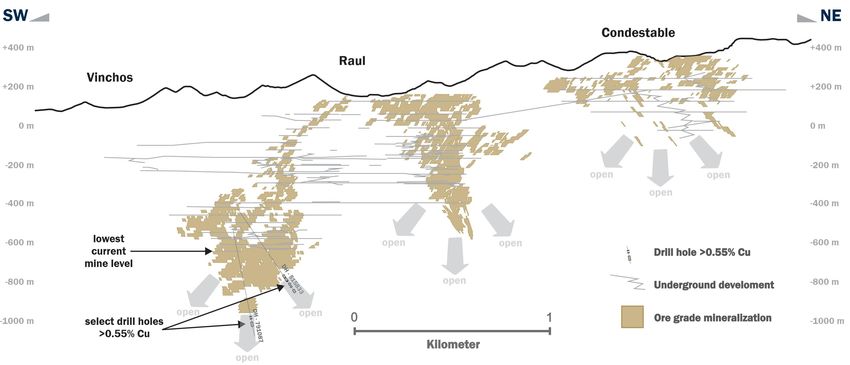
ESG Rankings and Commitments

Top ESG Rankings

     Ranked #1 by Sustainalytics      In 2020, Franco-Nevada          Rated “Prime” by ISS ESG        Ranked #2 among mining
     out of 84 gold companies         received an MSCI ESG Rating     in August 2020                  companies in Canada in the
                                      of “AA”                                                         Globe and Mail’s
                                                                                                      2020 Board Games
Our Commitments

     UN Global Compact Participant    Member of World Gold Council    BlackNorth Initiative           Board and Sr. Management
                                                                                                      Diversity
     Signatory to UN Global Compact   Committed to Responsible Gold   Signatory to BlackNorth
                                      Mining Principles               Initiative pledge to address    Goal of 40% diverse
                                                                      and alleviate systemic racism   representation by 2025

TSX: FNV | NYSE: FNV                                                                                                               8
Diversity and Contributions

Gender & Racial Diversity1                        Diversity Initiatives

     Independent Directors    Senior Management
     Women Directors         Visible Minorities
                                                                          Patron Sponsor       Franco-Nevada Diversity

         33%                    36%                                       Prosperity Project   Scholarship Program

                                                  Community Funding
         All Employees          All Employees
 Women Employees             Visible Minorities

         49%                    40%
1.    As at March 2021

TSX: FNV | NYSE: FNV                                                                                                     9
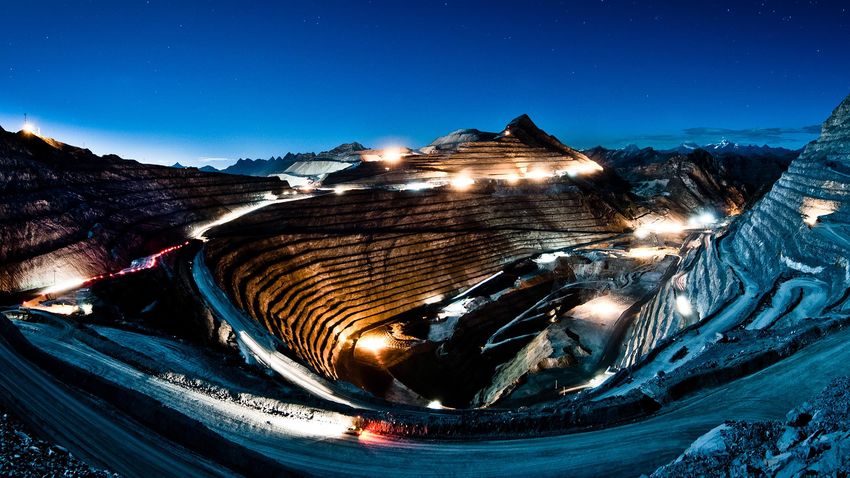
Asset Portfolio Cobre Panama
Brucejack

                                  Weyburn               Hemlo
                                                                 Detour Lake

                               Stillwater                           Kirkland Lake
                                                                                          Diversified Portfolio
                                                   Sudbury
           Goldstrike
                      Gold Quarry                                   Marcellus
        Bald Mountain                     SCOOP/STACK

                                    Permian        Haynesville
                                                                                           400 Assets
                                  Guadalupe                                                Covering 44,000 km2
                                                                                                                           Tasiast

                                                                                                                            Sabodala

Gold & Gold                                                         Cobre Panama
                                                                                                                                       Subika

Equivalents              Energy

   318                     82
     TOTAL                  TOTAL                                       Antamina
                                                                         Condestable
       54                    55                                              Antapaccay
   Producing              Producing1
                                                                                                                 Duketon
       41                    27
                                                                                                                                                             MWS
   Advanced              Exploration2                              Candelaria

      223
   Exploration2
                                                                                                                                                1. 9 producing Energy assets shown
                  (As at March 9, 2021)                                                                                                         2. Exploration assets not shown

 TSX: FNV | NYSE: FNV                                                                                                                                                     11
Core Assets Outperforming
Antamina Cobre Panama
$610M investment $1.36B investment
2020 revenue: $57M 2020 revenue: $135M
Mine life potential1: 30+ years Mine life potential1: 35+ years
Silver production has exceeded Expanding to 100Mtpa in 20234
expectations2
Candelaria
$655M investment
Antapaccay
$500M investment 2020 revenue: $107M
Mine life potential1 : 25+ years
2020 revenue: $119M UG exploration success has expanded mine
Mine life potential1 : 30+ years life5
Coroccohuayco deposit to extend mine life3
1. Mine life potential includes Franco-Nevada assessment of resource conversion potential. Also 2. Based on FNV sales from inception of stream through Q3 2020 vs. acquisition guidance
assumes current or operator forecasted production rates. Antamina potential assumes 3. Operator now contemplating an open pit only scenario with a later start date
additional tailings capacity is permitted. Antapaccay potential assumes Coroccohuayco 4. Design throughput was originally 58Mtpa
project developed. 5. Mine life was 14 years in Technical Report July 28, 2014
TSX: FNV | NYSE: FNV 12Long Life Assets
Reserve Life
2014
Long duration portfolio Franco-Nevada
increases optionality 2019
Long-term cash flow
2014
generation Sr. Gold Producers
2019
2014
Int. Gold Producers
2019
Years
0 2 4 6 8 10 12 14 16 18 20
Source: Bank of America Merrill Lynch North American Precious
Metals Weekly (March 27, 2017 and July 8, 2019)
Senior Gold Producers: Agnico Eagle, Barrick, Goldcorp, Kinross,
Newmont
Intermediate Gold Producers: Alamos Gold, Centerra, IAMGOLD,
New Gold, Yamana
TSX: FNV | NYSE: FNV 13BUSINESS MODEL
Exploration Optionality
2007 2008 - 2019 2019
Gold ounces1at Gold ounces1 of same assets
time of IPO as reported Dec. 2019
90
+114%
80
Proven & Probable Reserves2 (Moz)
70
60
Reserves increased >37 Moz produced
more than 3x over 12 50
years
40
30
20
>$1.4B2 revenue to
10 FNV from portfolio
0
IPO Reserves increase at no
$1.2B paid for portfolio cost
1. Total ounces associated with top 37 assets at IPO. Total ounces are not the same as FNV Royalty Ounces. Refer to 2020 Asset Handbook at www.franco-nevada.com.
Mineral Resources are exclusive of Mineral Reserves. Includes estimates of Mineral Reserves & Resources made under JORC code and SAMREC code.
2. Revenue from original FNV portfolio includes gold, platinum and palladium revenue.
TSX: FNV | NYSE: FNV 14Track Record Candelaria TSX: FNV | NYSE: FNV 15
Track Record

                                                                        9 months
                                                            9 months

                                                                       9 months
                                                            9 months
1. Please see notes on Appendix slide – Non-IFRS Measures
2. 2020 data as of December 31, 2020

  TSX: FNV | NYSE: FNV                                                             16
Increasing Profitability 2020 EBITDA Margin of 82% and Adjusted Net Income Margin of 51% TSX: FNV | NYSE: FNV 17
Progressive & Sustainable Dividends

                                                                                                    $200                               Quarterly Dividend Increased to
                                                                                                                                       $0.30 per share
                                                                                                    $180

                                                                                                                                       Effective with Q2 2021 dividend
                                                                                                    $160
                                                                                                                                       payment1

                                                                                                           US $ (Millions) per annum
                                                                                                    $140

                                                                                                                                       Will be the 14th annual dividend
                                                                                                                                       increase
                                                                                                    $120

                                                                                                    $100
                                                                                                                                       Indicative 2021 Dividends of $222M2
                                                                                                    $80

                                                                                                    $60
                                                                                                                                       ~$1.5B paid since IPO3

                                                                                                    $40                                IPO investors now realizing
                                                                                                                                       7.9% yield (U.S.)4
                                                                                                    $20
                                                                                                                                       10.0% yield (CDN)4
                                                                                                    $0                                 1.   Formal declaration planned for May 2021 with payment by the
    2008      2009     2010   2011   2012   2013   2014   2015   2016   2017   2018   2019   2020                                           end of June 2021
                                                                                                                                       2.   Assumes current share count is maintained and announced
                                                                                                                                            dividend increase in June 2021
                                                                                                                                       3.   Includes DRIP and March 2021 declared dividend
                                                                                                                                       4.   As at June 2021 dividend record date

TSX: FNV | NYSE: FNV                                                                                                                                                                                      18
Outperforming in Bull and Bear Markets 1. Source: TD Securities; Bloomberg 2. All returns are in US$ as of February 28, 2021 3. Total return assumes reinvestment of dividends over designated period TSX: FNV | NYSE: FNV 19
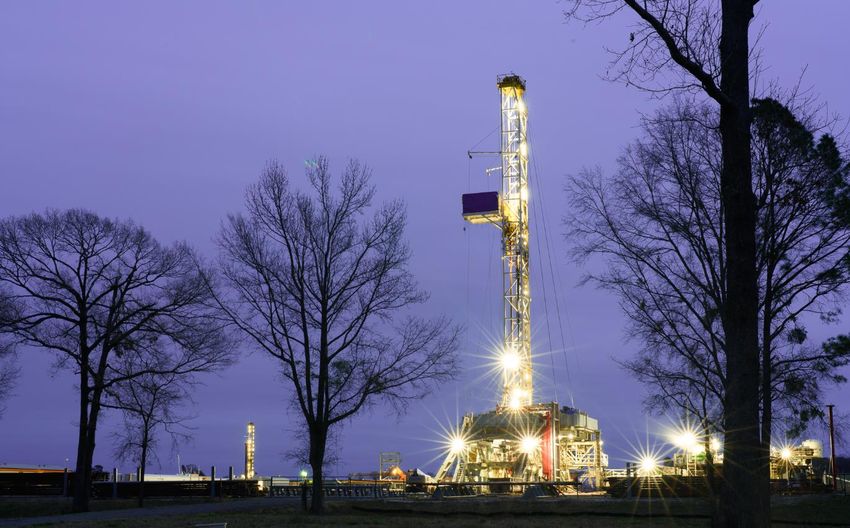
Growth Outlook   Antamina

TSX: FNV | NYSE: FNV              20
Guidance
                       2021                                                    2025

                       555,000-585,000                                         600,000-630,000
       GEOs

                       + Cobre Panama GEO deliveries continue to ramp up       + New mines – Hardrock, Salares Norte, Stibnite Gold, Valentine Lake
                       + Antamina, Candelaria                                  + Sudbury still producing
                       + Condestable new addition                              - MWS – cap met in 2024
                       - Smaller Karma variable deliveries
                       - Hemlo, Sudbury – reduced production

                       2021                                                    2025
    Revenue
     Energy

                       $115-$135 million                                       $150-$170 million
                       + Higher commodity prices                               + Continental capital commitment fully funded
                       + Contribution from Haynesville Royalty                 + Assumes rebound to 80% of 2019 US drilling levels by 2025
                       - Limited growth in US drilling activity

                       2021 Depletion                                          2022-2025 Funding Commitments
                       Estimate $250-$280 million (was $241 million in 2020)   $54-$64 million Continental partnership funding

                       2021 Funding Commitments
                       $165 million Condestable Acquisition
                       $50-$60 million Continental partnership funding
                       $50 million Solgold option to upsize Alpala royalty

                                                                                                        Assuming: $1,750/oz Au; $25.00/oz Ag; $1,100/oz Pt; $2,200/oz Pd
                                                                                                        Assuming $55/bbl WTI, $2.50/mcf NYMEX

TSX: FNV | NYSE: FNV                                                                                                                                                       21
Core Asset Contribution Higher contribution from Core Assets in 2021 Cobre Panama ramp-up through 2025 GEOs for the years 2019 and 2020 represent actuals. GEOs for the year 2021 and 2025 represent midpoint of the guidance issued in March 2021. TSX: FNV | NYSE: FNV 22
Growth Drivers

              Asset Expansions                     Period                     New Mines        Est. Start1
 Cobre Panama (Panama) ramp-up                     2021-2024   Salares Norte (Chile)              2023

 Stillwater (Montana) expansion                    2021-2024   Aphrodite (Australia)              2023

 Detour Lake (Ontario) expansion                   2021-2025   Bateman (Ontario)                  2024
                                                               Valentine Lake (Newfoundland)      2024
 Tasiast (Mauritania) 24k expansion                2021-2023
                                                               Hardrock (Ontario)                 2025
 Subika (Ghana) UG expansion                       2023-2025
                                                               Stibnite Gold (Idaho)              2025
 Macassa (Ontario) expansion                       2023-2025
                                                               Yandal/Bronzewing (Australia)      2025
 Island Gold (Ontario) expansion                   2024-2025

                Energy Growth
 SCOOP/STACK (USA)
 Permian Basin (Texas)
 Orion (Alberta) phase 2D expansion

                                                                     Stillwater
 1.   Estimated start based on operator guidance

TSX: FNV | NYSE: FNV                                                                                         23
Available Capital
Working Marketable Credit Available
Capital1, 2 Securities1 Facilities1, 3
Capital4
$610.5 M $191.8 M $1.1 B
$1.9 B
1.
2.
As at December 31, 2020
Please see notes on Appendix slide – Non-IFRS Measures
DEBT FREE
3. Facilities include $1B Corporate, $100M Barbados.
4. Funding commitments subsequent to December 31, 2020 will be funded with cash flow from operations
TSX: FNV | NYSE: FNV 24Condestable Precious Metals Stream
$165M Acquisition with Immediate Precious Metals Cash Flow
Proven operation with Condestable is an operating underground copper-gold-silver mine located 90 km south of
excellent potential for Lima at low elevation
expansions and mine life
extension (50+ year Mineral Resources of 151 Mt1
operating history) • M&I of 91 Mt @ 0.9% Cu, 0.24 g/t Au, 6.2 g/t Ag
Large, prospective land • Inferred of 61 Mt @ 0.9% Cu, 0.24 g/t Au, 6.3 g/t Ag
package (~45,000 ha)
Mine expansion from 7 ktpd to 8.4 ktpd expected by late 2021 with key equipment purchased
Low cost operation (2nd • Life of mine forecast
quartile Cu cash costs) average annual
production of 20-24 kt
Co-sponsorship of local Cu, 14-17 koz Au, and
ESG initiatives 400-500 koz Ag2
• +15 year mine life
potential at similar
1. Condestable internal global, in situ, Mineral Resource grades
2.
estimate as at 31/12/2020. 2020 Mineral Reserves pending
Produced metal in concentrate, excluding payability. High Condestable
end of the range assumes increased throughput and
additional permitting • Potential to increase
throughput to >10 ktpd Note: Technical and scientific information included herein re the Condestable Project was reviewed and approved by Phil Wilson,
C.Eng., Vice President, Technical of Franco-Nevada Corporation and a “Qualified Person” as defined in NI 43-101.
TSX: FNV | NYSE: FNV 25Resource Potential
Excellent Near Mine Potential in an Extensive IOCG Belt
IOCG Deposits in the Andes Cu Belt Condestable Stream Area (~45,000 ha)
TSX: FNV | NYSE: FNV 26Condestable Long Section
Significant Intersections Indicate Mineralization Open at Depth and Along Strike
Stream applies to all of Condestable,
Raul and Vinchos
TSX: FNV | NYSE: FNV 27Key Stream Terms
Exposure to Resource Optionality with the Benefit of Initial Fixed Deliveries
Delivery Schedule
Franco-Nevada (Barbados) Corporation funded the
$165M stream, which is effective from Variable Variable
Fixed Deliveries Phase 1 (2) Phase 2 (2)
January 1, 2021 (First 5 years) (After year ~10 (3) or
(Years 5-10) (3) delivery reduction)
The operator(1) is owned by Southern Peaks
Mining, a GNRI portfolio company Au Threshold
0 to 43.8 43.8 to 87.6 > 87.6
(Koz Au)
Proceeds will repay indebtedness, taxes and
complete expansion to 8.4 ktpd 2,190
Au Delivery 63% 25%
oz/quarter
Quarterly gold and silver deliveries are fixed for
five years, followed by a percentage of gold and Ag Threshold
0 to 1.45 1.45 to 2.91 > 2.91
silver in concentrate (Moz Ag)
Ability for the Seller to defer fixed deliveries for up 72,750
Ag Delivery 63% 25%
to 4 quarters with a penalty oz/quarter
Delivery reduction option for first 4 years, at the Ongoing Price 20% of spot Au/Ag price
Seller’s option, with a delivery of gold (valued at
$119M) which would trigger the immediate start of
the phase 2 variable deliveries (i.e. 25% of 1. Compañia Minera Condestable S.A. is 98.68% owned by Southern Peaks Mining and 1.32% by LS Nikko and others
2. Variable deliveries is based on 100% of produced metal in concentrate
produced precious metals) 3. Actual timing dependent on deliveries
TSX: FNV | NYSE: FNV 28Haynesville Royalty Acquisition
$135M Acquisition of Royalty Assets in Haynesville Shale
Secure tenure:
• ~2,740 net acres1 of mineral title in
NE Texas providing perpetual
ownership acquired from Mesa
Minerals Partners LLC
Attractive underlying economics:
• Strong well performance
• Proximity to U.S. Gulf Coast
Royalties assembled under partnership
between Mesa & Rockcliff Energy LLC:
• Sponsored by Quantum Energy
Partners
• Operator for ~75% of acreage
• Most active operator in East Texas
Haynesville with 4 rig program
since Q1 2018
1. Gross acres multiplied by ownership interest
multiplied by royalty rate
TSX: FNV | NYSE: FNV 29Haynesville Royalty Acquisition
Strong current cash flow:
• Royalties generated $4.2M in Q4 revenue
from 2.0 bcfe of natural gas1
Long life:
• ~700 undeveloped well locations
• Inventory supports ~12 years of drilling
at current rates of ~60 well/year
• Followed by long production tail as wells
decline
Diversification:
• Increases portfolio weighting to natural
gas
• Adds exposure to new basin
Haynesville
1. Oct 1, 2020 effective date
TSX: FNV | NYSE: FNV 30Royalty Ounce Breakdown
Core Assets
Cobre
4.9 Moz
Panama
Candelaria 1.3 Moz
Antapaccay 0.9 Moz
Antamina 0.6 Moz
4.9 Moz + 7.7 Moz + 2.9 Moz
15.5 M M&I Royalty Ounces
Plus > 240 development and exploration assets
For calculation of M&I Royalty Ounces refer to Franco-Nevada 2020 Asset
Handbook. New additions are Alpala and Condestable
TSX: FNV | NYSE: FNV 31TSX: FNV | NYSE: FNV CORPORATE PRESENTATION Thank you for FEBRUARY 2021 your interest in Franco-Nevada
Appendix – Non-IFRS Measures
  Adjusted Net Income                                               For the three months ended      For the year ended
                                                                                                                             1.   GEOs include our gold, silver, platinum, palladium and other mining assets, after applicable recovery and payability factors, and do not include
                                                                        December 31,                  December 31,                Energy assets. GEOs are estimated on a gross basis for NSR royalties and, in the case of stream ounces, before the payment of the per ounce
  (expressed in millions, except per share amounts)                    2020          2019            2020          2019
                                                                                                                                  contractual price paid by the Company. For NPI royalties, GEOs are calculated taking into account the NPI economics. Platinum, palladium, silver
Net Income                                                         $ 176.7        $ 113.3        $ 326.2          $ 344.1         and other minerals are converted to GEOs by dividing associated revenue, which includes settlement adjustments, by the relevant gold price. The
   Impairment charges and reversals                                    (9.6)            —          262.1                —         gold price used in the computation of GEOs earned from a particular asset varies depending on the royalty or stream agreement, which may make
   Foreign exchange (gains)/losses and other (income)/expenses         (2.5)         (2.8)            (2.8)          (2.8)        reference to the market price realized by the operator, or the average for the month, quarter, or year in which the mineral was produced or sold.
   Tax effect of adjustments                                           (1.6)          0.3           (69.2)            0.2
                                                                                                                             2.   Adjusted Net Income and Adjusted Net Income per share are non-IFRS financial measures, which exclude the following from net income and EPS:
Adjusted Net Income                                                $ 163.0        $ 110.8        $ 516.3          $ 341.5
                                                                                                                                  impairment charges related to royalty, stream and working interests and investments; gains/losses on sale of royalty, streams and working interests
Basic weighted average shares outstanding                            190.9          188.8          190.3            187.7         and investments; foreign exchange gains/losses and other income/expenses; unusual non-recurring items; and the impact of income taxes on these
Adjusted Net Income per share                                      $ 0.85         $ 0.59         $ 2.71           $ 1.82          items. Please refer to the Q4 2020 MD&A for details as to the relevance of these non-IFRS measures, and to the following appendix for a
   Adjusted EBITDA                                                 For the three months ended        For the year ended           reconciliation to the closest IFRS measures.
                                                                          December 31,                 December 31,          3.   Adjusted EBITDA and Adjusted EBITDA per share are non-IFRS financial measures, which exclude the following from net income and earnings per
 (expressed in millions, except per share amounts)                       2020            2019         2020           2019         share (“EPS”): income tax expense/recovery; finance expenses; finance income; depletion and depreciation; non-cash costs of sales; impairment
Net Income                                                        $ 176.7         $ 113.3         $ 326.2         $ 344.1         charges related to royalty, stream and working interests and investments; gains/losses on sale of royalty, streams and working interests and
   Income tax expense                                                21.5            17.2            13.3            61.8         investments; and foreign exchange gains/losses and other income/expenses. Please refer to the Q4 2020 MD&A for details as to the relevance of
   Finance expenses                                                    0.8            2.1              3.5           10.6         these non-IFRS measures, and to the following appendix for a reconciliation to the closest IFRS measures.
   Finance income                                                     (0.7)          (0.8)            (3.7)          (3.5)
                                                                                                                             4.   Cash Costs attributable to GEOs sold and Cash Costs per GEO sold are non-IFRS financial measures. Cash Costs attributable to GEOs sold is
   Depletion and depreciation                                        67.5            72.7           241.0           263.2         calculated by starting with total costs of sale and excluding depletion and depreciation, costs not attributable to GEOs sold such as our Energy
   Impairment charges and reversals                                   (9.6)             —           262.1               —         operating costs, and other non-cash costs of sales such as costs related to our prepaid gold purchase agreement. Cash Costs is then divided by
   Foreign exchange (gains)/losses and other (income)/expenses        (2.5)          (2.8)            (2.8)          (2.8)        GEOs sold, excluding prepaid ounces, to arrive at Cash Costs per GEO sold. Please refer to the Q4 2020 MD&A for details as to the relevance of these
Adjusted EBITDA                                                   $ 253.7         $ 201.7         $ 839.6         $ 673.4         non-IFRS measures, and to the following appendix for a reconciliation to the closest IFRS measures.
Basic weighted average shares outstanding                           190.9           188.8           190.3           187.7
                                                                                                                             5.   Margin is defined by the Company as Adjusted EBITDA divided by revenue. Please refer to the Q4 2020 MD&A for details as to the relevance of this
Adjusted EBITDA per share                                         $  1.33         $  1.07         $ 4.41          $ 3.59          non-IFRS measures, and to the following appendix for a reconciliation to the closest IFRS measure.
 Cash Costs                                                 For the three months ended            For the year ended         6.   The Company defines Working Capital as current assets less current liabilities.
                                                                  December 31,                      December 31,
                                                                                                                             7.   Fiscal years 2010 through 2020 were prepared in accordance with IFRS. Fiscal years 2008 and 2009 were prepared in accordance with Canadian
 (expressed in millions, except per GEO amounts)                 2020             2019             2020              2019
                                                                                                                                  GAAP.
Total costs of sales                                    $   114.2         $   119.0         $    399.8        $   408.0
   Depletion and depreciation                                (67.5)           (72.7)            (241.0)          (263.2)
   Energy operating costs                                      (1.9)            (2.2)              (6.4)            (7.3)                                                        2020                          2019                      Q4 2020                     Q4 2019
Cash Costs attributable to GEOs sold                    $     44.8        $    44.1         $ 152.4           $ 137.5
GEOs                                                      147,476           153,396           521,564           516,438
Cash Costs per GEO sold                                 $     304         $     287         $     292         $     266                      Gold                             $1,770/oz                       $1,392                     $1,873/oz                  $1,480/oz
 Margin                                                            For the three months ended       For the year ended
                                                                          December 31,                December 31,
 (expressed in millions, except Margin)                                  2020           2019           2020         2019
Net Income                                                         $ 176.7   $ 113.3 $ 326.2 $ 344.1                                        Silver                            $20.55/oz                     $16.20/oz                    $24.39/oz                  $17.31/oz
   Income tax expense (recovery)                                      21.5      17.2      13.3    61.8
   Finance expenses                                                     0.8      2.1        3.5   10.6
   Finance income                                                      (0.7)    (0.8)      (3.7)  (3.5)                                   Platinum                             $884/oz                       $863/oz                      $939/oz                     $907/oz
   Depletion and depreciation                                         67.5      72.7     241.0   263.2
   Impairment charges and reversals                                    (9.6)       —     262.1       —
   Foreign exchange (gains)/losses and other (income)/expenses         (2.5)    (2.8)      (2.8)  (2.8)
Adjusted EBITDA                                                    $ 253.7   $ 201.7 $ 839.6 $ 673.4                                     Palladium                            $2,194/oz                     $1,539/oz                    $2,348/oz                  $1,800/oz
Revenue                                                              304.5     258.1   1,020.2   844.1
Margin                                                                83.3 %    78.1 %    82.3 %  79.8 %

TSX: FNV | NYSE: FNV                                                                                                                                                                                                                                                                  33
Board and Management
Board Management
David Tom Derek Dr. Catharine Louis Paul Sandip Lloyd
Harquail Albanese Evans Farrow Gignac Brink Rana Hong
Former CEO CEO Former CEO Chair Director, CFO CLO
Chair Rio Tinto MEG Energy TMAC Resources G Mining Ventures President & CEO
Maureen Jennifer Randall The Hon. David R. Elliott Eaun Jason
Jensen Maki Oliphant Peterson Pew Gray O’Connell
Former CEO Former CEO Former CEO Former Ontario Former Chair SVP, Business SVP, Energy
Ontario Securities Vale Canada Barrick Gold Premier EnerPlus Development
Commission
TSX: FNV | NYSE: FNV 34Business Model Benefits
Gold ETF FNV
Benefits of: Leverage to Gold Price
Exploration & Expansion
Dividend Yield
Limited Exposure to: Capital Costs
Operating & Other Costs
Royalties provide more yield and upside than a Gold ETF
TSX: FNV | NYSE: FNV 35Cobre Panama Growth
400 160,000
(LHS)
Cobre Panama2 estimated 350 140,000
copper production
(tonnes in thousands)
300 120,000
FNV’s attributable GEOs3 250 100,000
RHS
based on estimated copper
production4 (ounces)
200 80,000
150 60,000
1. 2020 GEOs sold
2. First Quantum 2021 to 2023 guidance dated
January 26, 2021 which has not yet been reflected
in FNV’s corporate guidance
100 40,000
3. Assuming: $1,750/oz Au; $25/oz Ag
4. FNV is entitled to $100/oz discount on initial stream
payments to provide a 5% return on capital for the
period from January 1, 2019 until mill throughput
50 20,000
capacity achieved 58 mtpy
0 0
1
2020 2021 2022 2023
TSX: FNV | NYSE: FNV 36Growth Drivers
Operating Assets
Candelaria (Chile) Reserve and Resource expansion
Detour Lake (Ontario) Single pit concept & expansion
Hemlo (Ontario) Down plunge of C-zone Candelaria
Duketon (Australia) Expanding Rosemont OP to UG
Macassa (Ontario) SMC, Main and Amalgamated break
Canadian Malartic (Quebec) East Gouldie reserve update Q1 2021
Mesquite (California) Reserve and Resource expansion
Canadian Malartic
TSX: FNV | NYSE: FNV 37Organic Growth News
Development and Exploration Assets
Hardrock (Ontario) Equinox and Orion acquiring project
Stibnite Gold (Idaho) Feasibility study completed
Wyloo Metals (Andrew Forrest)
Ring of Fire (Ontario)
investment
Valentine Lake (Newfoundland) Berry zone expansion
Eskay Creek (British Columbia) Phase 2 Infill drilling
Monument Bay (Manitoba) Evaluating an underground project
Crawford Nickel (Ontario) PEA Q1 2021
Fenelon (Quebec) 170,000 m drill program in 2021
Eskay Creek
TSX: FNV | NYSE: FNV 38CRA Audit (2012-2017)
Taxation Years Potential Income Potential Interest &
Reassessed Tax Payable1 Penalties1,4
Canadian Domestic Tax Matters 2014, 2015 $1.1M (C$1.4M)2 $0.2M (C$0.2M)
Transfer Pricing (Mexican Subsidiary) 2013, 2014, 2015 $19.9M (C$25.3M)3 $15.2M (C$19.5M)
Transfer Pricing (Barbadian Subsidiary) 2014, 2015 $5.3M (C$6.7M) $3.7M (C$4.7M)
Foreign Accrual Property Income (Barbadian Subsidiary) 2012, 2013 $6.0M (C$7.7M) $2.4M (C$3.1M)
Franco-Nevada does not believe that the Reassessments are supported by Canadian tax law and jurisprudence and intends
to vigorously defend its tax filing positions
CRA audit recently expanded to include 2016 and 2017. No proposals or reassessments have been received for these years
1. Canadian dollar amounts in this table have been converted to US dollars at the exchange rate applicable at December 31, 2020 as quoted by the Bank of Canada.
2. Tax payable after applying available non-capital losses and other deductions
3. Tax payable before any double taxation relief under the Canada-Mexico tax treaty
4. Includes transfer pricing penalties of $10.1M (C$12.8M)
TSX: FNV | NYSE: FNV 39You can also read