Tutorial on Parallel Debugging Victor Eijkhout TACC HPC Training 2021
←
→
Page content transcription
If your browser does not render page correctly, please read the page content below

Tutorial on Parallel Debugging
                        Victor Eijkhout
                        TACC HPC Training 2021

Eijkhout: Debugging intro                                1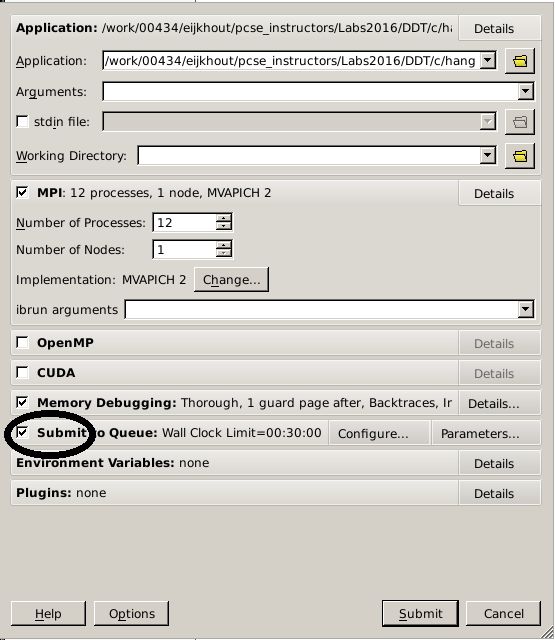
Defensive programming

           Better than finding errors is peventing them:
           defensive programming.
           One possibility: Use ‘assertions’ about things that have to be true.

          #include
          // for C++: #include
          assert( x>= 0 );
          y = sqrt(x)

           Program will terminate if the assertion fails.
           Disable assertions in production by defining NDEBUG

Eijkhout: Debugging intro                                              2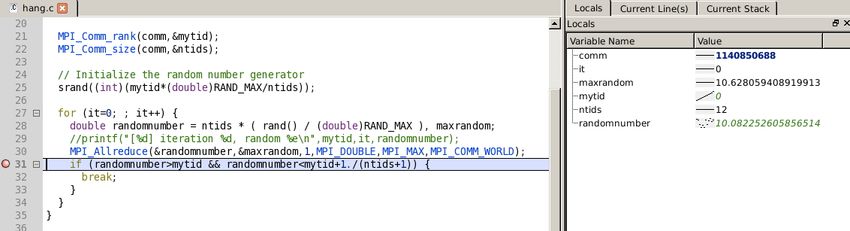
Compiling for debug

  Enable debug mode with -g option:

  mpicc -g -O2 yourprogram

  Debug option can be used with any optimization level, but sometimes good to
  start at -O0:

  mpicc -g -O0 yourprogram

  Compiler optimizations may confuse you otherwise.

Eijkhout: Debugging intro                                      3

Important! Note! About! Exercises!

      1    You should have a directory exercises_ddt_c (or maybe f). Go there.
      2    Start an interactive session: idev
      3    Exercise slides will have a program name at the top: [roots].
           This means you compile with make roots
      4    Run your program with ./roots if sequential
           or ibrun roots for parallel.

Eijkhout: Debugging intro                                           4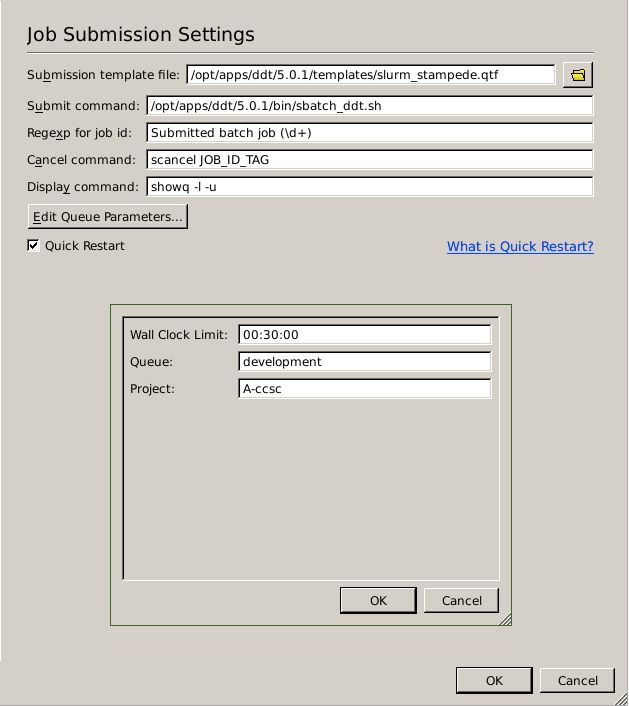
Traditional sequential debugging

Eijkhout: Debugging intro            5
Debugging approaches

           Print statements:
                    can be effective, but they often perturb the behaviour:
                    crashing code mysteriously works with print statements.
                    Also: the error is often not where you think it is.
                    Lots of recompilation.
           Interactive debuggers, different approaches:
               1    Start program in debugger
               2    Attach debugger to running program
               3    Do ‘post mortem’ analysis on ‘core dump’.

Eijkhout: Debugging intro                                                     6
Interactive debuggers
Commandline based tools:
gdb comes free with Gnu compilers; other debuggers are very similar
(Apple has switched to lldb, which has different commands)
Graphic frontends: Visual Studio, CLion, Eclipse, Xcode, . . .
Catch interrupts and inspect state of the program
Interrupt a run yourself to inspect variables (breakpoints)
Step through a program.
Eijkhout: Debugging intro 7Example
Compile roots.c: make roots
Run the program, first on the commandline. Output?
Execute this sequence of commands:
gdb root
run, observe the output
quit
Eijkhout: Debugging intro 8Diagnosing the problem
Floating point errors do not stop your program!
In the debugger type:
break roots.c:32 or whatever the first line of the root function is
run and note that it stops at the break point.
where displays the ‘stack frames’; frame 3 to go there
list shows you the sources around the breakpoint
print n to show your the current value
cont to continue execution.
Better: break roots.c:32 if (nMore gdb
command meaning
run / cont start / continue
break file.c:123 breakpoint at line
break if conditional stop
delete 1 / enable 2 / disable 3 break point manipulation
where show call stack
frame 2 specific frame
For more commands see the cheat sheet in the course package.
Eijkhout: Debugging intro 10Exercise 1 (roots) You can force your execution to stop at floating point errors: feenableexcept Uncomment that line in the source, compile and run program, both commandline and debugger. In the debugger, inspect the offending line in all frames. Eijkhout: Debugging intro 11
Everyone’s favourite error: memory problems

           Write outside the bounds of an array
           (runtime checks are too expensive)
           Write to unallocated memory
           Read from unitialized memory.

  First two can usually be caught with a debugger;
  third one: use a memory tool like valgrind

  module load valgrind

  valgrind myprogram # sequential
  ibrun valgrind myprogram # parallel

Eijkhout: Debugging intro                            12
Exercise 2 (array1) Compile and run array1.c. (Look in the source to see the problem.) If the program does not crash, recompile: make clean array1 EXTRA_OPTIONS=5000 or even more. Eijkhout: Debugging intro 13
Memory tools: valgrind

           At TACCP module load valgrind
           run with valgrind array1
           Look at the diagnostics. Do you understand them?

Eijkhout: Debugging intro                                     14
Same program in the debugger Program received signal SIGSEGV, Segmentation fault. 0x0000000000400b31 in main (argc=1, argv=0x7fffffff95a8) at array1.c:3 33 squares[i] = 1./(i*i); Missing separate debuginfos, use: debuginfo-install glibc-2.17-260.el7 (gdb) where #0 0x0000000000400b31 in main (argc=1, argv=0x7fffffff95a8) at array1 (gdb) print i $1 = 5784 (gdb) print squares $2 = (float *) 0x7fffffff95a0 After a while you ‘get a feel’ for what is a legitimate address and what is not. This is not. Eijkhout: Debugging intro 15
Exercise 3 (array2)

  Access out of bounds. Can you find the problem with the debugger or with
  valgrind?

  Bonus exercise: what does valgrind say if you remove the initialization of sum?

Eijkhout: Debugging intro                                        16
Parallel debugging

Eijkhout: Debugging intro   17
Your minimal parallel debugger

  mpirun -np 4 xterm -e gdb yourprogram

  Pops up 4 xterms.
  Great for debugging on your laptop.
  Not great at scale.

Eijkhout: Debugging intro                 18
The DDT debugger

  Originally by Allinea, now bought by ARM.

           Graphical front-end to gdb-like and valgrind-like capabilities
           Some specifically parallel features
           Commercial, and with very few open source alternatives
           (Eclipse with PTP)
           An absolute life-saver!

Eijkhout: Debugging intro                                              19
Using the DDT debugger Load the module: module load ddt Call the debugger: ddt yourprogram Eijkhout: Debugging intro 20
Graphics on a TACC cluster

           Through an X forwarding connection:
           ssh -X you@stampede.tacc.utexas.edu
           use VNC.
           use DCV (https:
           //portal.tacc.utexas.edu/tutorials/remote-desktop-access):
           # submit DCV job:
           sbatch /share/doc/slurm/job.dcv
           # when the job is running:
           cat dcvserver.out
           The dcvserver.out file contains a URL: this gives a graphical terminal
           session in your browser.

Eijkhout: Debugging intro                                          21
DDT modes
Start on login node, let DDT submit to queue
you may need to wait a little while
Start on compute node, DDT runs directly, not through queue
Also ‘reverse connect’ and batch mode, see
https://portal.tacc.utexas.edu/tutorials/ddt
Eijkhout: Debugging intro 22Run parameters
MPI or OpenMP? Processes,
nodes, threads.
Memory debugging
Commandline arguments
Check ‘submit’ when running on
a login node:
it submits to the queue for you;
uncheck if starting from idev
session.
Eijkhout: Debugging intro 23Submission setup
Project: your own, or one for this
class
Queue: development often
quickest
Eijkhout: Debugging intro 24Program starts at MPI_Init
Use run controls
Eijkhout: Debugging intro 25Hanging processes
Red: stopped at an interrupt or breakpoint
Green: still running.
All green but ‘nothing happening’: probably hanging program.
Combination: some processes are not getting to the breakpoint: probably
deadlocked.
Eijkhout: Debugging intro 26Call stacks
Hit the pause button, go to ‘stacks’ panel.
Not every process is in the same source line.
Click on process number to see what it’s doing.
Eijkhout: Debugging intro 27Breakpoints
Set breakpoint by clicking left of the line
when you run, it will stop at the breakpoint.
Values display: everyone the same it
value of mytid linearly increasing
value of randomnumber all over the place.
Eijkhout: Debugging intro 28Exercise 4 (finalize)
Compile and run finalize.c.
Every process completes the run, yet the program is incorrect.
Uncomment the barrier command and rerun. What do you observe?
Set a breakpoint inside the conditional. Do all processes reach it?
Eijkhout: Debugging intro 29Exercise 5 (bcast) Compile and run bcast.c. The program finishes, yet it is not correct. (Why?) Recompile: make clean make bcast EXTRA_OPTIONS=-DN=100000 Does the program still complete? Eijkhout: Debugging intro 30
Exercise 6 (sendrecv1)

  Another program that is incorrect, but that finishes because small messages
  slip through the network.

  Replace MPI_Send with MPI_Ssend which enforces blocking behavior.
  Now what happens?

Eijkhout: Debugging intro                                       31
Exercise 7 (sendrecv2)

  This code fixes the problem with sendrecv1.
  But is this sensible?

           module load tau
           Compile with TAU:
           make clean; make sendrecv2
           Run and generate trace files:
           make taurun PROGRAM=sendrecv2
           Postprocess:
           make tau PROGRAM=sendrecv2
           Somewhere with X windows:
           jumpshot tautrace_sendrecv2.slog2

Eijkhout: Debugging intro                       32
TAU visualization Eijkhout: Debugging intro 33
Exercise 8 (isendrecv)

  The proper solution is of course the use of MPI_Irecv.

  Make a TAU visualization of a run of isendrev.c.
  Is this optimal?

Eijkhout: Debugging intro                                  34
You can also read