UMBC/CRESST/NASA/GSFC - for the POEMMA Collaboration 29th JEM-EUSO International Collab Meeting - vCSM
←
→
Page content transcription
If your browser does not render page correctly, please read the page content below
Poetry in Orbit: Cosmic Ray and Neutrino MultiMessenger Astrophysics
 with the Probe Of Extreme Multi-Messenger Astrophysics (POEMMA)

             UHECRs: E > 20 EeV

           ToO Neutrinos: E > 20 PeV

                                                      John Krizmanic
                                                  UMBC/CRESST/NASA/GSFC
                                                   for the POEMMA Collaboration
6-Jul-21                                                                                               1
                                                   29th JEM-EUSO International Collab Meeting - vCSM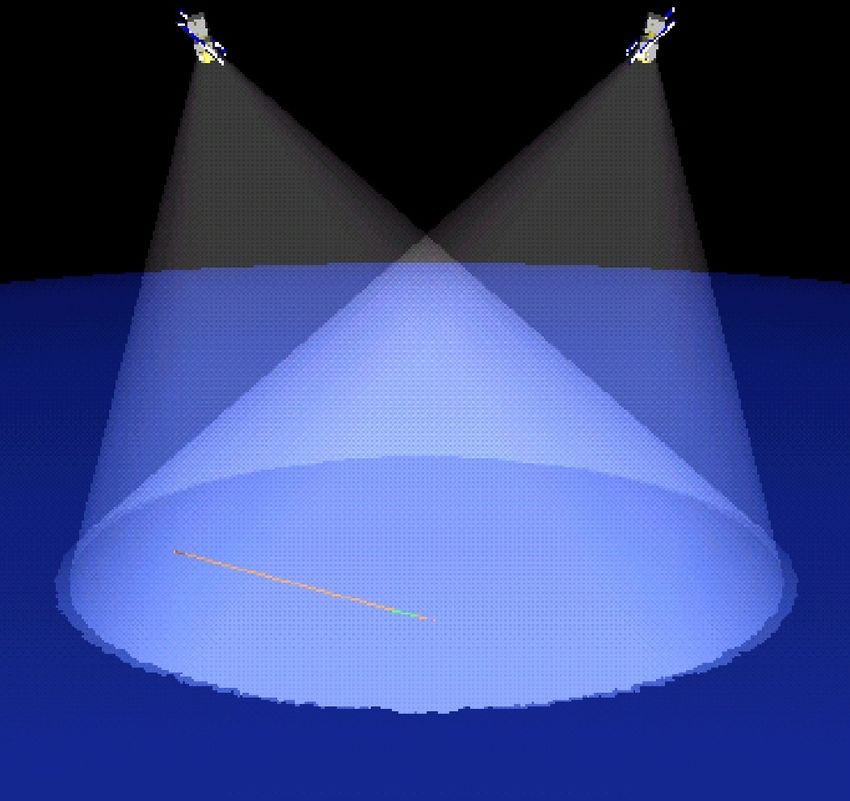
observatory also observes UHECRs via EAS fluorescence in the angular range from below
   Outline                the limb to ⇠47 from nadir (shown in the right panel of Figure 2).

  1. Scientific and Experimental Motivation.
                       Figure 2. POEMMA observing modes. Left: POEMMA-Stereo mode to observe fluorescence for UHE
  2. POEMMA & Mission     Description:
                       cosmic           JCAP, Vol in
                              rays and neutrinos  2021,  06,(most
                                                     stereo  id.007precise measurements when pointed close to nadir). Right:
  3. POEMMA UHECR POEMMA-Limb
                       & UHE NeutrinomodePerformance
                                              to observevia   air fluorescence
                                                          Cherenkov            measurements.
                                                                       from cosmic neutrinos just below the limb of the Earth
       -                and fluorescence
            Summary of results presented infrom UHECRs.
                                            PhysRevD.101.023012 and PhysRevD.103.043017
   4. POEMMA VHE Neutrino Performance via optical Cherenkov measurements.
                              To follow up ToO transient alerts, the observatory is swiftly positioned in POEMMA-
         - Summary of results presented in PhysRevD.100.063010 and PhysRevD.102.123013
                       Limb mode pointing towards the rising or setting source position to search for neutrino
   5. POEMMA-inspired    Space-based
                       emission           Research
                                   associated    withand     Development event.
                                                        the astrophysical         … moving  For forward
                                                                                                transient neutrino events lasting longer
         - nSpaceSim NASA-funded
                       than a day,  end-to-end   cosmic neutrino
                                       the spacecraft      propulsion  simulation
                                                                              systems development   (PoS(ICRC2019)936
                                                                                           will bring  the POEMMA )telescopes closer
         - EUSO-SPB2 ULDB flight intospring
                       together             2023the ToO source with overlapping instrument light pools, lowering the
                                       observe
   6. Summary & Comments
6-Jul-21               energy threshold   29thfor neutrino
                                               JEM-EUSO        detection
                                                        International          via the
                                                                      Collab Meeting     use of time coincidence (denoted ToO-stereo
                                                                                     - vCSM                                       2
                       configuration). For shorter-duration transients, the two POEMMA telescopes will conduct
M. Pech, J.S. Perkins, P. Picozza, L.W. Piotrowski,
7
Z. Plebaniak,10 G. Prévôt,33 P. Reardon,4 M.H. Reno,29 M. Ricci,36
70+ scientists from 21+ institutions (US 10+)
POEMMA Collaboration O. Romero Matamala,9 F. Sarazin,22 P. Schovánek,27 V. Scotti,32,37
K. Shinozaki,38 J.F. Soriano,6 F. Stecker,2 Y. Takizawa,17
OWL, JEM-EUSO, Auger, TA, Veritas, CTA, Fermi, Theory
R. Ulrich,20 M. Unger,20 T.M. Venters,2 L. Wiencke,22 D. Winn,29
R.M. Young12 and M. Zotov25
J ournal of Cosmology and Astroparticle Physics
An IOP and SISSA journal
1 The
2 NASA
University of Chicago, Chicago, IL, U.S.A.
Goddard Space Flight Center, Greenbelt, MD, U.S.A.
3 Center for Space Science & Technology, University of Maryland,
Baltimore County, Baltimore, MD, U.S.A.
4 University of Alabama in Huntsville, Huntsville, AL, U.S.A.
5 Gran Sasso Science Institute, L’Aquila, Italy
The POEMMA (Probe of Extreme 6 City University of New York, Lehman College, NY, U.S.A.
7 Istituto Nazionale di Astrofisica INAF-IASF, Palermo, Italy
Multi-Messenger Astrophysics)
8 Istituto Nazionale di Fisica Nucleare, Catania, Italy
9 Georgia Instituteauthor.
of Technology, Atlanta, GA, U.S.A.
ú
Corresponding
observatory
10 Universita’ di Torino, Torino, Italy
JCAP06(2021)007
11 University of Utah, Salt Lake City, Utah, U.S.A.
12 NASA Marshall Space Flight Center, Huntsville, AL, U.S.A.
13 Istituto Nazionale di Fisica Nucleare, Turin, Italy
•c 2021 IOP Publishing Ltd and Sissa Medialab https://doi.org/10.1088/1475-7516/2021/06/007
POEMMA collaboration 14 Niels Bohr Institute, University of Copenhagen, DK-2100 Copenhagen, Denmark
15 Istituto Nazionale di Fisica Nucleare, Bari, Italy
A.V. Olinto,1,ú J. Krizmanic,2,3 J.H. Adams,4 R. Aloisio,5 16 Universita’ di Catania, Catania Italy
L.A. Anchordoqui,6 A. Anzalone,7,8 M. Bagheri,9 D. Barghini,10 17 RIKEN, Wako, Japan
M. Battisti,10 D.R. Bergman,11 M.E. Bertaina,10 P.F. Bertone,12
18 Istituto Nazionale di Fisica Nucleare, section of Roma Tor Vergata, Italy
JCAP06(2021)007
19 Joint Laboratory of Optics, Faculty of Science,
F. Bisconti,13 M. Bustamante,14 F. Cafagna,15 R. Caruso,16,8 Palack˝ University, Olomouc, Czech Republic
M. Casolino,17,18 K. ern˝,19 M.J. Christl,12 A.L. Cummings,5 20 Karlsruhe Institute of Technology, Karlsruhe, Germany
I. De Mitri,5 R. Diesing,1 R. Engel,20 J. Eser,1 K. Fang,21
21 Kavli Institute for Particle Astrophysics and Cosmology, Stanford University,
Stanford, CA 94305, U.S.A.
F. Fenu,10 G. Filippatos,22 E. Gazda,9 C. Guepin,23 A. Haungs,20 22 Colorado School of Mines, Golden, CO, U.S.A.
E.A. Hays,2 E.G. Judd,24 P. Klimov,25 V. Kungel,22 E. Kuznetsov,4 23 Department of Astronomy, University of Maryland, College Park, MD, U.S.A.
24 Space Sciences Laboratory, University of California, Berkeley, CA, U.S.A.
ä. Mackovjak,26 D. Mandát,27 L. Marcelli,18 J. McEnery,2 25 Skobeltsyn Institute of Nuclear Physics, Lomonosov Moscow State University,
G. Medina-Tanco,28 K.-D. Merenda,22 S.S. Meyer,1 J.W. Mitchell,2 Moscow, Russia
H. Miyamoto,10 J.M. Nachtman,29 A. Neronov,30 F. Oikonomou,31 26 Institute of Experimental Physics, Slovak Academy of Sciences, Kosice, Slovakia
27 Institute of Physics of the Czech Academy of Sciences, Prague, Czech Republic
Y. Onel,29 G. Osteria,32 A.N. Otte,9 E. Parizot,33 T. Paul,6 28 Instituto de Ciencias Nucleares, UNAM, CDMX, Mexico
M. Pech,27 J.S. Perkins,2 P. Picozza,18,34 L.W. Piotrowski,35 29 University of Iowa, Iowa City, IA, U.S.A.
Z. Plebaniak,10 G. Prévôt,33 P. Reardon,4 M.H. Reno,29 M. Ricci,36 30 University of Geneva, Geneva, Switzerland
31 Institutt for fysikk, NTNU, Trondheim, Norway
O. Romero Matamala,9 F. Sarazin,22 P. Schovánek,27 V. Scotti,32,37 32 Istituto Nazionale di Fisica Nucleare, Napoli, Italy
K. Shinozaki,38 J.F. Soriano,6 F. Stecker,2 Y. Takizawa,17 33 Université de Paris, CNRS, Astroparticule et Cosmologie, F-75013 Paris, France
R. Ulrich,20 M. Unger,20 T.M. Venters,2 L. Wiencke,22 D. Winn,29 34 Universita di Roma Tor Vergata, Italy
35 Faculty of Physics, University of Warsaw, Warsaw, Poland
R.M. Young12 and M. Zotov25 36 Istituto Nazionale di Fisica Nucleare — Laboratori Nazionali di Frascati, Frascati, Italy
37 Universita’ di Napoli Federico II, Napoli, Italy
1 The University of Chicago, Chicago, IL, U.S.A.
6-Jul-21
2 NASA Goddard Space Flight Center, Greenbelt, MD, U.S.A. 29th JEM-EUSO International Collab Meeting - vCSM
38 National Centre for Nuclear Research, Lodz, Poland
3
3 Center E-mail: aolinto@uchicago.edu
for Space Science & Technology, University of Maryland,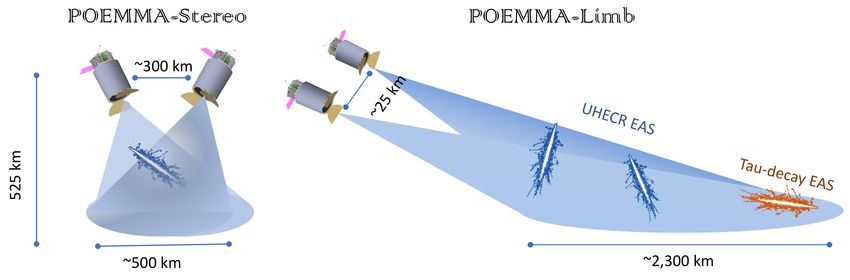
POEMMA Heritage
        Based on OWL 2002 study, JEM-EUSO, EUSO balloon experience, and CHANT proposal

                                                         TUS, KLYPVE-EUSO
MASS:*Maximum*
Energy*Auger*(Air)*
Shower*Satellite*

                                                                                                  CHANT
******Italian*Mission
                                                                        EUSO-SPB1

                          OWL
                          2002          EUSO:
                         design     Extreme Universe
                                    Space Observatory

                                                                                             Cherenkov from Astrophysical
                                                                                                     Neutrinos
                                                                                                     Telescope

                                                       EUSO-Balloon
                                                       EUSO@TA                               EUSO-SPB2
              6-Jul-21    nueBACH        29th JEM-EUSO Mini-EUSO
                                                       International Collab Meeting - vCSM                                  4
The Cosmic Ray Spectrum
Key Features:
Energy [J]
1. Knee: ~ 106.5 GeV 10°10 10°8 10°6 10°4 10°2 100 102
Consistent with galactic
/s
github.com/carmeloevoli/The CR Spectrum
AMS-02
m2
r
sources changing via 103
/y
AUGER
p
1/
m2
BESS
CALET
1/
Peters cycle, Z-dependent CREAM
DAMPE
acceleration (lighter going FERMI
HAWC
Energy flux [GeV/m2 s sr]
101
HESS
to heavier). e° +e+ ICECUBE
ICETOP+ICECUBE
e+
2. Ankle: ~109.5 GeV
KASCADE
KASCADE-Grande
NUCLEON
a. Funky composition PAMELA
Telescope Array
evolution. 10°1 Knee Tibet-III
TUNKA
p̄ g VERITAS
b. Galactic to
Ankle
extragalactic
10°3
r
/y
transition?
2
km
c. Due to proton
1/
g IRGB n + n̄
interactions with
evolving CMB 10°5
LHC (disfavored) LHC
d. Composition effect?
10°7
3. Foot/Toes/Bunions: GeV TeV PeV EeV
Energy
~1010.7 GeV
6-Jul-21 29th JEM-EUSO International Collab Meeting - vCSM 5
The Cosmic Ray Spectrum: Structure in VHE & UHECR energy range

              LHC

6-Jul-21              29th JEM-EUSO International Collab Meeting - vCSM              6
                                                                          PoS(ICRC2019)030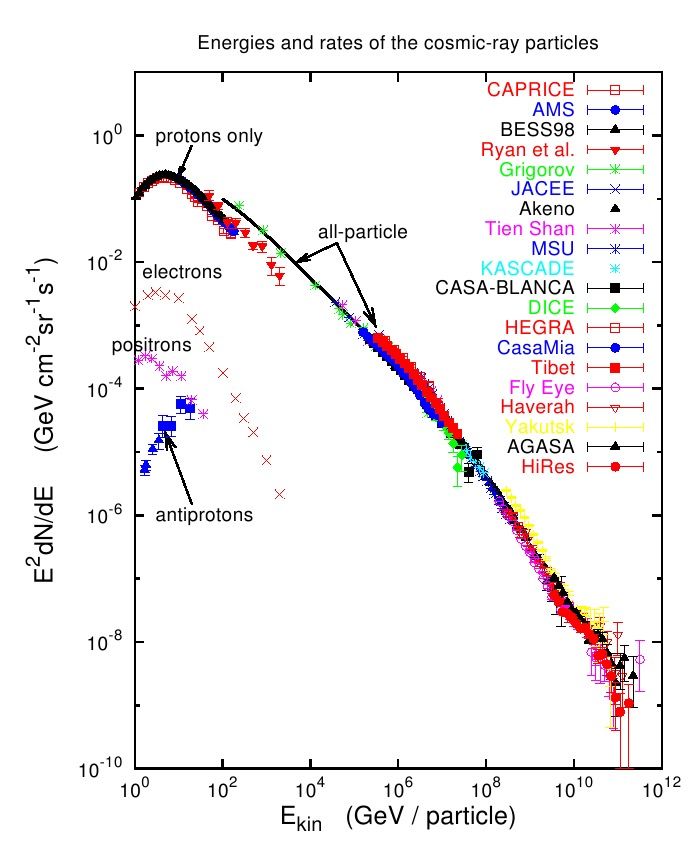
- May 2019) in the equatorial coordinates. Events are smoothed by 25◦ oversampling radiu
defined in this paper. (b) A significance map of the UHECR events with E > 57 EeV for e
UHECR Gound-based Measurement Status
the 1st 5 years of TA data (May 2008 - May 2013). Events are smoothed by 20◦ oversamp
UHECR Hotspot Observed by the TA according to our original paper [4]. The solid curves indicate supergalactic
K. Kawata plane (SGP)
TA HotSpot: PoS(ICRC2019)310 plane (GP).
Origin UHECRs still unknown
Giant ground Observatories: Auger & TA
- TA Hotspot: intermediate-scale anisotropy
- sources are extragalactic: Auger dipole > 8 EeV
- spectral features: discrepancies E > 50 EeV Figure 1: (a) A significance map of the UHECR
Figure 2:events
- May 2019) in the equatorial coordinates.events
Events
Number
are
(Blue
with
smoothed
curve),
E > 57 EeV
of cumulative
respectively,
forof11the
events
◦ oversampling
by 25above
years of TA
hotspot
57 EeV. The radius
data(Red
region (May
circle,
green and yellow
2008
curve),
which
and cumula
shadedisareas show
- UHECR Composition: unclear E > 50 EeV deviations
defined in this paper. (b) A significance map of thefrom the rateevents
UHECR of data observation
with E > respectively,
57 EeV forassuming
◦
the 1st 5 years of TA data (May 2008 - May 2013). Events are smoothed by 20 oversampling radius circle
a linear increase
events observed in in rate
- source anisotropy Hints E > 50 EeV
Auger and TA UHECR energy spectrum Olivier Deligny according to our original paper [4]. Theapproximately
plane (GP).
solid curvesdouble
indicate supergalactic
statistics of the firstplane
5-year(SGP) and theThese
observation. galactic
events are su
ferent five oversampling radius circles, 15◦ , 20◦ , 25◦ , 30◦ , and 35◦ . The centers of t
are on a 0.1◦ ×0.1◦ grid in the equatorial coordinates. We then search for the maxim
Auger Highlights Antonella Castellina
over all grid points and five oversampling radius circles. We found the maximum
yr sr eV ]
2
5.1σ at a position R.A.=144.3 , and Dec.=40.3 with 25◦ oversampling radius circ
◦ ◦
PAO Dipole: ArXiv:1909.10791
38
-1
10 probability of the 11-year hotspot in an isotropic sky is estimated to be 2.1×10⁻³ (
90 (a) shows the significance maps of the UHECR events with E > 57 EeV for 11
-1
0.44
radius circle, compared with our previous result for the 1st 5 years of data with 20◦
-2
(b) [4]. The 11-year hotspot looks larger size than the 5-year hotspot (the number
E J(E) [km
Flux[km-2 sr-1 yr-1]
events in 25◦ radius circle is 50% higher than that of 20◦ radius circle). It has exten
PoS(ICRC2019)234 to the supergalactic plane (SGP), and is irregular in shape. Therefore a circular over
0.40
37 360 is not really appropriate.
0 In that case, the significance of such an excess might be
PoS(ICRC201
10
3
TA, ICRC 2019
Auger, ICRC 2019 2
0.36
16 17 18 19 20 -90
10 10 10 10 10
E [eV]
Figure
Figure9:2:Left: The ofCR
Number flux above
cumulative 8 EeV,
events averaged
of the on top-hat
hotspot region (Red windows
curve), andofcumulative
45 radius (equatorial
background
Figure 1: ICRC 2019 energy spectra of the Pierre Auger Observatory and the Telescope Array scaled by
events (Blue curve),
coordinates). respectively,
The Galactic planeabove
and 57
theEeV. The green
Galactic centerandare
yellow shadedby
indicated areas show ±1
a dashed σ and
line and±2a σstar
E 3 . In each experiment, data of different detection techniques are combined to obtain the spectrum over a deviations from the rate of data observation respectively, assuming a linear increase in
respectively. Right: Energy dependence of the dipolar amplitude measured in four energy bins rate.
wide energy range.
above 4 EeV.
6-Jul-21 29th JEM-EUSO International Collabapproximately
Meeting - vCSM 7 over dif-
double statistics of the first 5-year observation. These events are summed
1. Introduction
ferent five oversampling radius circles, 15◦ , 20◦ , 25◦ , 30◦ , and 35◦ . The centers of tested directions
POEMMA: UHECR Exposure History
                                                                                                                                                                                                                8

                                                                                                                                                         ‘Limb’

                                                                                                                                                          ‘Nadir’

                                              FIG. 8: A stereo reconstructed 50 EeV UHECR in the two POEMMA focal planes. The solid line denotes the simulated trajectory
                                              while the dashed line shows the reconstructed trajectory. The color map provided the photo-electron statistics in each pixel

                                                                                                              simulation
                                                                               30                                               2        20
                                                                                                              σ(Xmax) = (14.3 g/cm ) / E/10 eV

                                               σ(Xmax )/(g/cm2) from n(p.e.)
                                                                               25

                                                                               20
                                                                                                                                                               106 km2 sr
                                                                               15

                                                                               10

                                                                                5

                                                                                                                                                                                POEMMA
                                                                                    19.4   19.6   19.8   20         20.2     20.4     20.6       20.8
                                                                                                         lg(E/eV)

                                              FIG. 9: Single-photometer Xmax -resolution from photo-
                                              electron statistics.

                                              E & 100 EeV, where it is possible to also operate in
6-Jul-21             29th JEM-EUSO International
                                            higher Collab  Meeting
                                                   background levels. - vCSM                                                                                                                                8
                                                                                                                                                        FIG. 10: The simulated UHECR aperture after event recon-
                                                                                                                                                        struction for POEMMA for stereo mode and tilted mode.
                                                Another source of background is the UV emission
                                              produced by direct particles interacting in the detector,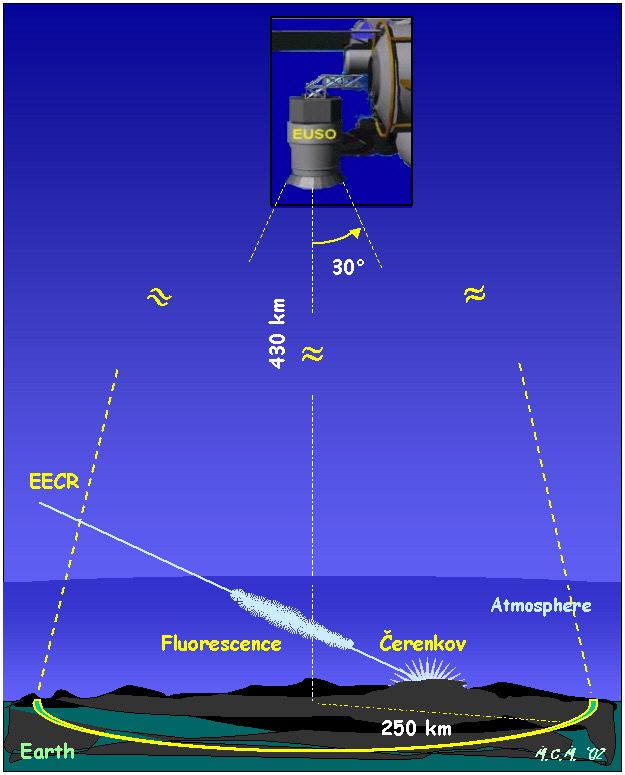
POEMMA: Science Goals

POEMMA Science goals:
primary
- Discover the origin of Ultra-High Energy Cosmic Rays
    Measure Spectrum, composition, Sky Distribution at Highest Energies (ECR > 20 EeV)
    Requires very good angular, energy, and Xmax resolutions: stereo fluorescence
    High sensitivity UHE neutrino measurements via stereo fluorescence measurements
- Observe Neutrinos from Transient Astrophysical Events
    Measure beamed Cherenkov light from upward-moving EAS from t-leptons source by
    nt interactions in the Earth (En > 20 PeV)
    Requires tilted-mode of operation to view limb of the Earth & ~10 ns timing
    Allows for tilted UHECR air fluorescence operation, higher GF but degraded resolutions
secondary                                                        √s ≈ 450 TeV @ 100 EeV
- study fundamental physics with the most energetic cosmic particles: CRs and Neutrinos
- search for super-Heavy Dark Matter: photons and neutrinos
- study Atmospheric Transient Events, survey Meteor Population
    6-Jul-21                     29th JEM-EUSO International Collab Meeting - vCSM    9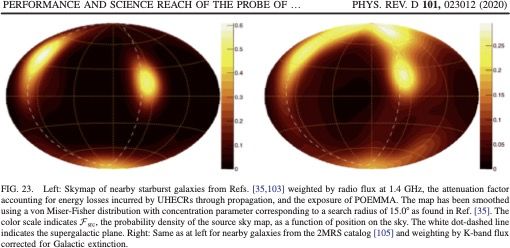
POEMMA: Instruments defined by weeklong IDL run at GSFC

                                                                         Alignment Precision RMS, mm

6-Jul-21             29th JEM-EUSO International Collab Meeting - vCSM                                 10
                                                                 Imaging ~104 away from diffraction limit
POEMMA: Schmidt Telescope details
Two 4 meter F/0.64 Schmidt telescopes: 45∘ FoV
Primary Mirror: 4 meter diameter
Corrector Lens: 3.3 meter diameter
Focal Surface: 1.6 meter diameter RMS spot size → 3 mm pixels
Optical AreaEFF: ~6 to 2 m2
Hybrid focal surface (MAPMTs and SiPM)
3 mm linear pixel size: 0.084 ∘ FoV
6-Jul-21 29th JEM-EUSO International Collab Meeting - vCSM 11POEMMA: Hybrid Focal Plane
UV Fluorescence Detection using MAPMTs Cherenkov Detection
with BG3 filter (300 – 500 nm) developed by with SiPMs (300 – 1000 nm):
JEM-EUSO: 1 usec sampling 20 nsec sampling
Elementary Cell (EC)
SiPM (8x8)
1.6 m
9∘
PCB1 PCB2
150 30 Si-Diode Interconnector
Counts
Y [mm]
100 25
50 20
30 SiPM focal surface units
0 15 Total 15,360 pixels
−50 10
512 pixels per FSU (64x4x2)
Si-Diode for LEO radiation
−100 5
backgrounds rejection
0
−250 −200 −150 −100 −50 0
X [mm]
55 Photo Detector Modules (PDMs)= 126,720 pixels
1 PDM = 36 MAPMTs = 2,304 pixels
6-Jul-21 29th JEM-EUSO International Collab Meeting - vCSM 12POEMMA: Hybrid Focal Plane
UV Fluorescence Detection using MAPMTs Cherenkov Detection
with BG3 filter (300 – 500 nm) developed by with SiPMs (300 – 1000 nm):
JEM-EUSO: 1 usec sampling 20 nsec sampling
Elementary Cell (EC)
SiPM (8x8)
1.6 m
9∘
PCB1 PCB2
MC results :
Si-Diode Interconnector
qC30 2.5∘ →
≲ SiPM ≲ 20 ns units
150 30
Counts
Y [mm]
100 25
focal surface
Total∘ FoV
0.084 15,360 pixels
Pix puts
50 20
30 SiPM
512focal surface
pixels units
per FSU (64x4x2)
0 15
signal into
Si-Diode
Total 15,360 single pixel
for LEO radiation
pixels
−50 10
backgrounds rejection
512 pixels per FSU (64x4x2)
Si-Diode for LEO radiation
−100 5
backgrounds rejection
0
−250 −200 −150 −100 −50 0
X [mm]
55 Photo Detector Modules (PDMs)= 126,720 pixels
1 PDM = 36 MAPMTs = 2,304 pixels
6-Jul-21 29th JEM-EUSO International Collab Meeting - vCSM 13POEMMA: Mission (Class B) defined by weeklong MDL run at GSFC
Mission Lifetime: 3 years (5 year goal) Flight Dynamics/Propulsion:
Orbits: 525 km, 28.5∘ Inc - 300 km ⟹ 25 km SatSep
Orbit Period: 95 min - Puts both in CherLight Pool
Satellite Separation: ~25 km – 1000+ km - Dt = 3 hr: 8 – 15 times
Satellite Position: 1 m (knowledge) - Dt = 24 hr: 90 times
Pointing Resolution: 0.1∘
Pointing Knowledge: 0.01∘
Slew Rate: 8 min for 90 ∘
Satellite Wet Mass: 3860 kg
Power: 1250 W (w/contig)
Data: < 1 GB/day
Data Storage: 7 days
Communication: S-band
Clock synch (timing): 10 nsec
Operations:
- Each satellite collects data autonomously
- Coincidences analyzed on the ground Dual Manifest Atlas V
- View the Earth at near-moonless nights,
charge in day and telemeter data to ground
- ToO Mode: dedicated com uplink to re-
orient satellites if desired
6-Jul-21 29th JEM-EUSO International Collab Meeting - vCSM 14POEMMA UHECR Performance: Stereo Reconstructed Angular Resolution
HiRes Stereo Observation
Stereo Reconstructed Zenith Angle Resolution
Stereo Geometric Reconstruction
- Intersection of EAS-detector planes
accurately defines the EAS trajectory
- Requires minimum opening angle
between planes ≳ 5∘
- With track selection → 80%
50 EeV simulated event reconstruction efficiency
- FoVPIX = 0.084∘ coupled with small
RMS spot size allows for precise Stereo Reconstructed Azimuth Angle Resolution
determination
6-Jul-21 29th JEM-EUSO International Collab Meeting - vCSM 40 EeV 15POEMMA: UHECR Performance: see PhysRevD.101.023012
Significant increase in exposure with all-sky coverage
Uniform sky coverage to guarantee the discovery of UHECR sources
Spectrum, Composition, Anisotropy: ECR > 20 EeV
Very good energy (< 20%), angular (≲ 1.2∘), and composition
(sXmax ≲ 30 g/cm2) resolutions TA 2019
38 POEMMA Nadir 5yr North
10
80 1 IceCube all-flavor (HESE) POEMMA Limb 5yr North
14 10
Duty Cycle Weighted ν-Aperture [km sr]
IceCube ντ (HESE)
E J / (eV km sr-1 yr-1)
2
ο
POEMMA-Limb 70 Δφ = 360 (εDC = 0.2)
12 ο
POEMMA/Auger2019
0 Δ = 30 (εDC = 0.2)
10
POEMMA/TA2019
60
-1
10
37
2
50 -1
10
8 10
40
3
6
-2
30 10 Auger 2020
POEMMA Nadir 5yr South
4
JCAP0
POEMMA-Stereo 20 36 POEMMA Limb 5yr South
10
-3
2 10 19.2 19.4 19.6 19.8 20 20.2 20.4 20.6 20.8 21
10
lg(E/eV)
JC
0 0
Olinto_2021_J._Cosmol._Astropart._Phys._2021_007
6 7 8 9 10 11
19.0 19.2 19.4 19.6 19.8 20.0 20.2 20.4 20.6 20.8 21.0 10 10 10 10 10 10
E [GeV]
Figure 6-Jul-21
6. Left: differential
Log(E/eV)
exposure as 29th
a function of declination
JEM-EUSO International Collab Meeting
ν
for five years of POEMMA operations
- vCSM 16 τPOEMMA: UHECR Composition
Spectrum, Composition, Anisotropy: ECR > 20 EeV
Very good energy (< 20%), angular (≲ 1.2∘), and composition (sXmax ≲ 30 g/cm2) resolutions
900
Auger FD ICRC19 on 70
880
POEMMA Nadir 5 yr
prot
proton
Michael Unger Work:
860 60 - Based on ad hoc model
840 extrapolating Auger
σ(Xmax) [g/cm2]
50
〈Xmax〉 [g/cm2]
820 measurements below 40
800 40 EeV.
- Around 100 EeV,
780 30
POEMMA Xmax
760
iron 20 uncertainty 0.1 – 0.2 p-Fe
740 iron separation → several
10
JCAP06(
720 EPOS-LHC Sibyll2.3c QGSJetII-04 energy points above 40
700 19 0 EeV by POEMMA will
10 1020 1019 1020
E [eV] E [eV] determine composition
Olinto_2021_J._Cosmol._Astropart._Phys._2021_007 evolution.
Figure 7. CapabilityJCAP of POEMMA
Referee: it isto measure that
advertised ÈXmax Í and scenarios/models
different ‡(Xmax ) for composition studies at it would be
can be distinguished},
UHEs. The width of goodthe blue band illustrates
to illustrate the expected
the prediction statistical
of such models in Figuncertainties in fivethe
7. This will allows years of to judge the
reader
POEMMA-Stereo (nadir) operations given the number of events per 0.1 in the logarithm of energy,
discrimination power of PEOMMA, given experimental uncertainties, indicated by the blue band.
the Xmax6-Jul-21
resolution and efficiency for ◊ < 70¶ , 29thandJEM-EUSO
the intrinsic shower-to-shower
International Collab Meeting - vCSM
fluctuations of 17
40 g/cm2 . The band spans the energy range for which more than 10 events are within a 0.1 decadePOEMMA: UHECR Sky Coverage (isotropic UHECR flux)
Significant increase in exposure with all-sky coverage
Uniform sky coverage to guarantee the discovery of UHECR sources
POEMMA Nadir 5 yr Auger SD 2030
POEMMA Limb 5 yr TAx4 SD 2030
105 lg(E/eV):
(km2 yr)
21.0
20.3
d⌦
dE
20.0
20.0
19.7
4
10
−1 −0.8 −0.6 −0.4 −0.2 0 0.2 0.4 0.6 0.8 1
sin
6-Jul-21 29th JEM-EUSO International Collab Meeting - vCSM 18this study.
models: photons and neutrinos.
It is worth noting that though many of the scenarios
POEMMA: UHECR Anisotropy Analysis see PhysRevD.101.023012
included in this study are very similar to the maximumli-
kelihood search parameters obtained by the Auger col- 1. Inelastic proton-air and proton-proton cross sections
laboration [103], the maximum TS values obtained from The showers absorbed in the atmosphere observed by
Auger Highlights Antonella Castellina our simulations may be somewhat different than expected POEMMA correspond to a calorimetric fixed target experi-
based on the maximum TS values obtained Auger. This is ment with E0 > 40 EeV. The collisions of the primary
15∘ Angular Spread, 10% StarBurst Fraction
40
Populations Composition scenarios
ArXiv:1909.10791
−8
Starburst galaxies A 10
35
γ -ray AGN No attenuation −7
10
Test statistic, TS = 2Δ ln L
Auger
Local p-value, P χ2 (TS,2)
30
−6
10
25
−5
10
20 −4
10
15 −3
10
POEMMA
10
10−2
5 10
−1
0 1
40 50 60 70 80
Threshold energy [EeV]
FIG. 24. TS profile for 1400 events for a particular scenario using the starburst source sky map in Fig. 23. In the scenario pictured here,
Figure 11: Left: Maximum likelihood-ratio as a function of energy threshold for the models based
the fraction of events drawn from the source sky map is f ¼ 10% (left) and 20% (right), and the angular spread is Θ ¼ 15°.
on SBGs and gAGNs. The results are shown in the attenuation (full line) and no-attenuation PERFORMANCE AND SCIENCE REACH OF THE PROBE OF … PHYS. REV. D 101, 023012 (2020)
(dashed line) scenarios. Right: Cumulated test statistics for Ethr = 38 EeV as a function of the
time ordered number of events (for the SBG-only model). The number of events at the time of [39] 023012-18
and of this conference are indicated
LUIS A.byANCHORDOQUI
the red arrows. et al. PHYS. REV. D 101, 023012 (2020)
likely due to the fact that certain catalogs contain powerful
TABLE II. TS values for scenarios with Θ ¼ 15°.
3. Hadronic interactions sources in regions of the sky that are not accessible by
Catalog fsig TS σ Auger. The impact is that in simulations in which we
The interpretation of theSBG
experimental observables
5% in terms of 6.2
primary composition
2.0 is prone
assume the same signal fraction as found by Auger, the
to systematic uncertainties, mainly due to the lack of10%
knowledge on24.7 4.6
hadronic interactions signal events are now distributed over more sources,
at ultra-
15% 54.2 7.1 spreading
high energies. On the one hand, additional data from 20% collider and fixed-target 9.4
92.9 experiments are out the anisotropic events over a wider portion
of the sky and making each individual source less signifi-
needed to lower these uncertainties.
2MRS
On the other hand,
5%
the interactions
2.4
of primary1.0cosmic rays
cant. Thein result is that the TS values obtained from the
the atmosphere can be exploited to study the hadronic 10%interaction models
8.7 in a kinematic
2.5 and en- may beFIG.
simulations 23. Left:lower
somewhat Skymapthan of nearby starburst
expected, galaxies from Refs. [35,103] weighted by radio flux at 1.4 GHz, the attenuation factor
per-
ergy region not accessible by human-made accelerators.15% Indeed, exploiting
20.0 Auger4.1data, haps even lower than Auger found. This is most noticeable through propagation, and the exposure of POEMMA. The map has been smoothed
we reach
accounting for energy losses incurred by UHECRs
p using a von Miser-Fisher distribution with concentration parameter corresponding to a search radius of 15.0° as found in Ref. [35]. The
20% 35.2 5.6 in and
the starburst scenario
center-of-mass energies up to s ⇠ 400 TeV, more than 30 times those attainable at LHC ex- color with simulation
scale indicates F src , parameters
the probabilityfdensity
sig ¼ of the source sky map, as a function of position on the sky. The white dot-dashed line
Swift-BAT AGN 5% 10.4 2.8 10% and Θ ¼ 15°. indicates
The Auger exposure
the supergalactic map
plane. does
Right: Samenot
as at left for nearby galaxies from the 2MRS catalog [105] and weighting by K-band flux
plore interactions in the very forward region of phase space on targets of hAi ⇠ 14. include M82, a nearby powerful
corrected starburst
for Galactic extinction.galaxy, that
10% 39.6 6.0
The shower development depends on many different15% features of the82.4
hadronic interactions.
8.8 In par-
would be included in our simulations. The result is that
collecting the electromagnetic radiation 20%
ticular, by 6-Jul-21 emitted by the 139.3
shower29th 11.6 crossing
particles the TS value predicted
the
JEM-EUSO International 2. by
Collab the simulations
Intermediate-scale
Meeting - vCSM (24.7; signifi-
anisotropy searches through achieving 5σ discovery reach for search19 parameters within
cance
atmosphere and its depth of maximum development Xmax , we get information about the first inter- ∼4.6σ) is somewhat lower than the
cross-correlations TS value
with reported
astrophysical catalogs the vicinity of the signal regions for anisotropy hints
by Auger (29.5; post-trial significance ∼4.5σ). However, if reported by the Auger [35,103] and TA [34] collaborations.POEMMA: Air fluorescence Neutrino Sensitivity
Excellent angular resolution → accurate determination of slant depth of EAS starting point
https://www.mpi-hd.mpg.de/hfm/CosmicRay/ShowerDetection.html 100 EeV UHECR protons
Prob(XSRT ≥ 2000 g/cm2)
zenith
≈ 10-4
azimuth
UHECR 100% proton assumption
50 EeV simulated event most conservative 20
6-Jul-21 29th JEM-EUSO International Collab Meeting - vCSMPOEMMA: Air fluorescence Neutrino Sensitivity: see PhysRevD.101.023012
Effectively comes for free in stereo UHECR mode For En ≳ 1 PeV, sCC & sNC virtually identical for n & nbar
Assumptions:
- CC ne : 100% En in EAS
- CC nµ & nt : 20% En in EAS (gctt ≈ 5000 km)
- NC ne & nµ & nt : 20% En in EAS
UHECR Background Probabilities (1 event in 5 years):
- Auger Spectrum (100% H): < 1%
- TA Spectrum (100% H): ≈ 4%
Solid
BDG2014
Dashed
GQRS1998
6-Jul-21 29th JEM-EUSO International Collab Meeting - vCSM 21POEMMA Tau Neutrino Detection:
scaled by energy as see
a functionPhysRevD.100.063010
FIG. 11. The five lower histograms show the exiting tau flux
of tau energy for cosmogenic
neutrino flux 1 [18] and for fixed values of the 19 angle of the
trajectory relative to the horizon βtr . The ALLM tau energy loss
High-Energy Astrophysical that
Events generates
For the purposes of this study, we have assumed
the neutrino burst will be closely coincident inis used, along with the standard model neutrino cross
model
time and space with the event and/or other section.
neu- The uppermost histogram shows the incident tau neutrino
neutrinos (ne,nµ) and 3 neutrino flavors
tral messengers, reach
such as gamma Earth
rays or gravitational
waves. Murase and Shoemaker [153] recently flux scaled
ex- by a factor of 1=10.
via neutrino oscillations. plored possible time delays and angular signatures in
the neutrino signal resulting from beyond SM inter-
POEMMA designed to observe neutrinos with EWe>note,
actions between high-energy neutrinos and the cos-
mic neutrino background and/or dark matter par- however, that we use stochastic energy loss rather
than hdE at τ =dXi ¼ −bτ E for the tau energy loss to better
20 PeV through Cherenkov⇠respectively)
signal
10 PeV or ⇠of EASs from
ticles. In POEMMA’s energy range (beginning
30 PeV in stereo and dual modes,
and at the neutrino horizonmodel
distancesthe exiting tau energy after transport through the
Earth-emerging tau decays.these types of interactions to be minuscule;column
calculated in this paper, we expect the e↵ects from depth X.
however,
tau
we note that any time delay in the neutrinoBelow E GeV,area there isdisk
little
on thedifference in the
FIG. ¼ 10. 10 8
The e↵ective (dashed figure)
burst τ
for a ⌧ -lepton air shower that begins a path length s from
n
exiting tauthefluxes
would be helpful to POEMMA by providing more
time for re-pointing and re-positioning the satellites
point offor a fixed
emergence incident
on the Earth. The neutrino
local zenithflux because
for the ToO observation.
FIG. 10. Upper panel: The ratio of the outgoing tau flux to the ta u
the main feature is that angle
shows the emergence tausofarethe ⌧produced
-lepton ✓ .
tr
in the final few
angle of the line of sight, of distance v, is ✓v . The inset
incident neutrino flux, at the same energies, for fixed
Acknowledgements values of the kilometers before exiting the Earth. The predicted tau
angle of the trajectory relative to the horizon βtr for cosmogenic Fig. 10 is exaggerated for clarity.
flux 1 [18]. The ALLM tau energy loss We model
wouldislike
used, along
to thank with Ojha and Eliza-
Roopesh
beth Hays for helpful discussions about AGNs and
the standard model neutrino cross section.
ToOs. WeThewould
solidalsohistograms
like to thank Francis Halzen
include regeneration, while the dashedandhistograms do not. Lower
panel: Diffuse
Justin Vandenbroucke for helpful discussions of
As in the upper plot, for flux IceCube’s
4. e↵ective area and sensitivity. We would
similarly like to thank Olivier Martineau-Huynh for
Flux helpful discussions of the GRAND200k’s e↵ective
area and Foteini Oikonomou for a careful read-
few times 10 GeV, and for small
8 ing angles ∼1°–5°,
of the manuscript andabove
helpful comments. We
would also like to thank Kyle Rankin (New Mex-
E ∼ 109 GeV. This can be seen ico in State
a comparison
University) for of the analytic and
performing
GMAT flight dynamics calculations used to quan-
upper and lower panels of Fig. 10. tify the satellite separation maneuvers. We would
In Fig. 11, we show EFτ ðEÞ rather than
also like the transmission
to thank our colleagues of the Pierre Auger
and POEMMA collaborations for valuable discus-
function for flux 1 to illustrate thesions.
difference
This work in the energy
is supported in part by US Depart-
behavior of exiting τ-leptons compared
ment of to
Energy incident
grant tau NASA grant
DE-SC-0010113,
17-APRA17-0066, NASA awards NNX17AJ82G and 100 km
neutrinos. The figure comes from 80NSSC18K0464,
using the ALLM energy
and the U.S. National Science FIG. 11. The exit probability for a ⌫⌧ of a given energy
to emerge as a ⌧ -lepton as a function of elevation angle
loss model, again for fixed angles βtr relative to the horizon.
Foundation (NSF Grant PHY-1620661).
tr .
The much larger incident isotropic tau neutrino flux is
For ⌧ -lepton air showers, it is common to use the
scaled by a factor of 1=10. local elevation angle to describe the trajectory rather
The energy loss model makes Appendix
some difference
A: POEMMAin the
detection forFIG. 12. International
< 35 The
than exiting
the local tau flux
zenith scaled
angle. by- energy
The elevation as a function of
angles,
6-Jul-21 29th JEM-EUSO tr
Collab Meeting vCSM 22
predictions. In Fig. 12, the ALLM model tau energy for flux
labeled with1 ,[18],
are for
defined fixed values
by angles of
relative to the
the angle of the
Many of results
the detailsare shown
required for the evaluation of local tangent plane, e.g., tr = 90 ✓tr .FIG. 11. The five lower histograms show the exiting tau flux
scaled by energy as a function of tau energy for cosmogenic
POEMMA Transient Neutrino Detection
neutrino flux 1 [18] and for fixed values of the angle of the
trajectory relative to the horizon βtr . The ALLM tau energy loss
model is used, along with the standard model neutrino cross
section. The uppermost histogram shows the incident tau neutrino
flux scaled by a factor of 1=10.
We note, however, that we use stochastic energy loss rather
than hdEτ =dXi ¼ −bτ E for the tau energy loss to better
EUSO-SPB2 Work by M.H
model the exiting tau energy after transport through the
column depth X.
Flight Dynamics/Propulsion:
- 300 km ⟹ 25 km SatSep
Reno, T. Venters, and JFK
Below Eτ ¼ 108 GeV, there is little difference in the
exiting tau fluxes for a fixed incident neutrino flux because
the main feature is that taus are produced in the final few
(see ICRC21 presentations)
FIG. 10. Upper panel: The ratio of the outgoing tau flux to the
- Puts both in CherLight Pool incident neutrino flux, at the same energies, for fixed values of the
angle of the trajectory relative to the horizon βtr for cosmogenic
kilometers before exiting the Earth. The predicted tau
- Dt = 3 hr: 8 – 15 times flux 1 [18]. The ALLM tau energy loss model is used, along with
the standard model neutrino cross section. The solid histograms
- Dt = 24 hr: 90 times include regeneration, while the dashed histograms do not. Lower
panel: As in the upper plot, for flux 4.
few times 108 GeV, and for small angles ∼1°–5°, above
E ∼ 109 GeV. This can be seen in a comparison of the
upper and lower panels of Fig. 10.
In Fig. 11, we show EFτ ðEÞ rather than the transmission
~vsat function for flux 1 to illustrate the difference in the energy
behavior of exiting τ-leptons compared to incident tau
neutrinos. The figure comes from using the ALLM energy
loss model, again for fixed angles βtr relative to the horizon.
The much larger incident isotropic tau neutrino flux is
scaled by a factor of 1=10.
The energy loss model makes some difference in the FIG. 12. The exiting tau flux scaled by energy as a function of
predictions. In Fig. 12, the ALLM model results are shown tau energy for flux 1 [18], for fixed values of the angle of the
with the solid histograms while the dashed histograms are trajectory relative to the horizon βtr . The ALLM tau energy loss
model is shown with the solid histograms, while the BDHM
results using the BDHM model for tau electromagnetic
energy loss model is shown with the dashed histograms, in both
S ~
usat energy loss, both with standard model (SM) neutrino- cases with the neutrino cross section taken to be σ SM . The band
nucleon cross section. The parameter bnuc τ ðEÞ evaluated shows the minimum and maximum values of the energy-scaled
↵ ↵c using BDHM is smaller than for ALLM, so tau energy loss at
high energies is smaller for BDHM than ALLM evaluations.
flux when the BDHM energy loss and neutrino cross section, as
well as the ALLM energy loss and neutrino cross sections, are
~nd This effect accounts for the difference at high energies. considered.
Field of view
↵o↵
063010-9
✓e
Figure 14. Left: Illustration of the geometrical configuration in the orbital plane (satellite position,
uAvionics on each POEMMA satellite allow for
~sat , versus satellite velocity ~
vsat ). The satellite is located at point S. The arrival direction of an EAS
slewing : 90 in 500 sec
generated by a ⌫⌧ is characterized
∘ by its Earth emergence angle ✓e and the corresponding angle away
from the limb in the point of view of the satellite. The detector has a conical FoV of opening angle
↵c , with an o↵set angle ↵o↵ (away from the Earth limb) and pointing direction n~d . Right: Cherenkov
viewing angle 6-Jul-21
below the limb versus Earth emergence angle ✓e [84]. 29th JEM-EUSO International Collab Meeting - vCSM 23POEMMA ToO Neutrino Sensitivity: see PhysRevD.102.123013
Short Bursts: 17% hit for ignoring t → µ channel Long Bursts:
- 500 s to slew to source after alert - 3 to 24+hr to move SatSep to 50 km
- 1000 s burst duration - Burst duration ≳ 105 s (models in plot)
- Source celestial location optimal One orbit sky exposure assuming - Average Sun and moon effects
- Two independent Cher measurements slewing to source position - Simultaneous Cher measurements
- 300 km SatSep - 50 km SatSep
- 10 PE threshold (time coincidence):
1.0
- 20 PE threshold: 2.72e-01
- AirGlowBack
TONIA M. VENTERS et< al.
10-3/year - AirGlowBack
PHYS. REV. D 102, 123013
0.5
(2020) < 10-3/year 2.26e-01
TONIA M. VENTERS et al.
Fractional exposure
1.81e-01
sin(Dec)
0.0
1.36e-01
9.05e-02
°0.5
4.53e-02
°1.0 0.00e+00
0 1 2 3 4 5 6
RA (rad)
IceCube, ANTARES, Auger Limits for
NS-NS merger GW170817
6-Jul-21 Kimura, Murase, Mészáros, Kiuchi 29th JEM-EUSO International Collab Meeting - vCSM 24
FIG. 4. The POEMMA all-flavor 90% unified confidence level FIG. 2. The POEMMA all-flavor 90% unified confidence levelPOEMMA ToO Neutrino Sensitivity: see PhysRevD.102.123013
POEMMA’S TARGET-OF-OPPORTUNITY SENSITIVITY TO … PHYS. REV. D 102, 123013 (2020)
FIG. 7. Left: sky plot of the expected number of neutrino events as a function of galactic coordinates for POEMMA in the long-burst
scenario of a BNS merger, as in the Fang and Metzger model [22], and placing the source at 5 Mpc. Point sources are galaxies from the
2MRS catalog [78]. Middle: same as at left for IceCube for muon neutrinos. Right: same as at left for GRAND200k. Areas with gray
point sources are regions for which the experiment is expected to detect less than one neutrino.
FIG. 8. Left: sky plot of the expected number of neutrino events as a function of galactic coordinates for POEMMA in the best-case
short-burst scenario of an sGRB with moderate EE, as in the KMMK model [17], and placing the source at 40 Mpc. Point sources are
galaxies from the 2MRS catalog [78]. Middle: same as at left for IceCube for muon neutrinos. Right: same as at left for GRAND200k.
Areas with gray point sources are regions for which the experiment is expected to detect less than one neutrino.
6-Jul-21 29th JEM-EUSO International Collab Meeting - vCSM 25POEMMA ToO Rate of Detection: see PhysRevD.102.123013
POEMMA’S TARGET-OF-OPPORTUNITY SENSITIVITY TO … PHYS. REV. D 102, 123013 (2020)
TONIA M. VENTERS et al. PHYS. REV. D 102, 123013 (2020)
which is restricted to the rotation speed of the Earth. With 1.0
TABLE IV. Average expected numbers of neutrino thisevents
combination
above Eν > 107 GeV of capabilities,
detectable by POEMMA POEMMA willofbe able
for several models
transient source classes assuming source locations at the GC and at 3 Mpc. The horizon distance for detecting 1.0 neutrino per ToO event
access>103 tos are∼21% oflong
the sky inwith
500 s (∼37%durations in s are s) [56],
3
is also provided. Source classes with observed durations classified as bursts. Those observed ≲1010
3
a those
classified as short bursts. Models in boldface type are keymodels advantage
for which POEMMAoverhasGRAND200k
≳10% chance of observing ina ToO
terms
during of sky 0.8 .
the proposed mission lifetime of 3–5 years. Models in italics are the same but for a mission lifetime of 10 years. um
coverage on such short time scales. i g hL
H *
Long bursts H- rA
BB i Sg
As in Fig.Largest
7, holes in the IceCube and GRAND200k sky Lu m
Prob. (>= 1 ToO)
No. of ν’s No. of ν’s distance E-
TD
Source class at GC plots in Fig.for81.0ν
at 3 Mpc appear
per eventwhere the experiment
Model reference has limited or 0.6 BN
S
TDEs 1.4 × 10 no effective
5 0.9 area and/or exposure
3 Mpc Dai and Fangfor
[18] the range of energies
average
TDEs 6.8 × 10⁵ 4.7 7 Mpc Dai and Fang [18] bright
TDEs 2.7 × 10⁸ in 1.7 which
× 103 it can 128detect
Mpc neutrinos Lunardinifrom the [19]
and Winter source
M SMBHmodel.
¼ In
5 × 10⁶ M ⊙ Lumi scaling model
TDEs 7.7 × 10⁷
this 489scenario, a69 hole Mpc
in the southern celestial sphere for
Lunardini and Winter [19] Base scenario 0.4 m.
IceCube appears because the range of energies in which it w Lu
- Lo
a a
Blazar flares NA NA 47 Mpc RFGBW [20]—FSRQ proton-dominated
advective escape model BBH
lGRB reverse shock (ISM) 1.2 × 10⁵ can detect0.8 neutrinos
3 Mpc for the KMMK
Murase [16] model is smaller than
lGRB reverse shock (wind) 2.5 × 10⁷ that 174 for the Fang 41 Mpc and Metzger
Murase [16] model at the distances
BBH merger 2.8 × 10⁷ 195 43 Mpc
considered (cf. Figs. 2 and fluence
Kotera and Silk [21] (rescaled) Low
4). Even considering the best- 0.2 s eline
TDE Ba
BBH merger 2.9 × 10⁸ 2.0 × 10³ 137 Mpc Kotera and Silk [21] (rescaled) High
case scenarios for IceCube fluence and GRAND200k, POEMMA
BNS merger 4.3 × 10 has a30distinct advantage
6
16 Mpc inFang
detecting
and Metzgerthese
[22] types of short- sGRB (EE)
0.0
BWD merger 25 0 38 kpc XMMD [23]
burst0 events. Not 109 kpconly will POEMMA be sensitive to
Newly born Crablike pulsars (p) 190 Fang [24]
0 5 10 15
Newly born magnetars (p)
Newly born magnetars (Fe)
2.5 × 10⁴
5.0 × 10⁴
neutrinos
0.2
0.3
from 2 the
1 Mpc
Mpc
entire Fangsky[24](compared with ∼50% for
Fang [24]
Mission Time [yrs]
IceCube and ∼81% for GRAND200k), POEMMA can
expectShort see more neutrinos (maximum number of ∼10
to bursts FIG. 9. The Poisson probability of POEMMA observing at
No. of ν’s No. of ν’s Largest distance
Source class events
at GC vs ∼5 at 3 for
Mpc IceCube and
for 1.0ν per ∼6
event for GRAND200k).
Model reference For least one ToO versus mission operation time for several modeled
sGRB extended emission (moderate) 1.1the
× 108higher threshold800 of ∼690 neutrinos,
Mpc POEMMA
KMMK [17] will be source classes. Featured source models are TDEs from Lunardini
a
Not applicable due to a lack of known blazarsable within to
100 achieve
Mpc. this level in ∼49% of the sky, compared and Winter [19], BNS mergers from Fang and Metzger [22], BBH
with ∼0% for IceCube and ∼2% for GRAND200k. mergers from Kotera and Silk [21], and sGRBs with moderate EE
for a discussion of the additional source classes, see e.g., [96,97]. As demonstrated by Swift J1644 þ 57, some
from KMMK [17].
Appendix E). We should note that our list of sources TDEs result in powerful, relativistic jets [98–100]. With the
and corresponding models is not intended to be an C.abundance
Probability
of baryonsof ToOs
from for modeled
the disrupted stellar material,
6-Jul-21list or present a complete characterization of
exhaustive jetted 29th
astrophysical JEM-EUSO
TDEs are naturalneutrino International
candidates forsources Collab Meeting - vCSM
proton and nuclei include the average impacts of the Sun and the 26Moon
the sources in question. Several of the source classes have accelerators, possibly capable of reaching ultrahigh ener-
and hence, provide a reasonable estimate of POEMMA’sPOEMMA Summary 15
POEMMA is designed to open two new Cosmic Windows: 1038
TA ICRC17
POEMMA Nadir 5yr North
Auger2017 flux
Auger2017 90% U.L.
E3 J / (eV2 km-1 sr-1 yr-1)
- UHECRS (> 20 EeV), to identify the source(s) of these
38
POEMMA Limb 5yr North 10 POEMMA Nadir 5 yr 90% U.L.
E3 J / (eV2 km-1 sr-1 yr-1
POEMMA Limb 5 yr 90% U.L.
extreme energy messengers UHECRs Cherenkov nt
- All-sky coverage with significant increase in exposure Response 37
10
1037
- Stereo UHECR measurements of Spectrum,
1 mass EPOS-LHC (UL)
1 mass Sibyll2.3c (UL)
1 mass EPOS-LHC (BF)
Composition, Anisotropy ECR ≥ 50 EeV Auger ICRC17 diffuse 1 mass Sibyll2.3c (BF)
gal. mix EPOS-LHC (BF)
POEMMA Nadir 5yr South
- Remarkable energy (< 20%), angular (≲ 1.2∘),
36 gal. mix Sibyll2.3c (BF)
10
POEMMA Limb 5yr South
36
10
and composition (sXmax ≲ 30 g/cm2) resolutions 19.2 19.4 19.6 19.8 20 20.2 20.4 20.6 20.8
lg(E/eV)
21 19.6 19.8 20 20.2 20.4 20.6 20.8 21
lg(E/eV)
- Leads to high sensitivity to UHE neutrinos (> 20 EeV)
via stereo air
FIG.fluorescence
19: Left: Energy spectrummeasurements Work in Progress:
of UHECRs as measured by TA and Auger in the Northern and Southern hemisphere respectively.
The energy scale of the two experiments were cross-calibrated by ±5.2% as derived by - theAwaiting
UHECR Spectrum Results
Workingfrom
Group Astro2020 regarding NASA
- Neutrinos from atviewing
astrophysical
low energies. Red and Transients (>
blue dots with error 20 PeV)
bars illustrate the expected accuracy reached with POEMMA in stereo and limb-
mode within 5 years of operation. Right: Flux suppression at UHE as measured by Probe
the Pierrerecommendation
Auger Observatory (data and NASA implementation.
- Unique sensitivity
points) [7]. to short- & long-lived transient
90% confidence upper limits of the flux at UHE are shown as downward
account event migration due to the limited energy resolution of the observatories). Black:
triangles
- Group
(ideal
Pierre Auger
limits without
isObservatory
taking
building2017,
into
upon
red: POEMMA neutrino studies
events withPOEMMA
‘full-sky’ 5 year coverage
stereo mode, blue POEMMA 5 year limb-viewing mode. Various model predictions for the shape of the flux
suppression from [82] are superimposed as black lines. investigating focused neutrino missions
- Highlights the low energy neutrino threshold nature - nSpaceSim: Neutrino Simulation work continue
of space-based opticalAuger Cherenkov method, roeven with70
900
880
FD ICRC17
p t
on under funded NASA-APRA grant: Goal to develop
duty cycle of order 860
~20%POEMMA Nadir 5 yr
60 robust end-to-end neutrino simulation package for
proton
- POEMMA sensitivity840to SHDM → n’s in 20+ PeV space-based and sub-orbital experiment: optical
σ(Xmax) [g/cm2]
〈Xmax〉 [g/cm2]
50
(Cherenkov) and 20+820EeV (fluorescence) energy bands Cherenkov and radio signals.
40
- EUSO-SPB2 (with Cherenkov Camera) under
800
- C. Guepin et al.:780arXiv:2106.04446)
6-Jul-21 29th JEM-EUSO International 30 Collab Meeting - vCSM 27
760
development to ULDB fly in 2023.
on 20EUSO-SPB2: Sources of Cherenkov Signals
Detailed CT response
Above-the-limb: UHECR
E&M and muon EAS
Cherenkov
Reflected UHECR
Cherenkov Star Signals
Aniton
Cherenkov
Diffuse and ToO
nt Cherenkov
6-Jul-21 29th JEM-EUSO International Collab Meeting - vCSM 28
7/5/21 XIX Workshop Neutrino Telescopes 28BackUps 6-Jul-21 29th JEM-EUSO International Collab Meeting - vCSM 29
POEMMA: proton-Air Cross Section Measurements
LUIS A. ANCHORDOQUI et al.                                                                                                           PHYS. REV. D 101, 023012 (2020)
                                                                                                                                                                       Assuming 1400 UHECRs for ECR ≥ 40 EeV
                                                                                 Equivalent c.m. energy spp [TeV]
                                                                           −1                                                                2
                                                                         10                       1                   10                 10
                                                      800

                                                                                            0.9TeV     2.36TeV    7TeV 13TeV
                                                      700
                                                                                                           LHC
                    Cross section (proton-air) [mb]

                                                      600              POEMMA (p:N=1:9, η=0.02)

                                                                       POEMMA (p:Si=1:3, η=0.13)
                                                      500

                                                      400                                                                            Nam et al. 1975
                                                                                                                                     Siohan et al. 1978
                                                                                                                                     Baltrusaitis et al. 1984
                                                      300                                                                            Mielke et al. 1994
                                                                                                                                     Knurenko et al. 1999
                                                                                                            QGSJet01c
                                                                                                                                     Honda et al. 1999
                                                                                                            QGSJetII.3
                                                      200      Accelerator data (p-p) + Glauber                                      Belov et al. 2007
                                                                                                            Sibyll 2.1               Aglietta et al. 2009
                                                               LHC - TOTEM                                  Epos 1.99                Aielli et al. 2009
                                                      100                                                   Epos LHC                 Telescope Array 2015
                                                               LHC - ATLAS/ALFA                             QGSJetII.4               Auger 2015

                                                        0 11                    13                    15         16              18              19        20
                                                         10     1012       10        1014         10         10          1017   10          10          10
                                                                                                  Energy [eV]

FIG. 26. Potential of a measurement of the UHE proton-air cross section with POEMMA. Shown are also current model predictions
and a complete compilation of accelerator data converted to a proton-air cross section using the Glauber formalism. The expected
uncertainties for two composition scenarios (left, p∶N ¼ 1∶9; right, p∶Si ¼ 1∶3) are shown as red markers with error bars. The two
points are slightly displaced in energy for better visibility.

   Since the measurement is entirely focused on the                                                        correspond to the p:N=1∶9 and the right point to
            6-Jul-21
exponential slope of the tail the expected Gaussian detector                                               p∶Si29th JEM-EUSO
                                                                                                                ¼ 1∶3  protonInternational Collab Meeting
                                                                                                                               fraction scenarios.   The - vCSM
                                                                                                                                                           analysis                                 30
resolution on the order of 35 g=cm2 in Xmax and 0.2 in                                                     described here is not yet optimized for the actual
POEMMA: UHECR Spectra:
POEMMA Nadir 5yr POEMMA Nadir 5yr
POEMMA Limb 5yr POEMMA Limb 5yr
3 3
10 Auger 2030 10 TA 2030
events/(0.1 dex)
events/(0.1 dex)
102 102
10 10
1 1
19.2 19.4 19.6 19.8 20 20.2 20.4 20.6 19.2 19.4 19.6 19.8 20 20.2 20.4 20.6
lg(E/eV) lg(E/eV)
Figure 10. Left: number of UHE events detected by POEMMA for five years of observations in
Olinto_2021_J._Cosmol._Astropart._Phys._2021_007
POEMMA-Stereo (red) and POEMMA-Limb (blue) operational modes assuming the Auger UHECR
energy spectrum. For comparison, the projected event numbers for Auger observations projected to
2030 are
6-Jul-21indicated by black dashed lines. Right:
29th JEM-EUSO number
International of -UHE
Collab Meeting vCSM events detected by POEMMA
31 for
five years of observations in POEMMA-Stereo (red) and POEMMA-Limb (blue) operational modesPOEMMA: Air fluorescence Neutrino Sensitivity is Robust
BIBLIOGRAPHY 37
BIBLIOGRAPHY UHECR observed proton background probabilities as a function
arXiv:1805.01902 [astro-ph.HE]. I
of energy and observed XSTART
[44] L. A. Anchordoqui, G. E. Romero, and
based on 5 year observation with
J. A. Combi,
the Auger
“Heavy nuclei atandthe endTAofmeasured
the cosmic ray spectra.
spectrum?,”
1500 g/cm2 TABLE VIII: UHECRPhys. observed proton background probabilities
Rev. D60 (1999) 103001, arXiv:astro-ph/9903145
as a function of energy and XStart based on 5 y
with the Auger and TA measuredI spectra.
[astro-ph].
[45] L. A. Anchordoqui,
XStart “Acceleration
40 EeV of ultrahigh-energy
60 EeV 100 EeV 200 EeV Sum
cosmic rays in starburst superwinds,” Phys. Rev. D97
2000 g/cm2 no. 6, (2018) 063010,
2 arXiv:1801.07170
Auger Spectrum: NObs 1
1500 g/cm 1.5 ⇥ 10 4 1.9 ⇥ 10 2 3.8 ⇥ 10 2 4.5 ⇥ 10 3 6.1 ⇥ 10 2
[astro-ph.HE].2
7 ⇥ 10 3 for 7.2 ⇥ 10 3 1.0 ⇥ 10 3 9.6 ⇥ 10 3
[46] L. A.2000 g/cm
Anchordoqui 2.8
and⇥J. 10F. Soriano,1.3 “Evidence
UHECR origin in starburst galaxies,” AugerinSpectrum:
36th NObs 2
2 8 4
International
1500 g/cm Cosmic1.2Ray⇥Conference
10 (ICRC
1.9 ⇥ 10 7.1 ⇥ 10 4
2019) Madison, 1.0 ⇥ 10 5 9.1 ⇥ 10 4
15% difference Wisconsin, USA,2 July
2000 g/cm 3.924-August
⇥ 10 14 1, 2019. 8.4 ⇥2019.
10 7 2.6 ⇥ 10 5 5.3 ⇥ 10 7 2.8 ⇥ 10 5
arXiv:1905.13243 [astro-ph.HE]. TA I,Spectrum:
VA NObs 1
[47] E. Waxman, “Cosmological
2 gamma-ray
4 bursts2 and the
1500energy
highest g/cmcosmic 2.5 rays,”
⇥ 10 Phys. 6.4 ⇥Lett.
Rev. 10 75 1.7 ⇥ 10 1
(1995) 9.0 ⇥ 10 3 2.5 ⇥ 10 1
g/cm2 4.7 ⇥ 10 7
2000 arXiv:astro-ph/9505082
386–389, 4.4 ⇥ 10 3 I 3.5 ⇥ 10 2
[astro-ph]. 2.1 ⇥ 10 3 4.2 ⇥ 10 2
Ta Spectrum: NObs 2
[48] M. Vietri, “On the acceleration of ultrahigh-energy
2 8
cosmic
1500rays
g/cmin gamma-ray
3.0 ⇥ 10bursts,” 2.1 ⇥ 10 3J. 4531.6 ⇥ 10 2
Astrophys. 4.1 ⇥ 10 5 1.8 ⇥ 10 2
(1995) 883–889,
2000 g/cm2arXiv:astro-ph/9506081
1.0 ⇥ 10 13 6
9.8 ⇥ 10[astro-ph]. 6.3 ⇥ 10 4 2.1 ⇥ 10 6 6.4 ⇥ 10 4
[49] C. D. Dermer and A. Atoyan, “Ultrahigh energy cosmic
rays, cascade gamma-rays, and high-energy neutrinos
FIG. 43: Comparison of the instantaneous electron neutrino from gamma-ray bursts,” New J. Phys. 8 (2006) 122,
apertures based on stereo air fluorescence measurements.observation
Up- of arXiv:astro-ph/0606629
the Greisen-Zatsepin-Kuzmin n
UHECR Fake ‘s Background (1 event in 5 years):
[astro-ph]. [20] Pierre Auger Collaboration, A. Aab et al.
2
per points and curve are for XStart 1500 g/cm while the [50] Phys.
suppression,” X.-Y. Wang, - Auger Spectrum (100% H): < 1%
S. Razzaque,
Rev. Lett. 100 (2008)and P. Meszaros, “On the
101101, maximum of air-shower profiles at the P
lower points and curve are for XStart 2000 g/cm2 . The lower Origin and Survival
arXiv:astro-ph/0703099 [astro-ph]. I, V A of UHE Cosmic-Ray Nuclei in Observatory. I. Measurements at energie
curve is 85% of the upper curve over the energy band. GRBs and - TA Spectrum (100% H): ≈ 4%
Hypernovae,”
[11] Pierre Auger Collaboration, J. Abraham et al., Astrophys. J. 677 (2008) eV,” Phys. Rev. D90 no. 12, (2014)
432–440, arXiv:0711.2065 [astro-ph]. 32122005
“Observation of the suppression of the flux of cosmic arXiv:1409.4809 [astro-ph.HE]. V A
[51] K. Murase,
19 K. Ioka, S. Nagataki, and T. Nakamura,
6-Jul-21 rays above
29th 4 ⇥ 10
JEM-EUSO eV,” Phys.
International Rev.Meeting
Collab Lett. 101 (2008)
- vCSM [21] Pierre Auger Collaboration, A. Aab et al.
“High-energy cosmic-ray nuclei from high- and
061101, arXiv:0806.4302
low-luminosity gamma-rayVbursts
[astro-ph]. A and implications for maximum of air-shower profiles at the P
[36] Telescope Array Collaboration, R. U. Abbasi et al.,Over-the-Limb VHECR Cherenkov Observations 3 14
16
ing (below the limb) EAS. These combined e↵ects result
in bright signals which are strongly focused close to the
shower propagation axis.
As these events can be extremely bright, even for large
angles o↵ shower axis, it was necessary to consider also
the time spread of arriving photons at the plane of de-
tection, which can increase up to a few microseconds
when measured far o↵ axis, much greater than the typical
⇠ 20 ns integration time of the Cherenkov telescope de-
signs being investigated. This fact implies a reduction of
the estimated geometric aperture to above-the-limb cos-
mic ray events, with the larger e↵ect at the highest ener-
gies, where the exponential tails of the optical Cherenkov
spatial distribution become relevant.
Additionally, for shower development within a rari-
fied atmosphere (high altitudes), the distance scale corre-
sponding to a radiation length is much longer than that
at low atmospheric altitudes, allowing for more signifi-
cant geomagnetic deflection of electrons and positrons.
To consider the e↵ects of the geomagnetic field, we took
FIG. 1. Geometry of measuring the Cherenkov signal from the approach of applying a large (50 µT) field perpen-
cosmic rays arriving from above the Earth horizon in the case dicular to the shower propagation direction, and mea-
of a space based instrument. sured the flux profile of arriving Cherenkov photons along
the axes perpendicular and parallel to the magnetic field
compared with the profile of una↵ected showers (sym-
Modelling
above thethe
limbOptical Cherenkov
trajectories Signals
can be observed by Cosmic
inside the
viewing angle range 84.2 < ✓d < 90 ; while in the case of
metric about the shower axis). We demonstrated that the
e↵ect of applying a magnetic field to the developing EAS
Ray Extensive
POEMMA, being AiranShowers Observed
orbital instrument, from Sub-
the correspond- is to spread the optical Cherenkov photons within the
ing viewing angle range shrinks into 67.5 < ✓d < 70 . e↵ective Cherenkov angle away from shower axis along
Orbital and Orbital
We further note here Altitudes
that the viewable range for PO- the axis perpendicular to the magnetic field, thereby re-
EMMA will later decrease, limited by the amount of ducing the central intensity, but increasing the intensity
Cummings,
atmosphereA.
in L.; Aloisio,
which R.; can
cosmic rays Eser, J. Krizmanic,
interact. In this J. F. within the tails of the distribution. This approach pro-
regard, the range given here should be considered the FIG. 2. Cumulative slant depth as a function of altitude and vided an upper and lower bound on the e↵ect of magnetic
Submitted
maximum to PhysRevd:
geometrically arXiv:
allowable range.
FIG. 15. Integrated expected event rate (events measured
nadir viewing angle, as measured from 33 km altitude (up-
above given energy E) for above-the-limb UHECR events for
deflection, showing that, ultimately, it is a modest, fac-
tor of ⇠ 2, e↵ect on the Cherenkov intensity for a specific
The cumulative slant depth as a function of path length per panel) and 525 km altitude (lower panel). Calculations
the EUSO-SPB2 [upper panel] and POEMMA [lower panel]
Includes effects
traveled of geomagnetic
by a particle field on
through the atmosphere can upward-
be assume the US standard atmosphere [24].
instruments. Event rate is given per hour of live time (instru-
EAS energy and trajectory.
Using a Monte Carlo methodology, we showed that the
found by integrating the atmospheric density along the ment duty cycle not taken into account).
moving and
particle high-altitude
trajectory for a given EAS
detector viewing angle. estimated event rate of (above-the-limb) cosmic rays for
6-Jul-21
Assuming the standard US atmosphere [24], the slant
29th JEM-EUSO International Collab Meeting - vCSM
ment, the viewing angle range, corresponding to a signif- the EUSO-SPB2 and POEMMA instruments can be very 33
depth profiles for the observation altitudes of EUSO- icant amount of atmosphere V.
traversed (& 500g cm 2 ), is high. Specifically, as follows from figures 13 and 15, we
CONCLUSIONSYou can also read


