BLACK WOMEN IN THE UNITED STATES, 2014 - Progress and Challenges
←
→
Page content transcription
If your browser does not render page correctly, please read the page content below
BLACK WOMEN IN THE
 UNITED STATES, 2014
          Progress and Challenges
            50 Years After the War on Poverty
      50 Years After the 1964 Civil Rights Act
   60 Years After Brown v. Board of Education

      National Coalition on Black Civic Participation

                        Black Women’s Roundtable
                                i
                                        March, 2014
Acknowledgements
We would like to thank Rubie Coles, Associate Director/Program Director, Economic
Justice, The Moriah Fund, Anna Wadia, Program Officer at the Ford and Edna Kane-
Williams, Vice President of Multicultural Markets at AARP for their support of this
work. We thank the contributors of the report for your willingness to embark on this
endeavor.
                                        BWR Intergenerational Public Policy Network

                                         ii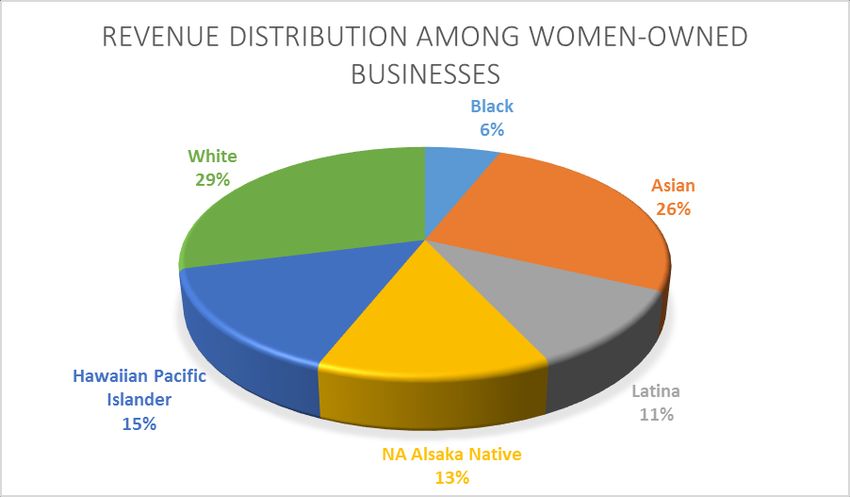
Table of Contents
Executive Summary……………………………………………………………...……….iii
Forward…………………………………………………………………….……….……ix
The State of Black Women’s Health………………………………………………….…..1
The Education of Black Women…………………………………………………………13
Black Women in the Economy…………………………………………………...….…..20
The Retirement Security of Black Women………………………………………...…….25
Black Women and Labor Unions………………………………………………......…….37
Black Women’s Exposure to Violence and the Criminal Justice System……….....……45
Black Women and Entrepreneurship…………………………………………….………51
Black Women and Politics………………………………………………………….……56
Black Women and Science, Technology, Engineering and Math (STEM)………...……61
Addendums
2014-2020 Power of the Sister Vote Civic Engagement and
Empowerment Strategy …………………………………………………………………67
What’s At Stake: A BWR Public Policy Agenda for 2014 & Beyond…………...…70
iii
Executive Summary
Black Women in the United States, 2014, is a groundbreaking report developed by the
Black Women’s Roundtable to assess the overall conditions of Black women in the U.S.
In these pages are the triumphs and tragedies surrounding Black Women’s lives across a
variety of different indicators and areas of inquiry. Here we examine virtually the full
spectrum of the Black woman’s contemporary experience in America. And though, we
find that on many accounts, significant progress has been made since key historical
markers such as the 1964 Civil Rights Act, Brown v. Board of Education, and the onset
of the War on Poverty, there are many areas that remain in need of dire national attention
and urgent action. The following are some of the key findings from this report.
Black Women’s Health Still in Need of Dire Attention
For Black women, having a baby can be deadly. The maternal mortality rate for
Black women is fully three times that of white women and is on par with several
developing nations. In fact, today, a woman in Lebanon has a much greater
likelihood of surviving childbirth than does a Black woman in America.
Breast cancer, long known to be deadlier for Black women than for their white
counterparts, was not found to be more lethal because Black women receive
mammograms less frequently. Instead, the breakdown occurs after diagnosis.
Black women experience lengthy delays in receiving follow up care and
treatment. In fact, five Black women die daily specifically due to disparities in
access to treatment for breast cancer.
Often thought of as a disease primarily impacting men, Black women have higher
rates of high blood pressure than any other demographic group in the nation.
Sixty Years Post-Brown, Education Still Separate, Still Unequal, Yet Black
Women Still Excel
While much recent attention has been focused on the degree to which Black boys
are impacted by the school-to-prison pipeline, Black girls too fall victim to a
startling degree. In fact, Black girls experience an out-of school suspension rate
fully 6 times that of white girls.
Just as their male counterparts, Black girls are three times more likely to attend
schools that don’t offer the full range of college preparatory courses, and where
most teachers fail to meet all state requirements for certification or licensures.
iv In spite of these challenges, over the past five decades, the high school graduation
rates of Black women have jumped 63%, virtually eliminating the gap with Asian
women (down to 2%), and significantly narrowing the gap with white women
(7%).
Though all women lead their male counterparts in college enrollment and degree
attainment, Black women do so at higher rates than any other group of women in
America. By 2010, Black women made up fully 66% of all Blacks completing a
Bachelor’s Degree, 71% of these completing a Master’s degree, and 65% of those
completing a Doctorate’s Degree.
Black Women Work, but Lag Behind in Pay
As they have from the beginning of their experience in America, Black
women lead all women in labor force participation rates. Even as mothers of
small children, Black women are overwhelmingly likely to work.
Yet, despite their strong work ethic, Black women remain behind
economically largely due to a doubly disadvantaged wage gap and over-
representation in low-wage fields.
In fact, Black women are more likely than any group in America to work for
poverty-level wages, thereby making them the most likely of all Americans to
be among the working poor.
No Golden Years for Black Women
Largely due to years of pay disadvantages, decreased access to employer-
sponsored pension plans, and a stunning lack of overall wealth accumulation,
Black women over 65 have the lowest household income of any demographic
group in America.
Black women too are especially at risk of poverty in their retirement years. In
fact, as retirees, Black women experience a poverty rate fully five times that
of white men (16% vs. 3%).
Due to lower marriage rates and higher divorce rates, Black women are much
less likely than other women to be eligible for Social Security Spouse or
Widow Benefits. In fact the number of Black women who do not qualify for
this benefit is double that of white women (34% vs. 14%).
v Still, Black women are especially reliant on Social Security in their retirement
years. In fact, if it were not for social security, the poverty rate for Black
women would more than double.
Labor Unions Make a Difference in the Working Lives of Black Women
Even though Unions have been under attack in recent years, Black women
have maintained a higher rate of unionization than other groups.
Black women who are covered under collective bargaining agreements make
higher wages and have greater access to benefits than women of all races or
ethnicities who are non-unionized.
Black Women Vulnerable to Violence and the Criminal Justice System
Black women are especially likely to be a victim of violence in America. In
fact, no woman is more likely to be murdered in America today than a Black
woman. No woman is more likely to be raped than a Black woman. And no
woman is more likely to be beaten, either by a stranger or by someone she
loves and trusts than a Black woman.
Though it is true that Black women remain more likely than any other group
of women in America today to go to prison, the incarceration rates of Black
women have declined tremendously in recent years. In fact, Black women’s
incarceration rate has fallen from six times that of white women, to now, three
times that of white women.
And while Black women distinctly understand the proliferation of tragedies
associated with Stand Your Ground legislation, we are reminded that in the
case of Renisha McBride and others, Black women too, can fall victim to
misplaced perceptions. But we also know through Marissa Alexander’s
experience that when the law is invoked due to the threat of an abuser,
prosecutors may hold different views on what is and is not deemed as
justifiable. In fact, in Stand Your Ground states, White women are far more
likely than Black women to be found justified and not even charged by
prosecutors when using deadly force against a Black attacker (13.5% vs.
5.7%).
viBlack Women Mean Business
Black women are the fastest growing segment of the women owned business
market, yet Black women-owned firms trail all other women when it comes
revenue generation. Black women receive only 6% of the revenue generated
by all women-owned businesses. That compares to 29% received by white
women.
One prime and largely untapped area for revenue growth for Black women
entrepreneurs is through government procurement. Though data is largely
unavailable broken down by both race and gender, we can impute that if Black
women were to receive merely 6% of the 5% government target for awards to
all women, then Black women business owners would receive a stunningly
low, .3% of all federal contracts.
Black Women and Politics, Still Unbought and Unbossed
Black women make up the most dynamic segment of the Rising American
Electorate. In the past two Presidential elections, Black women led all
demographic groups in voter turnout. And even without President Obama on
the ballot, in the recent pivotal Virginia gubernatorial election, Black women
once again, exceeded all other groups in turning out on Election Day. As
such, Black women were a key factor in turning Virginia Blue heading into
the 2014 mid-term elections
While Black women vote at dynamic rates, Black women remain woefully
underrepresented in elected office. Black women hold only 3 % of state
legislative seats, and less than 3% of seats in Congress. And 2014 makes the
15th consecutive year that no Black woman has held a seat in the United States
Senate.
Black Women Trailing in the Technology Race
Though proficiency in the STEM fields is widely acknowledged as a key for
the workplace of the future, Black women lag far behind. Today, Black
women only make up 2% of practicing scientists and engineers in the
workforce.
Many Black women in college studying STEM disciplines report feelings of
isolation and experience toxic environments. Black female STEM students
report being excluded from study groups, having difficulty finding study
partners, and being assigned fewer tasks than other group members based on
assumptions of incompetence.
viiWhat’s At Stake: A BWR Public Policy Agenda for 2014 & Beyond
Targeted jobs creation and high-tech skills training to reduce long-term
unemployment and underemployment in Black communities and other
communities of color. Yes economy is improving but communities of color still
lag. Be as passionate on Job Creation as Immigration Reform and Gun Control.
Amend Voting Rights Act – specifically Section 4 and 5 Enforcement provisions.
Pass comprehensive Immigration Reform with fair path to citizenship and family
reunification that reflects special challenges that all immigrants face including
Latino, African, Caribbean and Asian Pacific Islanders.
Increase the federal minimum wage to a livable wage of at least $10.10 an hour
for all workers, including tipped workers.
Paid sick days – the Healthy Families Act. Low wage workers get fired more
often for staying home to care for self or a sick child.
Adopt an income equality women’s agenda including: Paycheck Fairness, Paid
Family and Medical Leave, Equal Pay and Minimum wage (including tipped
workers).
End war on women in the states including reproductive justice and women’s right
to control their own bodies.
The Power of the Sister Vote
Black women are the most reliable progressive voting block and have great
impact at the polls. In the 2008 and 2012 presidential election cycle and more
recently in the 2013 state election in Virginia Black women “over performed.”
For instance, during the 2012 presidential election Black women accounted for
13% of all votes, while being 12% of the electorate. Such impact should wield
influence and demonstrate high indicators of quality of living. However, Black
women show low indicators in many areas including health disparities and
economic indicators such as unemployment rates and equity of pay.
Black women are a powerful force to be reckoned with and we plan to
demonstrate that power by working collaboratively, collectively and intentionally
across issues with other state and national women’s organizations to ensure we
usher in a new set of progressive polices and policy leaders to champion our cause
and address critical concerns for women and our families. In the coming days, we
will unveil specific details about the implementation of the Power of the Sister
Vote!’s strategy in real-time as various components are operationalized.
viiiForeword
Fifty years ago, the nation experienced two monumental events which changed its
very trajectory. The historic 1964 Civil Rights Act codified a long march towards
expanded equality of opportunity across the lines of race in America. Likewise, a
War on Poverty was declared, pulling together a variety of programmatic efforts
resulting in a social safety net below which, it was believed, no American should fall.
Ten years prior, the nation saw the landmark decision, Brown v. Board of Education,
establish once and for all that separate was indeed, not equal, and thus began a long
walk towards expanded educational opportunity for all of America’s children.
As the nation has progressed since the years of these groundbreaking actions, we
have now entered into what some have defined as post-racial America. In the White
House now sits the nation’s first Black President and First Lady. And while the overt
implementation of Jim Crow has been relegated to the history books, its vestiges still
remain. Stubborn differences persist across both race and gender in America. Black
women in particular, live lives at the intersection of these points of difference. Yet
their struggles and triumphs are rarely examined specifically, especially in a way
that provides not only raw facts, but also depth, context, and an eye towards a path
forward. This report fills that void. It answers the vital questions, how far have
Black women come in 21st Century America? And how much further, do they still
have to go?
Utilizing data from the Bureau of Labor Statistics, the Department of Education, The
Department of Health and Human Services and more, as well pulling together key
findings from existing research, The Status of Black Women in the US 2014 provides
an overarching view of the lives of Black Women in America at this historic and
critical juncture. Specifically it examines the following:
Black Women in the Economy
Black Women in Education
Black Women in Politics
Black Women in Business
Black Women in STEM
Black Women in the Labor Movement
Black Women’s Exposure to Violence and the Criminal Justice System
Black Women’s Health & Wellness
Black Women in the Retirement Years
A Black Women’s Agenda for 2014 and Beyond
A Black Women’s 2014-2020 Civic Engagement Empowerment Strategy
ixBlack Women in the United States 2014, will be the first in an annual series of reports
that the Black Women’s Roundtable will release examining the overall well-being of
Black women in America.
Melanie Campbell
President & CEO
National Coalition on Civic Participation
Convener
Black Women’s Roundtable
Avis Jones-DeWeever, Ph.D.
Sr. Public Policy Advisor,
Black Women’s Roundtable
Editor, Black Women in America, 2014
xThe State of Black Women’s Health
by:
Avis Jones-DeWeever, Ph.D.
Incite Unlimited
and
L. Toni Lewis, M.D.
SEIU Healthcare
“Of all the forms of inequality, injustice in health care is the most shocking and inhumane.”
Dr. Martin Luther King, Jr.
T
here is no more valuable asset in life than one’s health. Impacting both quality
and length of the lived experience, the issue of Black women’s health is
perhaps the most critical of those examined in this report.
Sadly, in many ways, there is much room for improvement. Black women are
especially likely to face a great number of health challenges including a wide variety
of deadly, yet preventable chronic diseases. As a group, we continue to struggle
with obesity, diabetes, heart disease and high blood pressure. And especially
tragically, we lead the nation in the proportion of those who die in the process of
giving birth. In fact, our maternal mortality rate is so high, it rivals that of women in
some developing nations. Believe it or not, today a woman living in Lebanon has a
much greater chance of surviving child birth than does a Black woman in America.
Beyond the tragedy surrounding childbirth, like much of the nation, we too struggle
with cancer. And though we’re less likely than white women to face the specific
challenge of breast cancer, for those of us who do, we are significantly more likely to
die as a result. Our fate, it seems, is not impacted by differentials in access to breast
cancer screenings. To the contrary, Black women report being screened at equal
rates as their white counterparts. The difference that seems most responsible for
our unfortunate fate is a much greater likelihood of experiencing delays in receiving
follow-up care and treatment.i Delays which may prove deadly due to our increased
likelihood of facing this disease in its most aggressive form.
Racial disparities in receipt of appropriate care, whether we're examining timely
receipt of therapies in the treatment of breast cancer, or culturally relevant
prevention and wellness interventions, are a proven factor here. As we are in the
midst of a nationwide conversation on health system transformation, it is critical
Black Women in the United States, 2014 1|Pagethat we build a healthcare infrastructure that has more Black women practitioners, and one that is culturally competent and relevant to the needs of our community. Despite our challenges though, there is much good news to share about Black women’s health. Overall, our life expectancy continues to rise, while teenaged pregnancy rates have dropped dramatically. And most recently, the rate of HIV infection among Black women has fallen tremendously, down over 20 percent in just two years’ time. All and all, the state of Black women’s health is both tragic and triumphant. Though in many respects, we continue to struggle, somehow, some way, in the words of Maya Angelou, still, we rise. Black Women in the United States, 2014 2|Page
1. Black women’s life expectancy continues to rise, climbing by 10 years since
1960.
Between 1960 and 2010, life expectancy in the U.S. has increased from 71 to
79 years. Over that same period, the life expectancy of Black women has
increased at a similar rate, moving from 68 years in 1960, to 78 in 2010.ii
Black women’s life expectancy outpaces that of both Black men and White
men (78 vs. 72 and 76.5 respectively), but still trails that of white women (78
vs. 81).iii
Life Expectancy at Birth by Race, 1960-2010
85
80
75
70
65
60
55
1960 1970 1980 1990 2000 2010
Black Women Black Men
White Women White Men
Source: CDC/NCHS, Health, United States, 2012, Table 18.
Black Women in the United States, 2014 3|Page2. Black teenaged birth rates have plummeted in recent years.
Since 1990, birthrates have dropped dramatically for Black teenagers. For
15-17 year olds, the drop has been by more than two-thirds (67%), while 18-
19 year olds have experienced a 44% decline.iv
Although Blacks still outpace white teens in birth rates, they now trail
Latinas in teenaged childbearing.
Teenage Childbearing by Race and Hispanic Origin
Maternal Age 15-17, Live Births per 1,000 Females
90
82.3
80
70 65.9
60 55.5
49
50
40
32.3
29.5 27.3
30
23.3
15.8
20
10
0
1990 2000 2010
Black Latina White
Source: CDC/NCHS, Health, United States, 2012, Table 3
Black Women in the United States, 2014 4|PageTeenage Childbearing by Race and Hispanic Origin
Maternal Age 18-19, Live Births per 1,000 Females
180
160 152.9
147.7
132.6
140
118.8
120
100 90.7
78 84.8
80 72.3
54.8
60
40
20
0
1990 2000 2010
Black Latina White
Source: CDC/NCHS, Health, United States, 2012, Table 3
Black Women in the United States, 2014 5|Page3. Black women have triple the maternal mortality rate of white women in
America and face an increased likelihood of having a low-weight baby or one
that dies within the first three years.
Black women experience a maternal mortality rate three times that of white
women. At 36 deaths per 100,000 live births,v the maternal mortality rate of
Black women rivals that of some developing nations around the world. In
fact today, a woman in Lebanon has a much greater likelihood of surviving
childbirth than does a Black woman living in America.vi
Infant mortality too is especially prevalent within the Black community.
Babies born to Black women are 2.3 times more likely to die as those born to
whites.vii
U.S. Maternal Mortality Rates by Race, 2006-2009
Deaths per 100,000 Live Births
40
36
35
30
25
20
15
12
10
5
0
Deaths Due to Pregnancy or Childbirth
Black Deaths White Deaths
Source: U.S. Department of Health and Human Services, Health Resources and Services Administration, Maternal and
Child Health Bureau. Child Health USA 2013.
Black Women in the United States, 2014 6|Page4. Breast Cancer is especially deadly for Black women, in part due to
substantially delayed linkage to treatment as compared to white women.
Black women have the highest breast cancer death rates of all racial and ethnic
groups in America and are 40% more likely to die of the disease than white
women.viii
Black women receive mammograms as often as white women. Fully 74% of
Black women receive mammograms every two years as do 73% of white
women.ix
After receiving an abnormal mammogram, Black women are much more
likely than white women to face delays in receiving follow up tests and
treatments. In fact, 1 out of 5 Black women with abnormal mammograms
wait over 60 days for follow up tests, compared to just over 1 out of 10 white
women.x
Even though time is of the essence for the treatment of cancer, only 69% of
Black women actually receive treatment within 30 days of diagnosis as
compared to 83% of white women.xi
According to a recent study published in Cancer Epidemiology, on average, 5
Black women die per day due to disparities in access to breast cancer
treatment.xii
Breast Cancer Death Rates by Race/Ethnicity, 2006-2010
14.8
15.5
Breast Cancer
Death Rates 22.7
30.8
0 5 10 15 20 25 30 35
Black Women White Women Latina Asian Women
Source: DeSantis et.al., Breast Cancer Statistics, 2013.
Black Women in the United States, 2014 7|Page5. Heart Disease, high blood pressure, and diabetes remain especially
prevalent among Black women.
As is the case with the general population, heart disease remains the number
1 killer of Black women.xiii
While generally thought of as more common among men, a new study
focused on “The Stroke Belt,” (12 southeastern states with the highest
incidents of strokes in nation) found that Black women are more likely to
suffer from high blood pressure than Black men, white men, or white
women.xiv
Diabetes continues to disproportionately impact the Black community,
particularly among women. Fully 1 in 4 Black women over the age of 55 live
life with diabetes.xv
High Blood Pressure Rate
by Race and Gender
51%
52%
High Blood Pressure
Rate
51%
64%
0% 10% 20% 30% 40% 50% 60% 70%
Black Women Black Men White Women White Men
Source: Circulation: Sampson et. al., Circulation: Cardiovascular Quality and Outcomes, 2013.
Black Women in the United States, 2014 8|Page6. While the nation as a whole struggles with obesity, its prevalence is
especially pervasive among Black women.
Black women have the highest rates of being overweight or obesity in the
nation.
While more than 2/3 of the U.S. population is either overweight or obese,
fully 4 out of 5 Black women fall within this designation, and 16% struggle
with extreme obesity.xvi
U.S. Prevalence of Adult Overweight and Obesity
Among Women
90%
82%
80% 77%
70%
63%
60% 57%
50%
41%
40%
33%
30%
20% 16%
10% 8% 7%
0%
Overweight or Obese Obese Extreme Obesity
Black Women Latinas White Women
Source: Ogden, et.al. (2014). Journal of the American Medical Association.
Black Women in the United States, 2014 9|Page9. Black women have experienced a significant decrease in new HIV
infections, but remain overrepresented among women with HIV.
In 2010, Black women accounted for 13% of all HIV infections in the U.S. and
64% of all infections among women.xvii
Though the HIV infection rate among Black women still leads all other
women in the nation, for the first time, it appears the infection rates among
Black women are decreasing.
Between 2008 and 2010, new HIV infections among Black women fell by 21
percent.xviii
Estimates of New HIV Infections in the United States for
Most-Affected Subpopulations, 2010
Black Male IDUs 1100
Heterosexual Latinas 1200
White Heterosexual
1300
Women
Black Heterosexual
2700
Man
Black Heterosexual
5,300
Women
Latino MSM 6,700
Black MSM 10,600
White MSM 11,200
0 2,000 4,000 6,000 8,000 10,000 12,000
Source: CDC Estimated HIV incidence among Adults and Adolescents in the United States, 2007-1010.
Black Women in the United States, 2014 10 | P a g eEstimated New HIV Infections per 100,000 Black Women,
2008-2010
9,000
7,700
8,000
7,000 6,100
6,000
5,000
4,000
3,000
2,000
1,000
0
HIV Infection Rate Among Black Women
2008 2010
Source: CDC Fact Sheet: New HIV Infections in the United States, 2012
------------------------------------------------------
i Freeman, Harold. “Why Black Women Die of Cancer.” The New York Times, March 13, 2014,
ii Department of Health and Human Services. Health, United States, 2012. Table 18.
iii Ibid.
iv Ibid. Table 3.
v U.S. Department of Health and Human Services, Health Resources and Services Administration,
Maternal and Child Health Bureau. Child Health USA 2013.
vi Central Intelligence Agency, World Fact Book, Country Comparison Maternal Mortality Rate.
Accessed March 23, 2014. https://www.cia.gov/library/publications/the-world-
factbook/rankorder/2223rank.html
vii Office of Minority Health, Health Status of African American Women. Accessed March 14, 2014,
http://minorityhealth.hhs.gov/templates/content.aspx?ID=3723
viii DeSantis et. al., Breast Cancer Statistics, 2013.
ix Center for Disease Control, CDC Vital Signs, Black Women Have Higher Death Rates from Breast
Cancer Than Other Women. November, 2012. Accessed March 14, 2014.
http://www.cdc.gov/vitalsigns/breastcancer/
x Ibid.
xi Ibid.
xii Hunt et. al., “Increasing Black:White Disparities in Breast Cancer Mortality in the 50 Largest Cities
in the United States, Cancer Epidemiology.
xiii Office of Minority Health, Health Status of African American Women. Accessed March 14, 2014,
http://minorityhealth.hhs.gov/templates/content.aspx?ID=3723
Black Women in the United States, 2014 11 | P a g exiv Nephrology News & Issues, Black Women Have Higher Rates of High Blood Pressure, January 2, 2014. Accessed March 14, 2014. http://www.nephrologynews.com/articles/109955 xv Office of Women’s Health, Minority Women’s Health: Diabetes. Accessed March 18,2014. http://womenshealth.gov/minority-health/african-americans/diabetes.html xvi Ogden, et. al., (2014) “Prevalence of Childhood and Adult Obesity in the United States, 2011-2012. Journal of the American Medical Association, 311(8), 806-814. xvii Center for Disease Control, CDC Fact Sheet: New HIV Infections in the United States, December, 2012, Accessed March 18, 2014. http://www.cdc.gov/nchhstp/newsroom/docs/2012/hiv- infections-2007-2010.pdf xviii Ibid. Black Women in the United States, 2014 12 | P a g e
The Education of Black Women
                                         By:
                            Avis Jones-DeWeever, Ph.D.
                                  Incite Unlimited

Sixty years after the historic Brown v. Board of Education decision, Black women
have experienced a tremendous surge in educational attainment. Clearly
demonstrating a keen understanding of the power and potential of education, in the
span of five decades, high school graduation rates of Black women jumped 63%,
closing the graduation gap with white women to a mere 7% (down from 22% in
1960) and virtually eliminating the gap with Asian women (down to 2%). Today,
fully 86% of young Black women graduate high school, compared to 66% of Latinas,
88% of Asian young women and 93% of white young women.xviii

Beyond high school, Black women represent an increasing proportion of those
enrolled in post-secondary education. Though women across all racial and ethnic
divisions lead their male counterparts in college enrollment and degree attainment,
Black women do so at higher rates than any other group of women in America. By
2010, Black women made up fully 66% of all Blacks completing a Bachelor’s Degree,
71% of those completing a Master’s degree, and 65% of those completing a
Doctorate’s Degree.xviii

Yet, the educational journey of Black women has not been one of universal success.
Even beyond the days of legally imposed separate and unequal educational systems,
Black students of both genders still find themselves facing strong and persistent
structural disadvantages throughout America’s education system. Today, Blacks are
three times as likely as other students to attend schools where less than 60% of
teachers meet all state requirements for certification and licensures.xviii Additionally
one out of four schools with the highest percentages of Black and Latino students
don’t offer the full range of college preparatory courses, including such basics as
Chemistry and Algebra II.xviii Further, aggressive zero-tolerance policies have led to
a school-to-prison pipeline problem that disproportionately disadvantages both
Black boys and Black girls. Black girls, for example, have an out-of-school
suspension rate fully 6 times that of white girls (12% vs. 2%), ultimately exceeding
the rate experienced by all other girls as well as most boys.xviii

Even among those who successfully navigate the institutional challenges found
throughout the nation’s elementary and secondary education system, the issue of
college affordability often serves as a barrier to entry to post-secondary education,
especially in the wake of stricter credit standards instituted by the Department of
Education’s change in Parent PLUS Loan eligibility standards.

Black Women in the United States, 2014                                             13 | P a g e
All told, beyond the shackles of Brown, and in spite of modern-day institutional challenges, Black women continue to demonstrate a strong and consistent commitment to self-empowerment through the pursuit and successful acquisition of education. Black Women in the United States, 2014 14 | P a g e
1. Black women are increasingly likely to have graduated from high
school, and have experienced a steep decline in dropout rates,
especially during the Obama era.
For Black women specifically, graduation rates have more than tripled since
1960. As of 2012, some 86% of Black women graduated from high school,
slightly surpassing the percentage of Black men who graduate (85%), and
greatly outpacing Latinas, of whom, only 66% graduate. Black women
though, still trail white and Asian women who graduate high school at the
rate of 93% and 88% respectively.xviii
Dropout rates among Black women have also been in decline in recent years,
yet those declines have at times, varied substantially from year to year. For
example, as recently as 2006, roughly 12% of Black women had dropped out
of high school. By 2007, that number dropped to 9%, but rose again in 2008,
to 11%. Since then, however, the dropout rate for Black women has declined
consistently, falling by more than 40% in the Obama years, down to 6.4% by
2011.xviii
Percentage of Women 25 Years and Older
with High School Degree or Higher
by Race or Ethnicity, 1960-2012
100%
90%
80%
70%
60%
50%
40%
30%
20%
10%
0%
1960 1970 1980 1990 2000 2010 2012
Black Latinas White Asian
Source: U.S. Department of Education, National Center for Education Statistics. Digest of Education
Statistics, 2012, Table 8.
Black Women in the United States, 2014 15 | P a g eHigh School Dropout Rates for Women
Ages 16-24, 2000-2011
30%
25%
20%
15%
10%
5%
0%
2000 2001 2002 2003 2004 2005 2006 2007 2008 2009 2010 2011
Latina White Black
Source: U.S. Department of Education, National Center for Education Statistics. Digest of Education Statistics, 2012, Table
128.
Black Women in the United States, 2014 16 | P a g e2. Zero tolerance policies disproportionately impact Black female
students at the elementary and secondary level of education, possibly
contributing to the school to prison pipeline.
Black girls receive out of school suspensions at higher rates than all other
girls and most boys. In fact, their suspension rate exceeds that of Whites,
Latinas, and Asian girls combined.
The disproportionate rate of school disciplinary actions may in fact be linked
to the recent surge in Black girls’ involvement with the juvenile justice
system. Today, Black girls are the fastest growing segment of America’s
juvenile justice system.
Students Receiving Out-of-School Suspensions
by Race and Gender, 2011-2012
25%
20%
20%
15% 13%
12%
11%
10% 9%
7%
6%
5%
5% 4%
3%
2%
1%
0%
Girls Boys
Black Latina White Asian Native American Two or More Races
Source: U.S. Department of Education Office for Civil Rights, Civil Rights Data Collection: Data
Snapshot (School Discipline), 2014.
Black Women in the United States, 2014 17 | P a g e3. While women overall make up the majority of those acquiring a college
education, Black women lead their male counterparts at higher rates
than do any other group of women in America.
Black women currently hold roughly two-thirds of all Bachelor’s and
Doctorate Degrees conferred to Blacks overall, and 70% of all Master’s
Degrees. Black women also make up the majority of all Blacks enrolled in
Law, Medical, and Dental Schools across the nation.xviii
Percentage of Degrees Conferred to Women within
80%
Racial and Ethnic Groups by Degree, 2009-2010
70%
71%
66% 65%
60% 64%
61% 62%
56% 57%
50% 55% 54% 55%
51%
40%
30%
20%
10%
0%
Bachelor's Degree Master's Degree Doctorate
Black White Latina Asian
Source: U.S. Department of Education, National Center for Education Statistics. (2012). The Condition
of Education 2012 (NCES 2012-045), Table A-47-2.
Black Women in the United States, 2014 18 | P a g e4. Like most women, Black women remain underrepresented among
those who acquire a Bachelor’s or Master’s degree in a STEM field.
However, as compared to other women, Black women are closer in
parity with their male counterparts in STEM degree obtainment.
Overall, only 20% of degrees to Black women were related to science,
technology, engineering, or mathematics (STEM). This compares to
17% of STEM degrees acquired by Latinas, 23% acquired by white
women, and 33% acquired by Asian women. No matter the race or
ethnicity, no group of women outperformed their male counterpart in
STEM degree acquisition at the Bachelor’s or Master’s Degree level.xviii
All women came close to parity or, as was the case with Black women
and White women, actually exceeded their male counterparts when it
came to receiving Doctorates in a STEM field.
Source: U.S. Department of Education, National Center for Education Statistics. (2012), Table E-42-2.
Black Women in the United States, 2014 19 | P a g eBlack Women in the Economy
by:
Channelle Hardy, J.D.
The National Urban League
and
Avis Jones-DeWeever, Ph.D.
Incite Unlimited
In many ways, with 55 percent of Black children living in single parent households,
the economic well-being of Black women is the economic well-being of Black
America overall.xviii Numerous recent reports, including the National Urban League
State of Black America Annual Equality Indexxviii, paint a multi-faceted picture of the
ways in which our work is valued and of our participation in wealth-building
activities including savings, investment and homeownership.
Since our earliest days in the United States, Black women have made tremendous
gains in securing access to the means of achieving economic stability and building
economic power. Even during the era of chattel slavery, when Black women labored
at skilled and unskilled tasks alongside men, without receiving any compensation
for their efforts, we honed a mindset of entrepreneurship, bartering, creating what
have become internationally-acclaimed quiltsxviii, and eventually starting lucrative
businesses. We have worked in coalition with Black men and with women of all
races to gain better pay, better working conditions, better access to training and
education and access to the ballot – that most foundational of economic
empowerment tools.
But today, Black women are reeling from the aftermath of an economic recession
that hit women of color harder than every other population.xviii The historic
undervaluing of jobs and professions disproportionately held by women and people
of color contributes to a persistent wage disparity. A lack of disposable income
exacerbates the challenges associated with building wealth through
homeownership, savings, retirement planning and investments. And while we
continue to pursue education, data shows that more education increases earnings
but it does not decrease wage equity.
Black Women in the United States, 2014 20 | P a g e1. As they have for decades, Black women continue to lead the nation in
labor force participation, yet still face unemployment challenges and
intensified levels of unequal pay.
Black women have extremely high rates of labor force participation, higher
than all other women in the nation, and maintain that lead even after
entering motherhood. Yet despite this strong work ethic, Black women still
struggle disproportionately with unemployment.
Black women’s unemployment rate was especially hard hit throughout the
Great Recession and now stands at roughly twice that of white women. In
the last quarter of 2013, white women had an unemployment rate of 5.8
percent, while Black women’s unemployment stood at 10.5 percent.xviii
White women experience a pay disparity of approximately 77 cents to the
dollar for white men, and the numbers for Black women are worse. Although
Black women earn 90% of the pay earned by Black men, they earn only 68
cents to every dollar earned by white men.xviii
Source: U.S. Department of Labor, Labor Force Characteristics by Race and Ethnicity, 2012. Table 11.
Black Women in the United States, 2014 21 | P a g e2. Black women are increasingly represented in management and
professional fields but are still over-represented in low-wage jobs.
Experts have found that jobs traditionally associated with women and people
of color are often undervalued and/or underpaid. For example, 28 percent of
Black women and 20 percent of white women are employed in the service
industry, which is traditionally a low-wage, low-benefit sector.
While more Black women are now working in the professional sector, they
are more likely to work in lower paid positions, including within the health
care and educational fields.
Source: 2012 U.S. Census Bureau Statistics, ACS
Black Women in the United States, 2014 22 | P a g e3. Black women are more likely than any other group in America to work
for poverty-level wages.
Black women are more likely than any other demographic group to be a
member of the working poor.
Black women are twice as likely to be working poor as either white women
or white men.
America’s Working Poor by Race and Gender, 2012
18%
16%
16% 15%
14% 13%
12%
11%
10%
8% 7% 6%
6% 5%
4%
4%
2%
0%
Women Men
Black Latinas White Asian
Source: Bureau of Labor Statistics, A Profile of the Working Poor, 2012, Table 2.
Black Women in the United States, 2014 23 | P a g e4. Increasing the Minimum wage and access to benefits would be
especially beneficial to Black women.
Studies show that the number of women who are earning a minimum wage
dramatically increased as a result of the recession – among all racial groups.
For Black women, the numbers doubled. And our representation among the
working poor are significant: 15.64 percent of African American women
workers are earning annual incomes below the national poverty
threshold.xviii
The impact of an increase in the federal minimum wage – while $10.10 is the
number currently proposed, it is still less than a living wage – would be
immediately felt by Black women and our families. According to the White
House, an increase in the minimum wage would impact 28 million Americans
and stimulate the economy.xviii
Directly related to the importance of an equitable and living wage is the issue
of benefits. Lack of access to paid sick leave or health insurance has multiple
health and wellness impacts for women and families. Health care expenses,
child care expenses, or costs associated with missing work contribute to the
challenges facing Black women economically.xviii
5. Black Women are still reeling from the foreclosure crisis.
In 2010, the pivotal report, “Lifting as We Climb” painted a stark picture of
African American women and wealth, touting among key findings that: (1)
Single African American women had a median wealth of $100 v. $41, 500 for
white women; (2) almost half of single African American women had zero or
negative wealth; and (3) only 33 percent of single black women were
homeowners v. 57 percent of single white womenxviii
A recent blog post in the Wall Street Journal identified that the most
significant factors responsible for the persistent black/white wealth gap are
homeownership and income levels. As many scholars have pointed out – the
subprime lending and foreclosure crisis caused a near wipe-out of African
American homeownership and wealth building, but other factors – including
the racial imbalance in intergenerational wealth transfers, also play an
important role.”xviii
Black Women in the United States, 2014 24 | P a g eThe Retirement Security of Black Women
by:
Edna Kane-Williams
AARP
For decades, the labor force participation rate of Black women has eclipsed that of
all other women in America. Yet, when it comes time to enjoy the fruits of that
labor, for far too many, a stage of life which should be met with leisure activities and
well-deserved rest, becomes a period of heightened struggle. And for the most
unfortunate, retirement is little more than an unrelenting sentence to firmly
entrenched and persistent poverty.
Sharply stated, Black America suffers a severe retirement gap, and Black women
bear the brunt of that circumstance. The reasons surrounding this most unfortunate
of realities are broad. Encompassing the historic baggage of a longstanding and
widening racial wealth gap, the continued fall-out from a Great Recession that quite
literally cut the collective wealth of the Black community by more than half, and a
broad range of employment circumstances that result in lower wages as well as
decreased access to retirement vehicles. All told, such life circumstances result in
broadened financial responsibilities for perceived immediate needs. Such
responsibilities at times, even extend beyond the boundaries of the traditional
nuclear family, as Blacks are much more likely than the general population to
provide financial assistance to those beyond their personal household.
Further, still reeling from the recent financial crisis, Blacks are also more likely to
find themselves playing financial catch-up by building (or rebuilding) emergency
savings, putting money away for the purchase (or repurchase) of a home, or
investing in the future by funding the education of their children or grandchildren.
These and other more immediate needs and priorities often trump the act of
diverting income to retirement savings. The resulting harsh reality means that
Blacks are significantly behind when it comes to saving for a secure retirement
future. In fact, the vast majority, some 62%, have no retirement savings
whatsoever.xviii
Black women are especially likely to face retirement insecurity as they reach what
should be, their golden years. In fact, as retirees, Black women experience a
poverty rate that is over five times that experienced by white men (16% vs. 3%).xviii
This unfortunate reality is influenced by several different factors, including Black
women’s low earnings during their working years, their decreased propensity (and
ability) to invest in employer provided pension plans, their especially disadvantaged
Black Women in the United States, 2014 25 | P a g ewealth outcomes, and severe assets shortfall, as well as their overrepresentation among those who face their retirement years disabled and/or alone. Together, this results in a population that is particularly reliant on Social Security as their last line of defense against extreme poverty and potential destitution, even after a lifetime of hard and unrelenting work. Black Women in the United States, 2014 26 | P a g e
1. Black Women suffer both a Wage Gap and a Wealth Gap negatively
influenced by both race and gender. The resulting earnings and wealth
disadvantages leave Black women especially vulnerable during their
retirement years.
While the wage gap remains a particular challenge to the earnings of Black
women, also significant is the degree to which Black Women’s wages
continue to be depressed across every level of education and throughout the
life cycle.
As a result of life-long wage disadvantages, as seniors, Black women have the
lowest household income of any demographic group in America.
Especially among those who live alone, Black women suffer an astounding
wealth gap. Not only trailing significantly behind whites, but trailing Black
men as well.
Median Weekly Earnings of Full-Time Wage and Salary Workers
by Level of Education, 2013
$1,800 $1,652
$1,600
$1,400 $1,279 $1,193 $1,317
$1,200 $1,116
$886 $964 $962
$1,000
$800 $601 $763
$508 $587
$600
$400
$200
$0
Black Women Black Men White Women White Men
High School Degree Bachelor's Degree Advanced Degree
Source: Bureau of Labor Statistics
Black Women in the United States, 2014 27 | P a g eMedian Household Incomes in 2010
for Individuals 65 and Over
White Men $45,800
Asian Men $47,530
Latinos (Men) $40,480
Black Men $35,310
White Women $33,590
Asian Women $41,960
Latinas (Women) $32,820
Black Women $27,610
$0 $5,000 $10,000 $15,000 $20,00 $25,00 $30,00 $35,00 $40,00 $45,00 $50,00
0 0 0 0 0 0 0
Senior Median Household Income
Source: GAO Report, Women’s Retirement Security, July 2012.
Race and Gender Differences in Wealth, Ages 18-64
2007
Single White Men
$60,350
$43,800
Single White Women
$49,180
$41,500
Single Black Men
$12,600
$7,900
Single Black Women
$5,000
$100
$0 $10,000 $20,000 $30,000 $40,000 $50,000 $60,000 $70,000
Excluding Vehicles Including Vehicles
Source: Insight Center for Community and Economic Development, Lifting as We Climb: Women of
Color, Wealth, and America’s Future. Spring, 2010.
Black Women in the United States, 2014 28 | P a g e2. Blacks are more likely to take on broadened financial responsibilities than
the general population, a trend that Black women mirror despite
comparatively low earnings.
Overall, Blacks are more likely than the general population to divert earnings
to various needs seen as more immediately pressing. For example, Blacks
are more likely to focus on reducing debt (60%), building an emergency
savings account (54%), funding the education of children or grandchildren
(27%), saving for a home purchase (19%), supporting elderly family
members (12%), or using their own savings to start a business (10%).xviii
In spite of having lower earnings and significantly less personal wealth to
rely on in times of struggle, Black women are still more likely than both
white men and women to report having loaned money to help family or
friends with expenses (60% vs. 54% and 52% respectively).xviii
Financial Priorities
Fund a Small Business
3%
10%
Support Elderly Family
6%
12%
Save for Home Purchase
13%
19%
Fund Education for 18%
Children/Grandchildren 27%
Build Emergency Fund
41%
54%
Reducing Debt
50%
60%
0% 10% 20% 30% 40% 50% 60% 70%
Blacks General Population
Source: Prudential’s 2013 African American Financial Experience Survey
Black Women in the United States, 2014 29 | P a g eLoaned or Gave Money to Family or Friends
65%
63%
61%
6 0%
59%
57%
55%
54%
53%
52%
51%
49%
47 %
45%
Black Women White Women White Men
Source: Washington Post-Kaiser Family Foundation Poll, 2011
Black Women in the United States, 2014 30 | P a g e3. While overall, Blacks are less likely to have access to employer-provided
retirement plans, when available, Black women are more likely than Black
men to take advantage, but still trail white women and white men in overall
plan participation.
Taking into account both public and private employees, Blacks are much less
likely than whites to have access to employer-sponsored retirement plans.
Perhaps due to their wage disadvantage, among those who have access to
employer provided Direct Contribution Pension Plans (the most common of
which are 401(k) plans), Blacks are less likely than whites to participate.
However, among those Blacks who do participate, women are more likely to
do so than men.
Employer-Sponsored Retirement Plan Coverage
among Wage and Salary Employees by Race, 2012
65%
62%
63%
61%
59%
57%
54%
55%
53%
51%
49%
47%
Retirement Plan Access
Black White
Source: National Institute on Retirement Security, Analysis of CPS ASEC microdata from
IPUMS (Rhee, 2013).
Black Women in the United States, 2014 31 | P a g eProportion of Eligible Working Women and Working Men
Who Participated in Their Employer’s Defined Contribution
Pension Plans by Race
82%
Employees Who 80%
Participated in Defined
Contribution Plans 64%
70%
0% 10% 20% 30% 40% 50% 60% 70% 80% 90%
Black Women Black Men White Women White Men
Source: GAO Analysis of SIPP data.
Black Women in the United States, 2014 32 | P a g e4. Black women are much less likely than other women to be eligible for Social
Security Spouse or Widow Benefits.
Because Black women are both less like than other women to marry, and if
married, are more likely to experience a divorce, they are much less likely than
other women to receive Social Security Spousal or Widow Benefits. In fact, the
number of Black women aged 50-59 who cannot receive Social Security spousal
benefits because they were either never married, or were married for less than 10
years, is more than double the rate of all other women.xviii
While Black women greatly outpace all other women when it comes to
ineligibility rates for Spousal Benefits, ineligibility for all women has increased
over the years, in fact doubling since 1990.
Estimated Percentage of Women Ineligible for Social
Security Spouse or Widow Benefits because of Marital
History among 50-59 Year Olds
34%
Black Women
13%
17%
Latinas
11%
14%
White Women
6%
16%
All Women
8%
0% 5% 10% 15% 20% 25% 30% 35% 40%
1990 2009
Source: Howard M. Iams and Christopher R. Tamborini, “The Implications of Marital History Change on
Women’s Eligibility for Social Security Wife and Widow Benefits, 1990-2009,” Social Security Bulletin
72(2) 2012.
Black Women in the United States, 2014 33 | P a g e5. Social Security is especially vital to the retirement security of Black women. It is
by far the most relied upon source of income for Black women throughout their
retirement years.
Due to limited asset accumulation, modest pensions, and lower earnings, Black
women are especially reliant on Social Security in retirement to make ends meet.
As Black women age, the importance of Social Security benefits increase as their
ability to work and other sources of retirement income begin to decline.
Average Amount Received from Each Income Source
by Black Women Seniors
$12,000
$10,000
$8,000
$6,000
$4,000
$2,000
$0
Overall Age 65-74 Age 75 and older
Social Security 9,825 9,653 10,052
Asset Income 675 591 786
Pension 4,080 4,250 3,855
Earnings 5,682 8,496 1,976
Other 613 701 498
Social Security Asset Income Pension Earnings Other
Source: IWPR calculations based on 2012 Current Population Survey Annual Social and Economic
Survey. Earnings and income data are for the calendar year 2011 (Fischer and Hayes, 2013).
Black Women in the United States, 2014 34 | P a g e6. For Black Women especially, Social Security is often the last line of defense
from either poverty or complete destitution.
For most Black women, throughout her retirement years, social security
makes up at least half of her income stream. And among the most senior,
over half rely on social security as their only source of income.
If Social Security were no longer available, the poverty rate of Black women
in their retirement years would more than double.
Black Women’s Reliance on Social Security by Age, 2009
80% 74%
70%
63%
60%
51%
50%
33% 36%
40%
30%
20%
20%
10%
0%
Percent with 50% or More of Income Percent with 100% of Income from
from Social Security Social Security
Age 62-64 Age 65-74 Age 75 and Older
Source: IWPR calculations based on 2010 Current Population Survey Annual Social and Economic
Supplement Survey (King, et. al. 2010).
Black Women in the United States, 2014 35 | P a g ePoverty Rates for Elder Black Women
With or Without Social Security
70%
62%
60%
49%
50%
40%
30%
25%
20% 17%
10%
0%
Age 65-74 Age 75 and Older
With Social Security Without Social Security
Source: IWPR calculations based on 2012 Current Population Survey Annual Social and Economic
Survey. Earnings and income data are for the calendar year 2011 (Fischer and Hayes, 2013).
Black Women in the United States, 2014 36 | P a g eBlack Women and Labor Unions
by:
Carol Joyner, Labor Project for Working Families
and
Robin Williams, United Food and Commercial Workers International Union
During any point in American history, a significant majority of black women have
worked outside of the home. They’ve been major contributors to American growth
and prosperity as both unpaid workers, during the years of indentured servitude
and slavery, and later, as underpaid and devalued members of the paid labor force.
Through this entire period, black women struggled for dignity, respect and
economic security. There are documented examples of this struggle, occurring just
after slavery and continuing through today. It’s important to highlight the different
forms of worker resistance and labor organizing in order to appreciate the role that
black women have played in the American labor movement and how they are
redefining approaches to worker justice going forward.
Even before the civil war, black women attempted to exercise control over their
work and ban together in common struggle. During slavery, black women risked
their lives in work slowdowns and other forms of resistance in an effort to improve
working conditions. In 1866, recently freed laundresses working in Jackson,
Mississippi struck for higher wages. Similarly, during reconstruction, African
American nurses formed unions to gain protection from both white female nurses
and medical doctors, both of whom sought to maintain racial hierarchies in the
delivery of health care. As these realities continued, across many industries and
sectors, black women have built worker organizations that were integrally
connected to political and community networks. Whether playing a supporting role
to black men or a direct role as union women, black women tied union organizing to
black liberation. According to Debra Cray White, “If a man’s friends or hard
economic times discouraged union membership, a man’s wife could be the ‘greatest
strike-breaker in the World’ or a counterforce in support of the union.”
This section aims to highlight the many ways in which black women have engaged in
concerted or union activity over the years. Since the 1970’s black women have
been the most reliable supporters of unions as evidenced by the union density levels
and proportion of black women to union members overall. Finally, the common
sense reason that black women are more likely than any other group to sign a union
card stems from the belief that their economic potential is made greater when they
belong to a union than when they don’t. This reality is magnified for low-wage
workers, who show the greatest union attachment levels of all.
Black Women in the United States, 2014 37 | P a g eYou can also read