Updated standardized CPUE of blue shark bycaught by the French Reunion-based pelagic longline fishery (2007-2020) - IOTC
←
→
Page content transcription
If your browser does not render page correctly, please read the page content below
IOTC-2021-WPEB17(DP)-08_Rev1

Updated standardized CPUE of blue shark bycaught by the
French Reunion-based pelagic longline fishery (2007-2020)

          Philippe S. Sabarros1,2,*, Rui Coelho3, Evgeny V. Romanov4, Nicolas Guillon4,
          Pascal Bach1,2

          1
           MARBEC, Univ Montpellier, CNRS, Ifremer, IRD, Sète, France
          2
           Institut de Recherche pour le Développement (IRD), Observatoire des Écosystèmes Pélagiques
          Tropicaux Exploités (Ob7), Av. Jean Monnet, 34200 Sète, France
          3
           Instituto Português do Mare da Atmosfera (IPMA), Av. 5 de Outubro, 8700-305 Olhão, Portugal
          4
           CITEB, CAPRUN, Darse de pêche hauturière, 97410 Le Port, La Réunion
          *corresponding author: philippe.sabarros@ird.fr

          Abstract
          The blue shark Prionace glauca is the main bycatch species of the French
          swordfish-targeting longline fishery operating in the south-west Indian Ocean.
          Using observer and self-reported data collected aboard commercial longliners
          between 2007 and 2020, we propose a standardized CPUE series for blue shark
          for this fishery estimated with a lognormal generalized linear mixed model
          (GLMM) to be used for the upcoming stock assessment. We propose to use the
          standardized CPUE for the period comprised between 2011 and 2020 where the
          monitoring effort has been consequent in comparison with previous years.
          Throughout 2011-2020, the standardized CPUE for the blue shark shows a
          significant decreasing trend.

          Keywords
          Blue shark | CPUE standardization | Longline | Western Indian Ocean

                                      Page 1 of 17
IOTC-2021-WPEB17(DP)-08_Rev1
1. Introduction
Primary indices of abundance of target species (e.g. tunas) and non-target species (e.g. sharks) are
based on catch and effort data from commercial fisheries in the absence of fishery-independent
abundance indicators. Fishery-based indices need to be standardized in order to remove the
influence of various fishery-dependent factors such as the fishing effort variability, fishing strategy,
habitat overlap, etc., so they can be used for stock assessment (Maunder and Punt, 2004).
The French longline fishery based in Reunion Island operates in the south-west Indian Ocean around
Reunion Island and Madagascar and mainly targets swordfish (Xiphias gladius) with relatively
shallow night sets. The blue shark Prionace glauca is the main bycatch species and represents 37%
of the bycatch in number of individuals caught (Sabarros et al., 2013).
In 2017 we presented an index of abundance for the blue shark (standardized CPUE) for the period
2007-2016 (Sabarros et al., 2017). We provide now an updated index of abundance for this species
based on observer and self-reported data of the French swordfish-targeting fishery based in
Reunion Island for the period 2007-2020.
2. Material and methods
2.1. Data
We used data collected by sea-going observers on French longline vessels (Bach et al., 2008) as well
as data collected by fishermen themselves called “self-reported data” (Bach et al., 2013). Data were
collected through CAPPER (2007-2008) and EU Data Collection Framework (2009-2020; Reg
199/2008 and 665/2008). The coverage in number of hooks monitored is presented in Figure 1. We
retained a total of 3602 fishing operations monitored between 2007 and 2020 from the core fishing
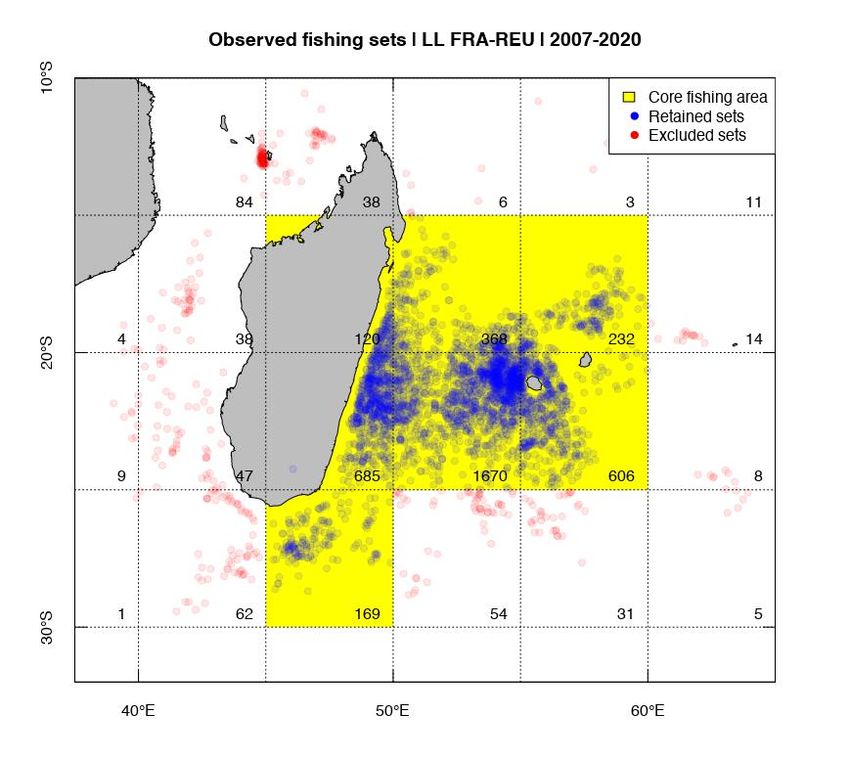
area that consists of 5°x5° squares with more than 100 fishing operations (Figure 2).
2.2. CPUE standardization
The response variable considered was the catch per unit of effort (CPUE) in number of individuals
per 1000 hooks deployed. The proportion of zeros was 12% with a CPUE right-skewed distribution
(Figure 3). By adding a constant (c = 1) and log-transforming the CPUE, the log(CPUE+1)
transformation exhibits a Gaussian shape (Figure 3).
We estimated the standardized CPUE with lognormal Generalized Linear Mixed Models (GLMM)
using the lmer function from lmerTest R package (Kuznetsova et al., 2020). According to the
distribution of log(CPUE+1), we chose a Gaussian distribution for the residuals (link function:
identity).
Page 2 of 17IOTC-2021-WPEB17(DP)-08_Rev1
The list of candidate covariates was determined based on previous work on the characterization of
blue shark hotspots in the south-west Indian Ocean (Selles et al., 2014) as well as the standardized
CPUE presented in 2017 (Sabarros et al., 2017). Potential non-linearity of continuous candidate
covariates was checked by performing univariate Generalized Additive Models (GAM; Figure 4). We
first fitted a full model (Mod 0; Table 1) with the following covariates:
• Fixed effects:
o year (factor): 2007 to 2020
o quarter (factor): Q1 to Q4
o region (factor): west and east of 52°E, it roughly corresponds to the EEZ of
Madagascar (MDG) and Reunion Island (REU) respectively.
o quarter:region (factor): interaction between quarter and region.
o latitude (continuous): latitude of the fishing operation, specifically the latitude where
the line starts being retrieved (hauling).
o soakingtime (continuous): time in hours from when the first hook is deployed to
when the last hook retrieved.
o settingstarttime (continuous): time (hh:mm) when the first buoy is deployed.
o haulingendtime (continuous): time (hh:mm) when the last buoy is retrieved.
o hooksperbasket (continuous): number of hooks per basket as a relative index of
fishing depth range/targeting.
o percentagecirclehooks (continuous): relative proportion of circle hooks to other
types of hooks (J-hooks, tuna hooks, Teracima hooks).
o percentagesquidbait (continuous): proportion of squid bait relatively to other bait
used (mackerel, etc.).
• Random effects:
o vessel (factor): the vessel name was used as a random effect given that we wanted
to incorporate the vessel effect variability in the model but without estimating
specific parameters for each vessel.
Mod 0: year + quarter + region + quarter:region + latitude + soakingtime + settingstarttime +
haulingandtime + hooksperbasket + percentagecirclehooks + percentagesquidbait + (1 | vessel)
Page 3 of 17IOTC-2021-WPEB17(DP)-08_Rev1
We then ran a backward-stepwise model selection using the step function in lmerTest R package
(Kuznetsova et al., 2020) to select for relevant and significant covariates. The deviance tables (Type
III ANOVA with Satterthewaite’s method) of the full and retained models are provided in Table 1,
the summary table of the retained model is Table 2, and the graphical analysis of residuals of the
retained model is presented in Figure 5.
Finally, we present the yearly standardized CPUE series from the retained model computed using
the lsmeans function from lsmeans R package (Lenth, 2018; Table 3; Figure 6) as well as the scaled
(by the mean) standardized CPUEs series (Figure 7).
3. Results
The model selection procedure based on the Akaike Information Criterion (AIC) score retained a
lognormal GLMM with fewer covariates (Mod 1) than the full model Mod 0 (Table 1 and Table 2):
Mod 1: year + quarter + region + quarter:region + latitude + soakingtime + hooksperbasket +
percentagecirclehooks + (1 | vessel)
The blue shark standardized CPUE series obtained using Mod 0 et Mod 1 are extremely similar
(Figure 6).
According to the ANOVA table of the retained model (Mod 1; Table 2), all covariates have significant
effects. Weights (sum of squares) show that latitude (28.72) and year (27.88) have a larger influence,
followed by quarter (9.75) and region (8.08), and then the rest of the covariates (2.35-4.56).
Overall, the retained standardized CPUE (Mod 1) follows the nominal CPUE except for the first years
(2007-2010) and 2019. Throughout 2011-2020, the trend is decreasing and the significance of the
slope was checked using a linear model (b = -0.11, p-value < 0.01).
4. Discussion
Significant effects on blue shark CPUE
The year, quarter, region (west and east of 52°E, roughly corresponding to the EEZ of Madagascar
and Reunion Island respectively) have a significant effect on blue shark catch rates. This is also the
case for the interaction between the quarter and region that was originally considered to account
for the fact that the fishing effort is concentrated in the Malagasy EEZ in the second quarter and
mostly the third for vessels above 12 meters (length overall) that can reach that far, while most
vessels stay in the Reunion Island EEZ during the fourth and first quarters of the year (Sabarros et
Page 4 of 17IOTC-2021-WPEB17(DP)-08_Rev1
al., 2013). We can note that blue shark catch rate is particularly high for vessels that remained in
Reunion Island EEZ during the fourth quarter (Table 2).
To account for additional spatial effects (other than the west and east regions), the latitude was
considered in this standardization work instead of the 5°x5° squares that were previously used
(Sabarros et al., 2017). The latitude exhibits a strong negative effect (noting that the latitude sign is
negative) of blue shark rates similarly to Selles et al. (2014). Blue shark catch rates increase across
the north-south gradient.
The overall soaking time has a positive effect on blue shark bycatch rate as previously demonstrated
by Auger et al. (2015). Indeed, during typical swordfish-targeting fishing operations with line setting
during sunset and hauling time starting at sunrise, the longer the line stays in the water and later is
it hauled, more bycatch and notably blue sharks will be caught.
The number of hooks per basket is a proxy of fishing depth and displays a negative effect suggesting
blue shark CPUE decreases with fishing depth. In Reunion Island longline fishery, hooks are generally
set between 10 meters from the surface down to 120 meters for night fishing (Bach et al., 2014) but
deeper sets probably for targeting tunas during the day (with an increased number of hooks
between floats) will reach deeper layers, which results in a lower blue shark CPUE. Such pattern
would need to be further investigated.
The percentage of circle hooks tends to slightly increase blue shark observable captures as
demonstrated in the Australian (Ward et al., 2009) and Taiwanese longline fisheries (Huang et al.,
2015).
The percentage of squid bait tends to have a slight positive effect of blue shark catch rates
contrastingly to the general pattern found in the literature where mackerel-baited hooks catch more
blue sharks than squid-baited hooks (e.g. Fernandez-Carvalho et al., 2015).
Relevance of the retained standardized CPUE series
The data considered in this standardization work only concern the core fishing area of the Reunion-
based pelagic longline fishery (see Figure 2). This was a safer approach than considering the total
dataset that includes scarce sets located in the Mozambique Channel and faraway international
waters that might exhibit different patterns in terms of blue shark catch rates than those in the core
fishing area.
The residual analysis of the retained lognormal GLMM (Mod 1; Figure 3) used to standardized blue
shark CPUE did not exhibit violation of normality nor heteroscedasticity which suggests that the log
transformation of the CPUE and chosen distribution (Gaussian with identity link) in the model are
satisfactory.
Page 5 of 17IOTC-2021-WPEB17(DP)-08_Rev1
Despite the selection of a model with fewer covariates (Mod 1), the resulting standardized CPUE
series of Mod 0 and Mod 1 are extremely similar (the difference cannot be seen on Figure 6 and
Figure 7). Compared to the nominal CPUE series, the retained standardized CPUE series is smoother
but still shows variations over time.
Acknowledging the relatively low coverage rate (< 3%) in number of hooks observed in the first years
of implementation of the observation programs (Figure 1) we should consider discarding the early
part of the standardized time series before 2011. Moreover, a standardization model (using Mod 1
selected covariates) fitted to the 2011-2020 period showed extremely similar standardized CPUE
values than those of Mod 1 (not shown).
The standardized CPUE series exhibits is relatively steady decrease throughout 2011-2020 with a
rate of 11% per year, going from approximately 2.5 to 1.5 over this ten-year period.
5. Conclusion
According to the assessment of the retained standardization model, we believe that the updated
standardized CPUE time series presented in this paper for blue sharks bycaught by the French
pelagic longline fishery of the south-west Indian Ocean is reliable and can be used for stock
assessment, at least for the 2011-2020 period.
6. Acknowledgments
We thank the observers and Captains that collected data through CAPPER and EU DCF data
collection programs.
7. References
Auger, L., Trombetta, T., Sabarros, P.S., Rabearisoa, N., Romanov, E.V., Bach, P., 2015. Optimal
fishing time window: an approach to mitigate bycatch in longline fisheries, in: IOTC–2015–
WPEB13–15. Presented at the 11th Session of the IOTC Working Party on Ecosystems and
Bycatch, Olhão, Portugal.
Bach, P., Rabearisoa, N., Filippi, T., Hubas, S., 2008. The first year of SEALOR: Database of SEA-going
observer surveys monitoring the local pelagic longline fishery based in La Reunion. Presented
at the 8th IOTC Working Party on Ecosystems and Bycatch, Bangkok, Thailand.
Bach, P., Sabarros, P.S., Le Foulgoc, L., Richard, E., Lamoureux, J.P., Romanov, E., 2013. Self-reporting
data collection project for the pelagic longline fishery based in La Reunion. Presented at the
9th IOTC Working Party on Ecosystems and Bycatch, La Réunion, France.
Page 6 of 17IOTC-2021-WPEB17(DP)-08_Rev1
Bach, P., Sabarros, P.S., Romanov, E., Puech, A., Capello, M., Lucas, V., 2014. Patterns of swordfish
capture in relation to fishing time, moon illumination and fishing depth. Presented at the 12th
IOTC Working Party on Billfish, Tokyo, Japan.
Fernandez-Carvalho, J., Coelho, R., Santos, M.N., Amorim, S., 2015. Effects of hook and bait in a
tropical northeast Atlantic pelagic longline fishery: Part II—Target, bycatch and discard fishes.
Fisheries Research 164, 312–321. https://doi.org/10.1016/j.fishres.2014.11.009
Huang, H.-W., Swimmer, Y., Bigelow, K., Gutierrez, A., Foster, D.G., 2016. Influence of hook type on
catch of commercial and bycatch species in an Atlantic tuna fishery. Marine Policy 65, 68–75.
https://doi.org/10.1016/j.marpol.2015.12.016
Kuznetsova, A., Brockhoff, P.B., Haubo Bojesen Christensen, R., Pødenphant Jensen, S., 2020.
lmerTest: Tests in Linear Mixed Effects Models. R package.
Lenth, R., 2018. lsmeans: Least-Squares Means. R package.
Maunder, M.N., Punt, A.E., 2004. Standardizing catch and effort data: a review of recent approaches.
Fisheries Research 70, 141–159. https://doi.org/10.1016/j.fishres.2004.08.002
Sabarros, P.S., Coelho, R., Bach, P., 2017. Standardized CPUE of blue shark caught by the French
swordfish fishery in the south-west Indian Ocean (2007-2016), in: IOTC-2017-WPEB13-27.
Presented at the 13th Session of the IOTC Working Party on Ecosystems and Bycatch, San
Sabastián, Spain.
Sabarros, P.S., Romanov, E., Le Foulgoc, L., Richard, E., Lamoureux, J.P., Bach, P., 2013. Commercial
catch and discards of pelagic longline fishery of Reunion Island based on the self-reporting
data collection program. Presented at the 9th IOTC Working Party on Ecosystems and Bycatch,
La Réunion, France.
Selles, J., Sabarros, P.S., Romanov, E., Dagorne, D., Le Foulgoc, L., Bach, P., 2014. Characterisation of
blue shark (Prionace glauca) hotspots in the South-West Indian Ocean. Presented at the 10th
IOTC Working Party on Ecosystem and Bycatch, Yokohama, Japan.
Ward, P., Epe, S., Kreutz, D., Lawrence, E., Robins, C., Sands, A., 2009. The effects of circle hooks on
bycatch and target catches in Australia’s pelagic longline fishery. Fisheries Research 97, 253–
262. https://doi.org/10.1016/j.fishres.2009.02.009
Page 7 of 17IOTC-2021-WPEB17(DP)-08_Rev1
8. Tables
Table 1. Deviance table (Type III ANOVA with Satterthwaite’s method) of the covariates in lognormal
GLMM Mod 0 (full model) and Mod 1 (retained model). For each covariate, we indicate the degrees
of freedom (Df), the sum of squares (Sum Sq), the mean squares (Mean Sq), the F test statistic (F
value) and the significance (P value).
Models Covariates Df Sum Sq Mean Sq F value P value
as.factor(year) 13 27.82 2.14 6.11IOTC-2021-WPEB17(DP)-08_Rev1
Table 2. Summary table of the retained lognormal GLMM (Mod 1).
Linear mixed model fit by REML. t-tests use Satterthwaite's method ['lmerModLmerTest']
Formula: logcpue ~ as.factor(year) + quarter + region + quarter:region +
latitude + soakingtime + hooksperbasket + percentagecirclehooks +
percentagesquidbait + (1 | vessel)
Data: catch.bsh
REML criterion at convergence: 6669.2
Scaled residuals:
Min 1Q Median 3Q Max
-2.9776 -0.6073 0.0860 0.6753 3.6383
Random effects:
Groups Name Variance Std.Dev.
vessel (Intercept) 0.1302 0.3609
Residual 0.3503 0.5918
Number of obs: 3602, groups: vessel, 40
Fixed effects:
Estimate Std. Error df t value Pr(>|t|)
(Intercept) -4.082e-01 2.458e-01 9.135e+02 -1.660 0.097164 .
as.factor(year)2008 -2.453e-01 2.181e-01 1.392e+03 -1.125 0.260958
as.factor(year)2009 -3.743e-01 2.303e-01 3.734e+02 -1.625 0.104922
as.factor(year)2010 -2.919e-02 2.215e-01 4.552e+02 -0.132 0.895220
as.factor(year)2011 -4.227e-02 1.745e-01 5.267e+02 -0.242 0.808642
as.factor(year)2012 1.351e-02 1.674e-01 4.851e+02 0.081 0.935729
as.factor(year)2013 -1.673e-01 1.682e-01 4.762e+02 -0.995 0.320337
as.factor(year)2014 -1.852e-01 1.690e-01 4.847e+02 -1.096 0.273826
as.factor(year)2015 -1.754e-01 1.685e-01 4.780e+02 -1.041 0.298453
as.factor(year)2016 -5.241e-02 1.695e-01 4.931e+02 -0.309 0.757259
as.factor(year)2017 -2.224e-01 1.693e-01 4.965e+02 -1.314 0.189570
as.factor(year)2018 -2.871e-01 1.715e-01 5.128e+02 -1.675 0.094611 .
as.factor(year)2019 -3.944e-01 1.709e-01 5.128e+02 -2.308 0.021388 *
as.factor(year)2020 -3.349e-01 1.702e-01 5.087e+02 -1.968 0.049605 *
quarterQ2 -4.000e-02 4.998e-02 3.557e+03 -0.800 0.423580
quarterQ3 -1.328e-01 4.872e-02 3.553e+03 -2.725 0.006466 **
quarterQ4 9.825e-02 6.647e-02 3.550e+03 1.478 0.139422
regionREU 7.619e-02 5.232e-02 3.573e+03 1.456 0.145426
latitude -6.133e-02 6.773e-03 3.468e+03 -9.055 < 2e-16 ***
soakingtime 1.104e-02 4.265e-03 3.566e+03 2.589 0.009663 **
hooksperbasket -2.008e-02 5.567e-03 3.563e+03 -3.607 0.000314 ***
percentagecirclehook 1.721e-03 4.877e-04 2.860e+03 3.529 0.000424 ***
percentagesquidbait 1.943e-03 6.140e-04 3.480e+03 3.165 0.001566 **
quarterQ2:regionRE -9.517e-03 6.674e-02 3.575e+03 -0.143 0.886614
quarterQ3:regionREU 1.818e-01 6.614e-02 3.567e+03 2.749 0.006015 **
quarterQ4:regionREU 6.345e-02 7.577e-02 3.566e+03 0.837 0.402412
---
Signif. codes: 0 ‘***’ 0.001 ‘**’ 0.01 ‘*’ 0.05 ‘.’ 0.1 ‘ ’ 1
Page 9 of 17IOTC-2021-WPEB17(DP)-08_Rev1
Table 3. Standardized CPUE (stdCPUE) time series for blue shark caught in the French longline fishery
for the period 2007-2020. nCPUE designates the nominal CPUE. The stdCPUE is provided with 95%
confidence interval (CI).
Year nCPUE stdCPUE Lower CI Upper CI
2007 2.14 2.56 1.54 3.99
2008 1.86 1.79 1.01 2.86
2009 2.47 1.45 0.76 2.41
2010 4.87 2.46 1.56 3.68
2011 2.86 2.42 1.91 3.01
2012 3.36 2.61 2.14 3.15
2013 2.67 2.01 1.63 2.45
2014 2.45 1.96 1.57 2.41
2015 2.50 1.99 1.60 2.44
2016 3.00 2.38 1.93 2.90
2017 2.38 1.85 1.47 2.29
2018 1.97 1.67 1.29 2.12
2019 2.01 1.40 1.06 1.80
2020 1.92 1.55 1.19 1.96
Page 10 of 17IOTC-2021-WPEB17(DP)-08_Rev1
9. Figures
Figure 1. Observer and self-reporting effort coverage in number of hooks deployed in the French
longline fishery operating in the south-west Indian Ocean between 2007 and 2019.
Page 11 of 17IOTC-2021-WPEB17(DP)-08_Rev1
Figure 2. Distribution of fishing sets (hauling start position) between 2007 and 2020. The yellow area
represents the core fishing area with retained sets in blue. Excluded sets are shown in red. Numbers
in the corners of 5°x5° squares are the number of sets.
Page 12 of 17IOTC-2021-WPEB17(DP)-08_Rev1
Figure 3. Blue shark nominal CPUE (N/1000 hooks; top panel) and log(CPUE+1) (bottom panel)
distributions.
Page 13 of 17IOTC-2021-WPEB17(DP)-08_Rev1
Figure 4. Individual univariate GAMs for each continuous covariates used to explain log(CPUE+1).
Page 14 of 17IOTC-2021-WPEB17(DP)-08_Rev1
Figure 5. Residual analysis of lognormal GLMM Mod 1 selected for blue shark CPUE standardization
including the covariates selected by the backward-stepwise model selection.
Page 15 of 17IOTC-2021-WPEB17(DP)-08_Rev1
Figure 6. Nominal and standardized CPUE (N/1000 hooks) time series for Mod 0 and Mod 1 for the
French longline fishery based in Reunion Island (EU.FRA LL) for the period 2007-2020.
Page 16 of 17IOTC-2021-WPEB17(DP)-08_Rev1
Figure 7. Scaled (by the mean) nominal and standardized CPUE time series of Mod 0 and Mod 1 for
the French longline fishery based in Reunion Island (EU.FRA LL) for the period 2007-2020.
Page 17 of 17You can also read