Urban green spaces and health - WHO/Europe
←
→
Page content transcription
If your browser does not render page correctly, please read the page content below

Urban green spaces and health


Urban green
    spaces
  and health

A review of evidence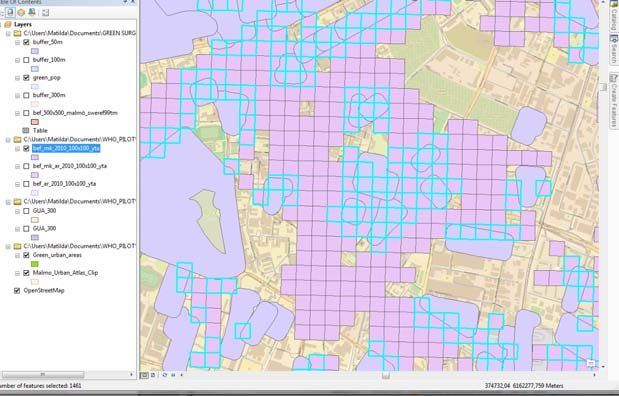
ABSTRACT
This report summarizes the available evidence of beneficial effects of urban green spaces, such as
improved mental health, reduced cardiovascular morbidity and mortality, obesity and risk of type 2
diabetes, and improved pregnancy outcomes. Mechanisms leading to these health benefits include
psychological relaxation and stress alleviation, increased physical activity, reduced exposure to air
pollutants, noise and excess heat. Characteristics of urban green spaces that are associated with
specific mechanisms leading to health benefits, and measures or indicators of green space availability,
accessibility and use that have been used in previous surveys are discussed from the perspective of
their public health relevance and applicability for monitoring progress towards goals set in international
commitments, such as the Parma Declaration in the WHO European Region and the global Sustainable
Development Goals. The report also presents a suggested indicator of accessibility of green spaces with
examples of its application in three European cities and a detailed methodological tool kit for GIS
analysis of land use and population data.

                                                       Keywords
                                                       Urban Health
                                                       Cities
                                                       Environment
Address requests about publications of the WHO Regional Office for Europe to:
                Publications
                WHO Regional Office for Europe
                UN City, Marmorvej 51
                DK‐2100 Copenhagen Ø, Denmark
Alternatively, complete an online request form for documentation, health information, or for permission to quote or
translate, on the Regional Office web site (http://www.euro.who.int/pubrequest).

Citation advice:
Urban green spaces and health. Copenhagen: WHO Regional Office for Europe, 2016.

© World Health Organization 2016
All rights reserved. The Regional Office for Europe of the World Health Organization welcomes requests for
permission to reproduce or translate its publications, in part or in full.
The designations employed and the presentation of the material in this publication do not imply the
expression of any opinion whatsoever on the part of the World Health Organization concerning the legal
status of any country, territory, city or area or of its authorities, or concerning the delimitation of its frontiers
or boundaries. Dotted lines on maps represent approximate border lines for which there may not yet be full
agreement.
The mention of specific companies or of certain manufacturers’ products does not imply that they are
endorsed or recommended by the World Health Organization in preference to others of a similar nature that
are not mentioned. Errors and omissions excepted, the names of proprietary products are distinguished by
initial capital letters.
All reasonable precautions have been taken by the World Health Organization to verify the information
contained in this publication. However, the published material is being distributed without warranty of any
kind, either express or implied. The responsibility for the interpretation and use of the material lies with the
reader. In no event shall the World Health Organization be liable for damages arising from its use. The views
expressed by authors, editors, or expert groups do not necessarily represent the decisions or the stated policy
of the World Health Organization.

Cover photo: OPENspace Research Centre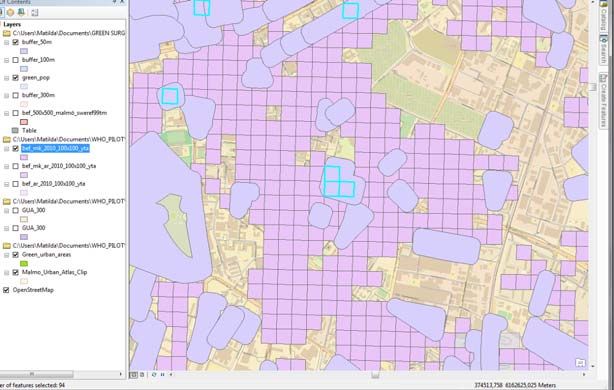
Editors
Andrey I. Egorov 1, 2 *, Pierpaolo Mudu 1, Matthias Braubach 1 and Marco Martuzzi 1
1
    World Health Organization, European Centre for Environment and Health, Bonn, Germany
2
  United States Environmental Protection Agency, National Health and Environmental Effects
Research Laboratory, Chapel Hill, North Carolina, the United States

* AIE contributed to the report working at WHO and then at US EPA.

Primary authors
Section 2:
Catharine Ward Thompson and Eva Silveirinha de Oliveira
OPENspace Research Centre, University of Edinburgh, United Kingdom

Section 3:
Benedict W. Wheeler and Michael H. Depledge
European Centre for Environment and Human Health, University of Exeter Medical School, United
Kingdom

Section 4:
Matilda Annerstedt van den Bosch
Swedish University of Agricultural Sciences, SLU, Alnarp, and Lund University, Sweden

Other contributors
The following individuals contributed their expertise to the development of recommendations on
health‐relevant WHO indicators of urban green space and commented on the draft report:

Mark Nieuwenhuijsen, Center for Research in Environmental Epidemiology (CREAL), Barcelona, Spain
Sjerp De Vries, Research Institute Alterra, Wageningen University, Wageningen, The Netherlands
Thomas Claßen, University of Bielefeld School of Public Health, Bielefeld, Germany
Jenny Roe, University of Virginia School of Architecture, Charlottesville, Virginia, the United States
Hanneke Kruize, Dutch National Institute for Public Health and the Environment (RIVM), Bilthoven,
The Netherlands
Francesca Racioppi, WHO Regional Office for Europe, Copenhagen, Denmark
Tanja Wolf, WHO Regional Office for Europe, Bonn, Germany
Kristen Scott, Intern at the WHO Regional Office for Europe, Bonn, Germany
Anne Cleary, Intern at the WHO Regional Office for Europe, Bonn, Germany.

Acknowledgement
Glenn Rice, US Environmental Protection Agency, reviewed the report and made valuable comments.

                                                    iii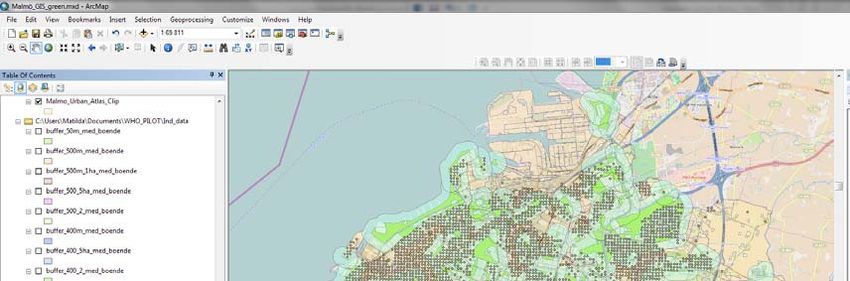
Disclaimer
The views expressed in this report are those of the authors and do not necessarily reflect the views
or policies of the U.S. Environmental Protection Agency. Mention of trade names or commercial
products does not constitute endorsement or recommendation for use.

                                                 iv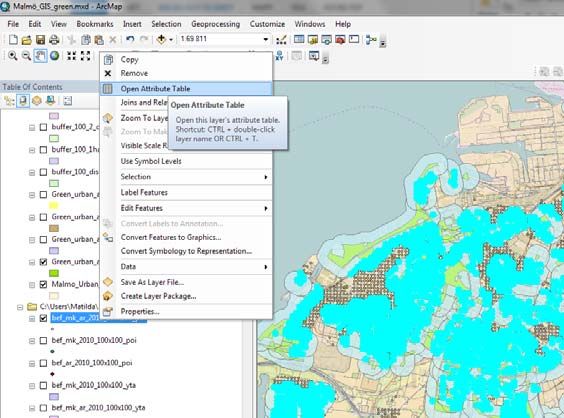
List of abbreviations
ADHD               Attention Deficit Hyperactivity Disorder

BME (groups)       black and minority ethnic (groups)

CORINE             Coordination of Information on the Environment

EEA                European Environment Agency

EEG                Electroencephalography

EU                 European Union

GIS                Geographic Information System

GPS                Global Positioning System

NDVI               Normalized Difference Vegetation Index

UV (light)         ultraviolet (light)

US EPA             United States Environmental Protection Agency

WHO                World Health Organization

                                               v
Table of contents
1. INTRODUCTION .................................................................................................................................. 1
2. EVIDENCE ON HEALTH BENEFITS OF URBAN GREEN SPACES ............................................................. 3
   2.1 Definitions of urban green space ................................................................................................. 3
   2.2 Pathways linking urban green space to improved health and well‐being .................................... 3
     2.2.1 Overview of pathways to health ........................................................................................... 3
     2.2.2 Improved relaxation and restoration .................................................................................... 4
     2.2.3 Improved social capital ......................................................................................................... 5
     2.2.4 Improved functioning of the immune system ....................................................................... 5
     2.2.5 Enhanced physical activity, improved fitness and reduced obesity ...................................... 5
     2.2.6 Anthropogenic noise buffering and production of natural sounds ....................................... 7
     2.2.7 Reduced exposure to air pollution ........................................................................................ 8
     2.2.8 Reduction of the urban heat island effect ............................................................................. 8
     2.2.9 Enhanced pro‐environmental behaviour .............................................................................. 8
     2.2.10 Optimized exposure to sunlight and improved sleep .......................................................... 9
   2.3 Evidence of health benefits of green spaces ................................................................................ 9
     2.3.1 Improved mental health and cognitive function ................................................................... 9
     2.3.2 Reduced cardiovascular morbidity ...................................................................................... 10
     2.3.3 Reduced prevalence of type 2 diabetes .............................................................................. 11
     2.3.4 Improved pregnancy outcomes .......................................................................................... 11
     2.3.5 Reduced mortality ............................................................................................................... 11
   2.4 Mechanisms of potential pathogenic effects of green spaces ................................................... 12
     2.4.1 Increased exposure to air pollutants ................................................................................... 12
     2.4.2 Risk of allergies and asthma ................................................................................................ 12
     2.4.3 Exposure to pesticides and herbicides ................................................................................ 12
     2.4.4 Exposure to disease vectors and zoonotic infections .......................................................... 13
     2.4.5 Accidental injuries ............................................................................................................... 13
     2.4.6 Excessive exposure to UV radiation .................................................................................... 13
     2.4.7 Vulnerability to crime .......................................................................................................... 13
   2.5 Characteristics of urban green space associated with specific health benefits or hazards ........ 14
     2.5.1 Perceptions of green space accessibility and quality .......................................................... 14
     2.5.2 Size of green space .............................................................................................................. 15
     2.5.3 Presence of specific facilities for certain activities .............................................................. 15
     2.5.4 Tree cover and canopy density ........................................................................................... 15
   2.6 Differential health benefits of green spaces in specific population groups ............................... 16
     2.6.1 Women................................................................................................................................ 16
     2.6.2 Children and adolescents .................................................................................................... 17
     2.6.3 Older adults ......................................................................................................................... 17
     2.6.4 Deprived subpopulations and minority groups ................................................................... 18
     2.6.5 Populations of various countries and geographic regions................................................... 19
   2.7 Co‐benefits of urban green spaces unrelated to health effects ................................................. 19
3. INDICATORS OF URBAN GREEN SPACE AVAILABILITY, ACCESSIBILITY AND USAGE, .............................
AND ASSESSMENT OF THEIR HEALTH RELEVANCE ............................................................................... 21
   3.1 Classification of urban green space indicators ........................................................................... 21

                                                                        vi
3.2 Green space characteristics that can be incorporated in definitions of indicators .................... 21
   3.3 Indicators of green space availability ......................................................................................... 22
      3.3.1 Greenness, measured by Normalised Difference Vegetation Index (NDVI) ........................ 22
      3.3.2 Density or percentage of green space by area .................................................................... 23
      3.3.3 Measures of street trees and other streetscape greenery .................................................. 24
   3.4 Indicators of green space accessibility ....................................................................................... 25
      3.4.1 Proximity to an urban park or geographically defined green space .................................... 25
      3.4.2 Proportion of green space or greenness within a certain distance from residence ............ 26
      3.4.3 Perception‐based measures of green space accessibility ................................................... 27
   3.5 Indicators of green space usage ................................................................................................. 28
   3.6 Summary and recommendations for a health‐relevant approach to selecting ..............................
   and using indicators of urban green space ...................................................................................... 29
      3.6.1 Summary of considerations for selecting indicators ........................................................... 29
      3.6.2 Recommendations for a primary indicator ......................................................................... 30
      3.6.3 Recommendations for secondary indicators ....................................................................... 31
4. PROPOSED INDICATOR AND A DATA ANALYSIS TOOL KIT ................................................................ 32
   4.1. Summary of indicator development and evaluation ................................................................. 32
   4.2. Data requirements for a WHO Urban Green Space Indicator ................................................... 33
      4.2.1. Land use data for EU countries .......................................................................................... 33
      4.2.2. Land cover/use data for non‐EU countries......................................................................... 34
      4.2.3 Population data ................................................................................................................... 34
   4.3. Methodology ............................................................................................................................. 34
      4.3.1 General overview ................................................................................................................ 34
      4.3.2 Basic method ....................................................................................................................... 36
      4.3.3. Complex method ................................................................................................................ 38
   4.4 Summary of the proposed indicator .......................................................................................... 39
5. CONCLUSIONS .................................................................................................................................. 40
6. LITERATURE ...................................................................................................................................... 42

APPENDIX 1. Examples of definitions related to assessing green space availability or accessibility .... 64
APPENDIX 2. The availability of key urban land use data for the Member States of ...............................
the WHO European Region .................................................................................................................. 65
APPENDIX 3: A tool kit for assessing green space accessibility – detailed step‐by‐step procedure ..... 67

                                                                         vii
viii
1. INTRODUCTION
There is a recent revival of interest in the importance of green space to support healthy living in
urban areas. Links between green space and health have been recognized throughout history, and
were one of the driving forces behind the urban parks movement of the 19th century in Europe and
North America (Schuyler, 1988).
However, many of the mechanisms behind such links were poorly understood or lacked rigorous
scientific evidence. In the 21st century, new research techniques provide opportunities to study the
mechanisms behind associations between green space and health with increasing sophistication and
help satisfy contemporary scientific standards of evidence demanded to inform policy and practice.
This refined understanding of the health promotion potential of urban green spaces can contribute
to addressing major public health issues related to noncommunicable diseases. Across Europe and
beyond, preventable noncommunicable diseases, such as mental illness, obesity, cardiovascular
diseases, type 2 diabetes and cancer, remain major factors not only affecting health and well‐being,
but also driving up the cost of health care and reducing the productivity of the workforce. Many such
illnesses are linked to chronic stress and lifestyle factors, such as insufficient physical activity (Shortt
et al., 2014). Urban green spaces, as part of a wider environmental context, have the potential to
help address problems ‘upstream’, in a preventative way – considered a more efficient approach
than simply dealing with the ‘downstream’ consequences of ill health (Morris et al., 2006).
At the Fifth Ministerial Conference on Environment and Health in Parma, Italy (2010), the Member
States of the WHO European Region made a commitment “…to provide each child by 2020 with
access to healthy and safe environments and settings of daily life in which they can walk and cycle to
kindergartens and schools, and to green spaces in which to play and undertake physical activity”
(WHO, 2010b). Improving access to green spaces in cities is also included in the United Nations
Sustainable Development Goal 11.7, which aims to achieve the following: “By 2030, provide universal
access to safe, inclusive and accessible, green and public spaces, in particular for women and children,
older persons and persons with disabilities” (United Nations Department of Economic and Social
Affairs, 2014). Finally, the WHO Action Plan for the implementation of the European Strategy for the
Prevention and Control of Noncommunicable Diseases in 2012−2016 includes a call to create health‐
supporting urban environments (WHO, 2012).
Previous WHO reports have already contributed evidence and guidance on access to green space in
relation to public health benefits. A WHO report on urban planning, environment and health
published in 2010 states that green spaces can positively affect physical activity, social and
psychological well‐being, improve air quality and reduce exposure to noise; however, they can also
be associated with an increased risk of injury due to increased recreational and sport‐related use
(WHO, 2010d). Another WHO report evaluated the effects of green spaces on physical activity and
their potential to reduce public health inequalities. It states that “… access to public open space and
green areas with appropriate recreation facilities for all age groups is needed to support active
recreation”, but recognizes that multidisciplinary and intersectoral interventions may be needed to
support disadvantaged groups where physical activity levels are lowest (WHO, 2013).
Recent studies have provided evidence of multiple benefits from urban green space, through various
mechanisms, and with potentially differential impacts in various populations. Epidemiological studies
have used a multitude of approaches to measure the effects of urban green space availability and
accessibility on the health outcomes of study participants. Given the potential of urban green spaces
to act as settings for health promotion it is therefore necessary to summarize the existing evidence
identifying, where possible, the underlying mechanisms contributing to both the negative and
positive health outcomes of urban green space. There is also a need to summarize existing
understandings of the characteristics of urban green space that may differentially be associated with

                                                     1
health outcomes, and to understand how different populations may be affected and benefit in
different ways.
This report offers a review of the existing evidence on the health effects of green space in urban
areas alongside a summary of health‐relevant measures of green space availability, accessibility and
usage. The report also presents a toolkit outlining an example of a Geographic Information System
(GIS)‐based approach to measuring urban green space that WHO has recently applied in three
European cities (Annerstedt van den Bosch et al., 2016). The review is not systematic but, rather, an
overview of previous WHO reports and other previously published reviews as well as selected recent
research publications. The main objectives of this report are to inform public health specialists and
policy‐makers on the benefits of providing urban residents with green space access, and to provide
cities with systematic approaches to quantifying and monitoring their green space access. In doing so
this report advocates the implementation and evaluation of targeted, evidence‐based green space
interventions for the health promotion of urban residents.
22. EVIDENCE ON HEALTH BENEFITS OF URBAN GREEN SPACES
This section summarizes the evidence of pathways to health and health benefits of urban green
space focusing particularly on research published over the last 10 years. Potential mechanisms by
which green space may affect public health are discussed first, followed by specific health benefits
demonstrated by epidemiological studies and, finally, potential detrimental effects.
2.1 Definitions of urban green space
Currently, there is no universally accepted definition of urban green space, with regard to its health
and well‐being impacts. Urban green spaces may include places with ‘natural surfaces’ or ‘natural
settings’, but may also include specific types of urban greenery, such as street trees, and may also
include ‘blue space’ which represents water elements ranging from ponds to coastal zones. Typical
green spaces in urban areas are public parks; other definitions may also include private gardens,
woodlands, children’s play areas, non‐amenity areas (such as roadside verges), riverside footpaths,
beaches, and so on. The definitions are nuanced and context‐specific. For example, they can depend
on particular environment‐health pathways under consideration. Examples of green space definitions
are presented in Appendix 1.
The following review of health benefits as well as discussion of green space measures and indicators
in Section 3 of the report summarize all available evidence and experience based on various
definitions of urban green space, reflecting varying ways in which it is described and defined in
different studies.
Consideration of urban green space in different research usually includes public parks and gardens,
but may or may not also include a range of other areas, such as other public open space, street trees,
sports pitches and recreational facilities such as golf courses, private and semi‐private gardens and
other residential open space, roof gardens, urban agriculture, commercial forests, vegetated waste
land, indeed any place where there is a natural surface or where trees are growing.
The most common definition of urban green space that has been used in studies in Europe is based
on the definition from the European Urban Atlas (European Union, 2011). The Green Urban Areas as
defined by Urban Atlas code 14100 include public green areas used predominantly for recreation
such as gardens, zoos, parks, and suburban natural areas and forests, or green areas bordered by
urban areas that are managed or used for recreational purposes. In policy terms, it is important to
focus on urban green space that is open to the public particularly when considering universal green
space access for all urban residents, regardless of socioeconomic circumstances. However, where
relevant the overview includes studies that have used wider or more inclusive definitions of urban
green space.
While the Urban Atlas excludes bodies of water from the definition of Green Urban Areas, we
recognize that water is often part of urban green space and that the water edge, whether, for
example, along a river or lake, a sea beach or a cliff, is often an important and attractive feature for
people to use and enjoy. For this reason, we might consider the working definition for urban green
space used in this overview to include ‘green/blue’ space which may be of benefit in its entirety, and
where the riparian zone and access to water may be particularly valued and used by urban dwellers.
This overview does not, however, include studies that are explicitly focused on the health benefits of
water‐based sports and recreation.
2.2 Pathways linking urban green space to improved health and well‐being
2.2.1 Overview of pathways to health
The mechanisms underlying links between green space access and health are likely to be complex
and interacting. Access to green space may produce health benefits through various pathways
(mechanisms leading to health effects), some of which may have a synergistic effect. Various models
3have been proposed to explain the observed relationship between green space and health. Hartig et
al. (2014) suggested four principal and interacting pathways through which nature or green space
may contribute to health: improved air quality, enhanced physical activity, stress reduction and
greater social cohesion. Lachowycz & Jones (2013) emphasized physical activity, engagement with
nature and relaxation, and social activities and interactions as major pathways to health. Villanueva
et al. (2015) proposed a model that emphasizes respiratory health and resilience to heat‐related
illness, social capital and cohesion, and physical activity. Kuo (2015) suggests a central role for
enhanced immune functioning as a pathway between nature and health, recognizing that there may
be multiple pathways, some of which may interact and offer both direct and indirect benefits. Hartig
et al. (2014) summarized the existing strong evidence for restorative psychological effects from
interaction with green space or natural environments.
2.2.2 Improved relaxation and restoration
It has been recognized for centuries that contact with nature can be restorative and evidence of
mental health benefits from having contact with nature and green spaces is well documented (Hartig,
2007; Hartig et al., 1991). There are two main theories that attempt to explain this:
a) Psycho‐physiological stress reduction theory proposes that contact with nature (e.g. views of
natural settings) can have a positive effect for those with high levels of stress, by shifting them to a
more positive emotional state (Ulrich, 1983; Ulrich et al., 1991). As people are innately predisposed
to find non‐threatening natural stimuli relaxing, exposure to these stimuli triggers a parasympathetic
nervous system response leading to feelings of enhanced well‐being and relaxation.
b) Attention Restoration Theory suggests that involuntary attention given to interesting and rich
stimuli in natural settings helps to improve performance in cognitively demanding tasks (Kaplan and
Kaplan, 1989; Kaplan, 1995; Kaplan, 2001; Kaplan and Kaplan, 2011). People have two types of
attention: directed attention, which requires effort and, therefore, is a limited resource, and
fascination or effortless involuntary attention. Working on specific tasks requiring direct attention
depletes this limited resource while involuntary attention, which is facilitated in natural
environments, restores it and, therefore, improves cognitive performance.
Both are psycho‐evolutionary theories, based on the biophilia hypothesis, which postulates that
humans have an innate need to affiliate with the natural environment within which they have
evolved (Wilson, 1984). Both theories suggest that interaction with the natural environment serve a
restorative function but through different mechanisms (reviewed by Clatworthy et al., 2013).
Support for these theories has been provided by studies that demonstrate restorative physiological
responses associated with viewing or being in green space, including reduced blood pressure (Hartig
et al., 2003, Ottosson & Grahn, 2005, Ulrich et al., 1991), heart rate (Ottosson & Grahn, 2005, Ulrich
et al., 1991), skin conductance and muscle tension (Ulrich et al., 1991). Evidence of
psychoneuroendocrine responses to woodland environments are based on observed associations
with lower concentrations of cortisol, lower pulse rate, lower blood pressure, greater
parasympathetic nerve activity and lower sympathetic nerve activity when compared to city
environments (Lee et al., 2011; Park et al., 2007).
Hartig et al. (2014) noted that “substantial evidence speaks to the potential benefits of contact with
nature for avoiding health problems traceable to chronic stress and attentional fatigue”, but also
pointed out that most previously conducted studies demonstrated only short‐term restorative
benefits of an episode of experiencing nature. For example, a study in the United Kingdom used
wearable electroencephalography (EEG) devices to demonstrate the effects of a short walk in a green
space on brain activity that might be associated with enhanced relaxation and restoration (Aspinall et
al., 2015). It was also shown that walking in natural environments produces stronger short‐term
cognitive benefits than walking in the residential urban environment (Gidlow et al., 2016a). Using the
diurnal cortisol pattern as a biomarker of chronic stress is an innovative approach that was applied in
4the United Kingdom to demonstrate that exposure to green space reduces chronic stress in adults
living in deprived urban neighbourhoods (Roe et al., 2013, Ward Thompson et al., 2012; Beil & Hanes
2013). Similar relationships between green space and stress reduction have been shown using hair
cortisol as a biomarker of chronic stress (Honold et al., 2016; Gidlow et al., 2016b). Cortisol measures
have also demonstrated the stress reducing effects of gardening (van den Berg & Custer, 2011)
suggesting that such activities in green space may be particularly restorative. It has also been
demonstrated that exposure to green spaces reduces neural activity in the subgenual prefrontal
cortex and alleviates depression symptoms (Bratman et al., 2015).
2.2.3 Improved social capital
There is a well‐known protective effect of social relationships on health and well‐being, while social
isolation is a known predictor of morbidity and mortality (Nieminen et al., 2010; Pantell et al., 2013;
Yang et al, 2016). Green space can play an important role in fostering social interactions and
promoting a sense of community (Kim and Kaplan, 2004). In a recent study in the Netherlands, de
Vries et al. (2013) found an association between the quantity and, even more strongly, the quality of
streetscape greenery and perceived social cohesion at the neighbourhood scale. In that study, social
cohesion was defined as a sense of community, with a focus on trust, shared norms and values,
positive and friendly relationships, and feelings of being accepted and belonging. The researchers
developed an indicator of social cohesion based on questionnaire data. Conversely, a shortage of
green space in the environment has been linked to feelings of loneliness and lack of social support
(Maas et al., 2009a, Ward Thompson et al., 2016). Various types of urban green space have been
shown to facilitate social networking and promote social inclusion in children and adolescents
(Seeland et al., 2009).
Neuroscience has provided evidence that place constitutes a distinct dimension in neuronal
processing and so ´sense of place´ and ´place identity´, in which the social and natural environment
have particular roles, are important dimensions for human health (Lengen & Kistemann, 2012).
Hartig et al. (2014) underlined that the relationships between social well‐being and green space are
complex and, while observational research may reveal associations, the underlying mechanisms are
not easy to explore. Social well‐being may not be beneficially affected by green and open space that
is perceived as unsafe or where people engage in antisocial behaviour, although these problems can
be addressed by proper management and maintenance. There is also some evidence that provision
of new green spaces in disadvantaged neighbourhoods (e.g. greening of vacant lots) can reduce
crime (Branas et al., 2011; Chong et al., 2013).
2.2.4 Improved functioning of the immune system
Japanese studies have demonstrated associations between visiting forests and beneficial immune
responses, including expression of anti‐cancer proteins (Li et al., 2008). This suggests that immune
systems may benefit from relaxation provided by the natural environment or through contact with
certain physical or chemical factors in the green space. It has been shown that children with the
highest exposure to specific allergens and bacteria during their first year were least likely to have
recurrent wheeze and allergic sensitization (Lynch et al., 2014). Another suggested immunological
pathway is through exposure to diverse microorganisms in the natural environments (Rook, 2013),
which can play an immunoregulatory role. Kuo (2015) suggested a central role for enhanced immune
functioning in the pathway between nature and health.
2.2.5 Enhanced physical activity, improved fitness and reduced obesity
Physical inactivity is identified as the fourth leading risk factor for global mortality (WHO, 2010a).
Physical inactivity is becoming increasingly common in many countries with major implications for
the prevalence of noncommunicable diseases and the general health of the population worldwide
(WHO, 2012). Several environmental factors are recognized as contributing to physical inactivity in
5cities, such as high traffic volumes and lack of parks and footpaths. Hartig et al. (2014) found some
evidence for an association between green space and levels of physical activity, suggesting that the
relationship may vary considerably between population subgroups; they underline how walking for
recreation may be supported by green environments in a different way than walking as a means of
transport.
Several studies in various countries have demonstrated that recreational walking, increased physical
activity and reduced sedentary time were associated with access to, and use of, green spaces in
working age adults, children and senior citizens (Wendel‐Vos et al., 2004; Epstein et al., 2006;
Kaczynski & Henderson, 2007; Kaczynski et al., 2008; Sugiyama & Ward Thompson, 2008; Sugiyama
et al., 2009; Cochrane et al., 2009; Astell‐Burt et al., 2013; Schipperijn et al., 2013; Lachowycz and
Jones, 2014; Sugiyama et al., 2014; Gardsjord et al., 2014; James et al., 2015).
Almanza et al. (2012) used satellite images coupled with Global Positioning System (GPS) and
accelerometer data from children in the United States to demonstrate that exposure to green space
measured by Normalized Difference Vegetation Index (NDVI), which reflects the light‐absorbing
capacity of vegetation derived from satellite data, was positively associated with moderate to
vigorous physical activity (MVPA).
Björk et al. (2008) and De Jong et al. (2012) found a positive association between high quality green
spaces in the neighbourhood and higher levels of physical activity, as well as improved self‐assessed
health. High quality green space was defined as having a comparatively high number of recreational
attributes, out of a total of five assessed by experts, including qualities associated with historical and
cultural associations, spaciousness, richness of natural species, peaceful qualities and wildness. In a
United Kingdom study of children aged 10‐11 years, Lachowycz et al. (2012) showed that time spent
in green space contributed over a third of all outdoor MVPA occurring during weekday evenings, over
40% on Saturdays and almost 60% on Sundays. Furthermore, links between green space use and
MVPA were consistent in all seasons. In a Spanish study, Dadvand et al. (2014a) found that living in
greener residential areas and proximity to forests was associated with less sedentary time and
reduced risks of children being overweight or obese.
One way in which green space may be linked to health is through the enhanced benefits of physical
activity in green or natural places, as opposed to other contexts. ‘Green exercise’, defined as physical
activity undertaken in green or natural environments (Barton & Pretty, 2010), has been suggested as
being more beneficial than other types of exercise (Marselle et al., 2013). For example, running in a
park is associated with a more restorative experience when compared to the same exercise in an
urban environment (Bodin and Hartig, 2003). Barton & Pretty’s (2010) analysis of ten United
Kingdom studies showed multiple mental health benefits from physical activity in green
environments. Mitchell’s (2013) study of the Scottish population showed an association between
physical activity in natural environments and reduced risk of poor mental health, while activity in
other types of environment was not linked to the same health benefit.
Interest in associations between green space and physical activity has also focused on behaviour
change, with certain green spaces potentially encouraging greater levels of physical activity. In an
Australian context, Sugiyama et al. (2013) found that the presence of and proximity to
neighbourhood green spaces helps to maintain recreational walking over time.
Physical activity has been shown to improve cardiovascular health, mental health, neurocognitive
development, and general well‐being and to prevent obesity, cancer, and osteoporosis (Owen et al.,
2010). Providing attractive urban green space may encourage people to spend more time outdoors
and facilitate physical activity (Bedimo‐Rung et al., 2005). In particular, many older people find it very
difficult to maintain moderate levels of physical activity; therefore, providing green spaces that
encourage older people to be active, even if it is only at a light level, is important for public health.
The quality of the urban green space and its proper maintenance may be important factors in green
space usage by older adults (Aspinall et al., 2010). Sugiyama & Ward Thompson (2008) demonstrated
6an association between the quality of neighbourhood open space and increased walking in older
people in the United Kingdom. For people with mental illness living in urban areas, physical activity in
green space may be particularly beneficial (Roe and Aspinall, 2011). Other populations or subgroups
may benefit, in a similar way, from green space that makes outdoor activity enjoyable and easy,
hence encouraging less sedentary lifestyles.
A systematic review of 60 studies from the United States, Canada, Australia, New Zealand and
Europe on the relationships between green spaces and obesity indicators found that the majority
(68%) of papers showed that green space is associated with reduced obesity; the relationships could
be modified by age and socioeconomic status (Lachowycz & Jones, 2011).
There is some evidence that using green space for growing food may influence physical activity,
social well‐being and encourage a healthy diet, thereby reducing obesity. A pilot intervention study
using community gardening and education in nutrition in the United States found that obese and
overweight children had improved their Body Mass Index status by the end of the seven‐week‐long
programme (Castro et al., 2013).
2.2.6 Anthropogenic noise buffering and production of natural sounds
Noise pollution is a major and increasing threat to human health, due to continuing urbanization,
rising traffic volumes, industrial activities, and a decreasing availability of quiet places in cities. The
range of disease burden from noise pollution is estimated at 1.0 – 1.6 million Disability Adjusted Life
Years in the European Region (WHO, 2011). Evidence suggests that a well‐designed urban green
space can buffer the noise, or the negative perception of noise, emanating from non‐natural sources,
such as traffic, and provide relief from city noise (González‐Oreja et al., 2010; Irvine et al., 2009).
Vegetation has been considered as a means to reduce outdoor noise pollution, mainly in areas with
high volumes of traffic. A study in Uttar Pradesh, India (Pathak et al., 2008) showed significant
reductions in traffic noise pollution from vegetation belts of 1.5 – 3 m width and a similar height
range, with greater noise reduction as noise frequency increased (peak attenuation occurred
between 2.5–5 KHz). This reinforces findings from a number of earlier studies in Europe and North
America, indicating that a combination of land form and vegetation were most effective in
attenuating traffic noise. For example, Huddart (1990) in the United Kingdom showed the
effectiveness of 10 m wide tree belts. However, Yang et al. (2011) undertook experiments using EEG
and showed that over half their participants overrated the ability of roadside vegetation to attenuate
noise. The researchers suggest that, because almost all participants believed that a vegetation barrier
could reduce noise, the plants affect people’s emotional processing and that there is therefore a
psychological mechanism at work in perceived noise reduction, and especially in the level of noise
attenuation that vegetation effects. In a Swedish study, Gidlöf‐Gunnarsson & Öhrström (2010) also
showed that vegetated courtyards moderate the negative effects of traffic noise.
A different but not unrelated effect of green and blue space in relation to noise perception is the
effect of other natural noises in masking noise pollution such as from traffic. In a Belgian study,
Coensel et al. (2011) explored perceived loudness, pleasantness, and eventfulness of stimuli that
combined road traffic noise with fountain or bird sound at different sound levels. Adding a fountain
sound reduced the perceived loudness of road traffic noise only if the latter had low temporal
variability. Conversely, adding bird sound significantly enhanced soundscape pleasantness and
eventfulness, more so than for the fountain sound. The authors conclude that soundscape quality is
influenced heavily by the meaning associated with the different sounds that are heard. Galbrun & Ali
(2013) subsequently explored the perception of water sounds to mitigate road traffic noise and
found that, to be effective, water sounds should be similar to, or not less than 3 dB below, the road
traffic noise level (confirming previous research), and that stream sounds tend to be preferred to
fountain sounds, which are in turn preferred to waterfall sounds.
72.2.7 Reduced exposure to air pollution
Evidence of mitigating effects of urban green space on exposure to anthropogenic air pollutants in
cities has been reviewed by various scholars. Vegetation (trees, shrubs, herbs and grass) can dampen
the impacts of road traffic and industries and improve air quality in urban residential areas providing
benefits for public health. Urban residents in different countries (Portugal and France) have
recognized the role of green space in improving perception of air quality (Madureira et al., 2015).
Trees and other vegetation can decrease levels of air pollutants and reduce atmospheric carbon
dioxide through carbon storage and sequestration (Liu and Li, 2012, Nowak et al., 2006, Vailshery et
al., 2013, Baró et al., 2014, Nowak et al., 2013, Calfapietra et al., 2016, Manes et al., 2012). Therefore,
green spaces provide indirect health benefits in addition to those associated with direct contacts
with greenery (Dadvand et al., 2012a). (Potential detrimental effects of green spaces due to trapping
air pollutants are discussed in Section 2.4 below.)
2.2.8 Reduction of the urban heat island effect
Heat related morbidity in cities is a major public health concern (WHO and WMO, 2015). The Urban
Heat Island effect can be a serious health hazard during heat waves and extreme heat events. It
arises due to replacement of vegetation with impervious heat-absorbing surfaces in urban areas.
Exposure to excessive heat is linked to increased morbidity and mortality, especially in vulnerable
subpopulations, such as the elderly (Smargiassi et al., 2009; Basagaña et al., 2011). A systematic
review and meta-analysis of literature on how urban parks affect the air temperature in urban areas
showed an average cooling effect of approximately 1o C (Bowler et al., 2010a). The study also
suggested that parks may mitigate urban heat in wider surrounding urban areas, with data
suggesting an effect up to 1 km from the park boundary. The inclusion of water bodies within the
green space may offer greater cooling effects (Völker et al., 2013). Another review indicated that
urban greenery, including parks, street trees and green roofs, mitigate Urban Heat Island effects
(Shisegar 2014). In the United States, Harlan et al. (2006) showed that densely populated areas,
sparse vegetation, and low levels of open space in the neighbourhood were significantly linked to
higher temperatures and urban heat islands in Phoenix, Arizona. During warmer weather, trees can
provide shade and reduce the demand for air conditioning and, especially, in warmer countries, they
can provide comfortable outdoor settings and allow people to avoid heat stress (Lafortezza et al.,
2009). Jenerette et al. (2011) emphasized the role that vegetation and green space play in reducing
surface temperature in Phoenix and how more equitable access to urban green areas and vegetation
would reduce income-associated inequality in exposure to extreme heat and protect vulnerable
groups, such as elderly individuals. In cooler climates, trees can also provide shelter from wind and
thereby reduce heating demand in the cold season.
2.2.9 Enhanced pro-environmental behaviour
Pro-environmental behaviour can be defined as “behaviour that consciously seeks to minimize the
negative impact of one’s actions on the natural and built world” (Kollmuss & Agyeman, 2002). In the
face of climate change, which is projected to have serious detrimental effects on health, an upstream
approach to minimizing and mitigating its effects is to promote pro-environmental behaviour
(Annerstedt van den Bosch & Depledge, 2015). The authors suggested that, as with many social
behaviours, pro-environmental behaviour can be induced by external stimuli, particularly by
experiencing natural environments. Recent research has supported this, showing that exposure to
nature may increase cooperation and, when considering environmental problems as social dilemmas,
sustainable intentions and behaviour (Zelenski et al., 2015). There is also evidence that childhood
experiences in nature appear to enhance adult environmentalism (Wells and Lekies, 2006). If pro-
environmental actions are widely adopted, people can contribute to substantially reducing carbon
emissions (Dietz et al., 2009) thereby potentially preventing detrimental effects of climate change
on health.
82.2.10 Optimized exposure to sunlight and improved sleep
If access to green space supports greater time spent outdoors among the population, it is likely to be
accompanied by increased exposure to sunlight, which can have positive effects as well as negative
effects (the latter are discussed in section 2.4). Humans get most of their vitamin D from exposure to
sunlight, and optimum levels of vitamin D are important for overall health and well‐being, especially
bone density, so access to green space may contribute to better levels of vitamin D and associated
health benefits (Gillie, 2005). This may be especially important for northern Europeans whose
environment lacks high level sunlight for significant parts of the year, and for older people, since the
ability to synthesise Vitamin D decreases with age. However, there is lack of studies looking at the
role of green space and levels of vitamin D. De Rui et al. (2014) explored how different pastimes
influenced the levels of Vitamin D in older people. The authors found that vitamin D levels were
significantly higher in those who engaged in outdoor activities, rather than for those who did not.
The levels were particularly high for those who cycled or partook in gardening.
Natural light also contains a spectrum of light wavelengths, some of which may be beneficial or
detrimental. Access to sunlight brings the risk of exposure to dangerous levels of ultraviolet (UV) light,
especially in southern hemisphere countries such as Australia, as reported in section 2.4. However,
recent research also suggests that UV‐induced release of nitric oxide from skin may have unexpected
health benefits, including lowering the incidence of hypertension and cardiovascular disease (CVD)
that is particularly associated with lower latitudes and winter months (Liu et al., 2014).
Light exposure, particularly to blue light, is also recognized as way to stimulate alertness and
cognition, and to promote healthy sleep. Exposure to blue light is implicated in metabolism and
circadian rhythms, where naturally occurring patterns of daylight support healthy circadian rhythms
but exposure to blue light at inappropriate times (e.g. at night) may suppress the secretion of
hormones that influence such rhythms. However, there is some evidence that the beneficial effect of
natural light on cognition may diminish with age (Daneault et al., 2014).
Adequate sleep is crucial for good health, while sleep deprivation has been linked to adverse health
outcomes, such as metabolic syndrome, cardiovascular morbidity and mortality, and neurocognitive
disorders, such as dementia (Schmid et al., 2015; Kohansieh & Makaryus, 2015; Miller, 2015). An
Australian study showed that those living in a greener neighbourhood had lower risk of insufficient
sleep (less than six hours) (Astell‐Burt et al., 2013). In the United States, Grigsby‐Toussaint et al.
(2015) found that access to natural environments reduced the prevalence of self‐reported
insufficient sleep in adults, especially men. Therefore, green space access may benefit health through
increasing people’s exposure to natural patterns of daylight, hence helping to maintain circadian
rhythms.
2.3 Evidence of health benefits of green spaces
2.3.1 Improved mental health and cognitive function
Studies of green spaces and health have demonstrated stronger evidence for mental health benefits,
and for stress reduction, compared with other potential pathways to health (reviewed by de Vries,
2010; Gascon et al., 2015). An Australian study has shown perceived neighbourhood greenness to be
more strongly associated with mental health than with physical health (Sugiyama et al., 2008) while a
study in Spain (Triguero‐Mas et al., 2015) found that greater exposure to green space was linked to
improved physical and mental health across all socioeconomic strata and genders. The associations
were stronger for surrounding greenness (measured by NDVI) than for distance to green space.
Further analysis demonstrated that this association was not mediated by physical activity. Moving to
greener areas has been associated with mental health improvements in the United Kingdom (Alcock
et al., 2014). Individuals living in urban areas with more green space have been shown to have a
reduced level of stress and improved well‐being compared to controls with poorer availability of
green space (White et al., 2013a). A study in the United States found that higher levels of
9neighbourhood greenery were linked to lower levels of depression, anxiety and stress (Beyer et al.,
2014), while a German study found mental well‐being in city dwellers to be particularly associated
with blue space (Völker & Kistemann, 2015). In a longitudinal study, researchers in Sweden found a
significant association between gained access to ‘serene’ green space and improved mental health in
women (van den Bosch et al., 2015). A cross‐sectional study in England linked the quality of, and
access to, green space with reduced psychological distress (Pope et al., 2015). Another recent cross‐
sectional study in Lithuania demonstrated that, among individuals who regularly use parks, closer
proximity of their home to the nearest park was associated with reduced odds of self‐reported
symptoms of depression (Reklaitiene et al., 2014). In a study in four European cities, van den Berg et
al. (2016) demonstrated that more time spent in green space is associated with improved mental
health and vitality independent of cultural and climatic contexts. General therapeutic benefits of
nature engagement among people with autism have also been demonstrated (Faber Taylor & Kuo,
2006).
There is accumulating evidence for the beneficial effects of green space on mental health and
cognitive development in children, although some studies produced inconsistent results. In a
Lithuanian study, Balseviciene et al. (2014) found that living closer to city parks was associated with
improved mental health in children whose mothers had a lower education level; however, more
residential greenness was associated with worse mental health in children whose mothers had a
higher education level.
Greater usage of green and blue spaces, and greater residential surrounding greenness, have been
linked with improved behavioural development (reduced difficulties, emotional symptoms and peer
relationship problems) and reduced rate of Attention Deficit Hyperactivity Disorder (ADHD) in
children (Amoly et al., 2014). Annual time spent at the beach was negatively associated with
behavioural difficulties, in particular peer relationship problems, but positively associated with
strength in prosocial behaviour. Dadvand et al. (2015) demonstrated that greater surrounding
greenness at home and school was associated with improved cognitive development (better progress
in working memory and reduced inattentiveness) in schoolchildren. The association was partly
mediated by reduced exposure to air pollution. A number of other studies have demonstrated the
positive impact of green space exposure on ADHD and related symptoms (Faber Taylor & Kuo, 2011;
van den Berg and van den Berg, 2011; Markevych et al., 2014).
2.3.2 Reduced cardiovascular morbidity
A study in the United Kingdom (Mitchell and Popham, 2008) found an association between low
quantities of neighbourhood green space and elevated risk of circulatory disease. A study in Lithuania
found that distance to green spaces has little or no influence on levels of known cardiovascular risk
factors or the prevalence of coronary heart disease and stroke. However, there were significant
associations between a more intense use of green space and reduced risk of cardiovascular disease
(Tamosiunas et al., 2014). In a Lithuanian intervention study, Grazuleviciene et al. (2015b) found that
walking in the park had a greater effect on reducing heart rate and diastolic blood pressure than
walking in a busy urban street. They suggest that walking in a green space (such as a park) could be
encouraged as rehabilitation from coronary artery disease.
Pereira et al. (2012) also found an inverse association between the levels and variability of
neighbourhood greenness, which was assessed using NDVI data, and coronary heart disease or
stroke in Australia. The odds of hospitalization and self–reported heart disease were lower for those
living in neighbourhoods with highly variable greenness, compared to those with low variability in
greenness. This effect was independent of the absolute levels of neighbourhood greenness. There
was weaker evidence for associations with the mean level of neighbourhood greenness. The authors
hypothesized that greater variability in neighbourhood greenness reflects two potential promoters of
physical activity – an aesthetically pleasing natural environment and access to urban destinations.
102.3.3 Reduced prevalence of type 2 diabetes
It is well‐known that type 2 diabetes mellitus can be prevented by life‐style interventions that
improve physical activity and reduce obesity. Therefore, it is plausible that access to green spaces
can prevent diabetes by promoting more active lifestyles. Cross‐sectional observational studies in
The Netherlands, Australia and the United Kingdom demonstrated significant associations between
neighbourhood greenness and reduced odds of having type 2 diabetes mellitus (Astell‐Burt et al.,
2014a; Maas et al., 2009b; Bodicoat et al., 2014). A study in Germany demonstrated an inverse
association between neighbourhood greenness (measured by NDVI) and insulin resistance in
adolescents (Thiering et al., 2016). The authors concluded that this apparent protective effect was
due to vegetation reducing exposure to traffic‐related air pollutants.
2.3.4 Improved pregnancy outcomes
A systematic review and meta‐analysis (Dzhambov et al., 2014) showed that access to green space in
close proximity to the homes of pregnant women was positively associated with birth weight. Birth
weight is a useful indicator of health in early life: low birth weight is one of the major predictors of
neonatal and infant mortality, as well as long‐term adverse effects in childhood and beyond. Recent
studies in Israel, Germany and England (Agay‐Shay et al., 2014; Markevych et al., 2014; Dadvand et
al., 2014b) also found a positive association between residential greenness measured by NDVI and
birth weight. A study in Lithuania demonstrated that a larger distance to a city park from the homes
of pregnant women was associated with increased risk of preterm birth and reduced gestational age
at birth (Grazuleviciene et al., 2015a). However, a study in southern California in the United States
showed only a weak relationship between green space and preterm births (Laurent et al., 2013). No
association was found between greenness and preeclampsia (Agay‐Shay et al., 2014; Laurent et al.,
2013).
2.3.5 Reduced mortality
Evidence that exposure to urban green space is linked to reduced mortality rates is accumulating
(reviewed by Gascon et al., 2016). Studies in Japan have shown that the five‐year survival rate in
individuals aged over 70 was positively associated with having access to more space for walking and
with parks and tree‐lined streets near the residence (Takano et al., 2002). Another study of pre‐
retirement age population in England showed evidence of the influence of the amount of green
space in the neighbourhood on all‐cause mortality (Mitchell and Popham, 2008). The study
reinforced earlier findings based on the 2001 census population of England, which found that a
higher proportion of green space in an area was associated with better self‐reported health (Mitchell
& Popham, 2007).
A recent longitudinal study of approximately 575,000 adults in Canada found that increased
residential green space was associated with a reduction in mortality (Villeneuve et al., 2012); the
strongest effect was on mortality from respiratory diseases. It should be noted that such findings
may also reflect the type of urban development and availability of public transport or walkable
streets. In Spain, Xu et al. (2013) showed that perceived greenness of neighbourhoods was associated
with lower mortality risk during heat waves.
A recent systematic review demonstrated that the majority of previously conducted studies showed
a reduction of the risk of cardiovascular disease (CVD) mortality in areas with higher residential
greenness; results of meta‐analysis supported the hypothesis that living in areas with higher amounts
of green space reduces CVD mortality, while evidence of a reduction of all‐cause mortality is more
limited (Gascon et al., 2016). In the United States, residential proximity to green space has been
associated with a reduced risk of stroke mortality (Hu et al., 2008) and with higher survival rates after
ischemic stroke (Wilker et al., 2014). In contrast to the above findings, Richardson et al. (2012) did
not find an association between availability of green spaces and overall mortality in the 49 largest US
11You can also read