US National Poll: 2020 Presidential Election Oct 26 - Oct 28 2020
←
→
Page content transcription
If your browser does not render page correctly, please read the page content below
US National Poll: 2020 Presidential Election
Oct 26 – Oct 28 2020

                                               © 2020 AtlasIntel
                                               All Rights Reserved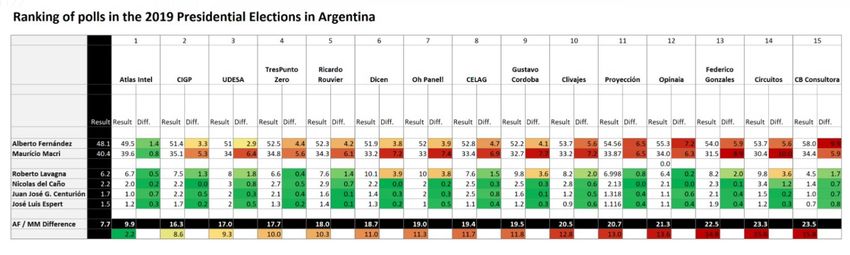
Methodology & Sample Profile
This study was conducted by AtlasIntel, an independent research & data intelligence firm.
Random interviews of US adults were conducted online between October 26 and October 28 2020. The sample was post-stratified with
propensity scores to match the profile of registered voters on the following variables: gender, region, age group, education, family income,
and race. Results are reported for 1726 likely voters. The margin of error for likely voters is +/-2% at the 95% confidence level. Some
percentages do not add up to 100% due to rounding.
More information about AtlasIntel can be obtained by visiting www.atlasintel.org.
Gender Vote
Partisanship
in 2016 Presidential
(self-reported)
Elections
Female 51.8% Democrats
Hillary Clinton 34.3%
44.7%
Male 48.2% Republicans
Donald Trump 31.6%
43.4%
Independents
Other; doesn’t remember; didn’t vote 34.1%
11.9%
Age Group
18 – 29 17.8% Household
Household income
income
30 – 44 25.7% Below
Below 50k
50k 38.8%
38.0%
38.1%
45 – 64 41.7% 50k – 100k
50k – 100k 31.2%
32.0%
32.5%
65+ 14.8% Above
Above 100k
100k 30.1%
30.0%
29.5%
Race Education
Education
White 75.9% College
College degree
degree or
or higher
higher 34.6%
34.0%
34.6%
Black 10.3% All other
All other 66.0%
65.4%
Hispanic 9.9%
Asian 2.6%
Vote
Votein
in 2016
2016 Presidential
PresidentialElections
Election
Other Donald
Hillary Clinton
Trump 43.9%
44.7%
1.3%
Hillary
Donald Clinton
Trump 45.3%
43.4%
Other,
Other; don’t
doesn’t
remember,
remember;
didn’t
didn’t
vote
vote 10.8%
11.9%
2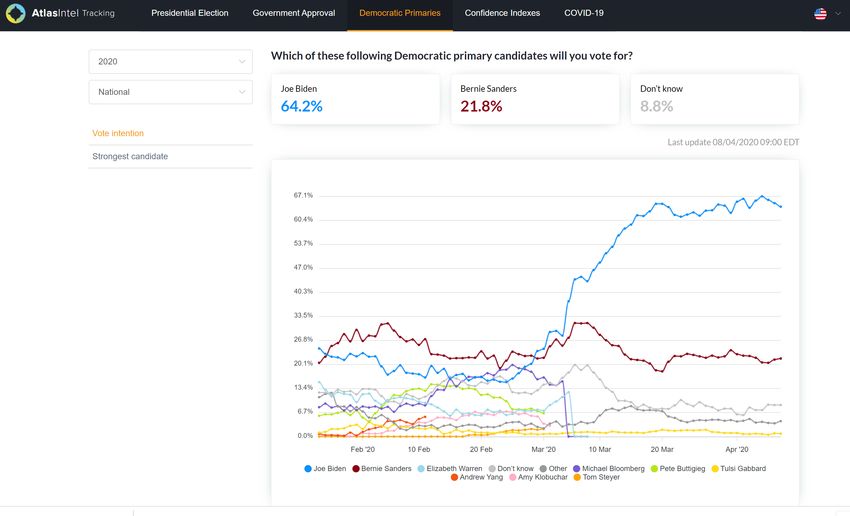
I. Presidential Election
1   Whom will you vote for in the US presidential election?

                               Aug-20        Oct-20
    Joe Biden                      49            51
    Donald Trump                   46            46
    Other                           1             1
    Won’t vote                      1             1
    Don’t know                      2             1

     Donald Trump                                                  46.2

         Joe Biden                                                        50.9

             Other       1.1

       Won't vote        0.9

        Don’t know       0.9
                     0                  10       20     30    40     50          60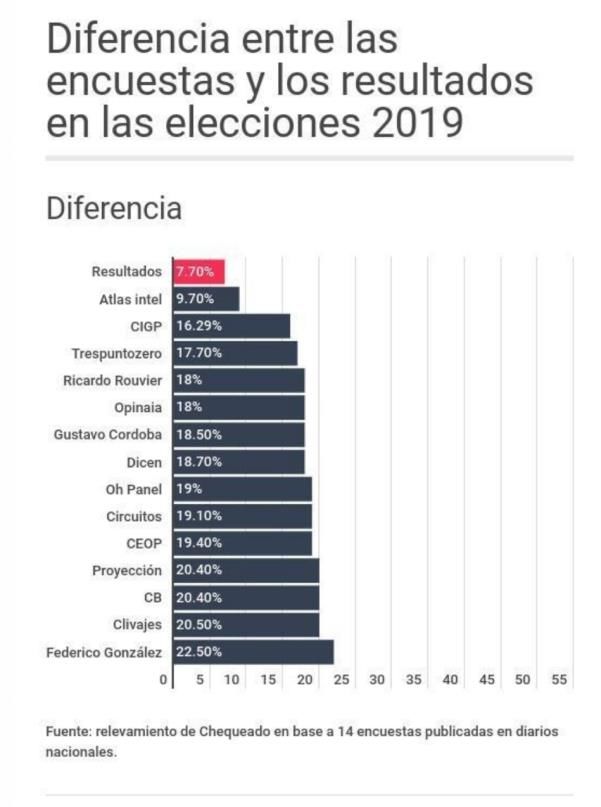
1   Whom will you vote for in the US presidential election?
    [Crosstabs]
II. Presidential Approval

2   Do you approve or disapprove of the job Donald Trump is doing as president?

                            Feb-20    Aug-20    Oct-20
    Approve                     45        47        46
    Disapprove                  54        52        53
    Don't know                   1         1         1

       Approve                                                           46.1

     Disapprove                                                                   52.7

     Don’t know       1.2

                  0              10        20        30         40          50           60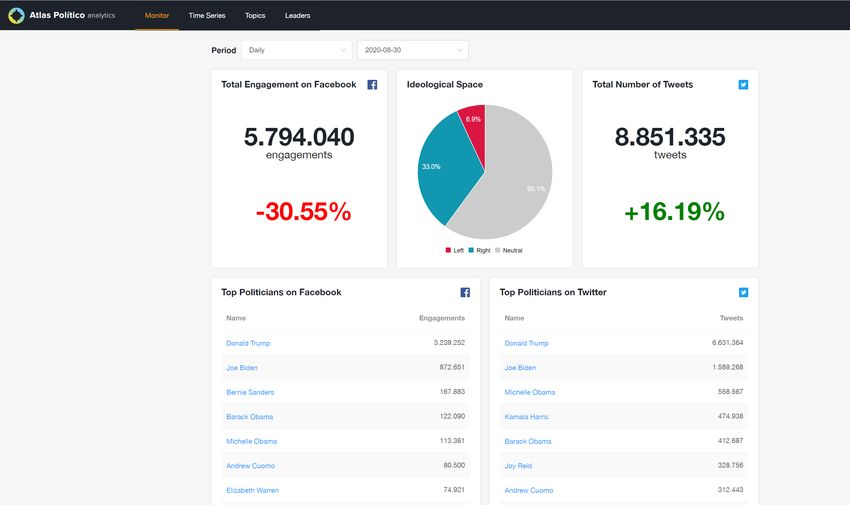
2   Do you approve or disapprove of the job Donald Trump is doing as president?
    [Crosstabs]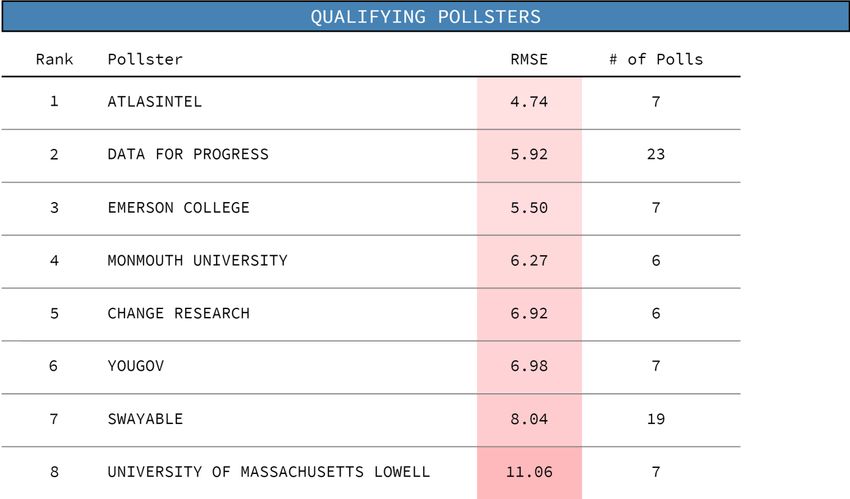
III. COVID-19
3   How do you evaluate President Trump's response to the coronavirus pandemic?

                             Aug-20         Oct-20
    Terrible                     49             48
    Bad                           4              5
    Good                         19             21
    Excellent                    27             25
    Don't know                    1              1

        Terrible                                                                                 47.6

            Bad                  5.4

          Good                                            20.9

       Excellent                                                      25.2

    Don't know         0.9
                   0         5         10    15      20          25          30   35   40   45    50
3 How do you evaluate President Trump's response to the coronavirus pandemic?
[Crosstabs]4 Are you afraid of getting infected with the coronavirus?
Aug-20 Oct-20
No 43 40
Yes, I fear getting sick 36 39
Yes, I fear for my life 21 21
No 39.7
Yes, I fear for my life 21.2
Yes, I fear getting sick 39.1
0 5 10 15 20 25 30 35 40 454 Are you afraid of getting infected with the coronavirus?
[Crosstabs]5 Thinking about the next few weeks, are you more worried about the economic toll of the
coronavirus crisis or the people whose lives may be in danger?
Aug-20 Oct-20
The people whose lives
50 50
may be in danger
The economic toll 42 42
Don't know 8 9
The people whose lives may be in danger 49.8
The economic toll 41.5
Don't know 8.7
0 10 20 30 40 50 605 Thinking about the next few weeks, are you more worried about the economic toll of the
coronavirus crisis or the people whose lives may be in danger?
[Crosstabs]6 Right now, do you think that the national public health crisis generated by the coronavirus
is getting better or getting worse?
Aug-20 Oct-20
Getting worse 46 48
Getting better 40 39
Don't know 14 13
Getting worse 48.0
Getting better 39.3
Don't know 12.8
0 10 20 30 40 50 606 Right now, do you think that the national public health crisis generated by the coronavirus
is getting better or getting worse?
[Crosstabs]7 Right now, do you think that the social distancing measures imposed by authorities should
be strengthened, relaxed, or remain unchanged?
Aug-20 Oct-20
Strengthened 43 40
Relaxed 32 34
Remain
21 24
unchanged
Don’t know 3 2
Strengthened 40.0
Remain unchanged 23.8
Relaxed 34.0
Don’t know 2.2
0 5 10 15 20 25 30 35 40 457 Right now, do you think that the social distancing measures imposed by authorities should
be strengthened, relaxed, or remain unchanged?
[Crosstabs]In 2020, AtlasIntel polls for the US democratic primaries had the smallest mean error across all pollsters. AtlasIntel conducted the most accurate polls in New Hampshire, California, and Florida. Performance up to February 12 2020 Performance up to March 15 2020 Source: G. Elliott Morris, The Economist Source: Jack Kersting, JHK Forecasts https://twitter.com/gelliottmorris/status/1227454160813088769 https://projects.jhkforecasts.com/democratic_primary/analysis/
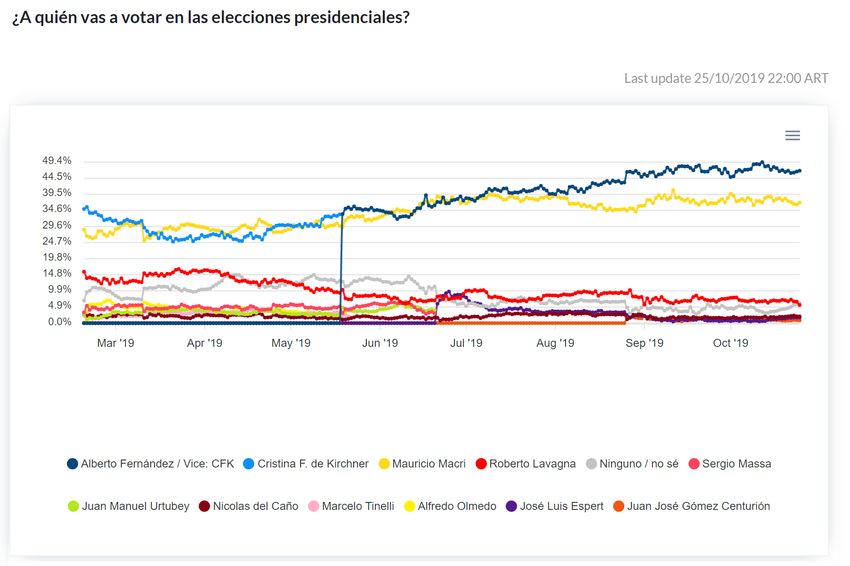
AtlasIntel had the best performance in anticipating the results of the 2019
Presidential Elections in Argentina. We conducted the only poll that predicted the
results of all candidates within the margin of error.
Atlas Tracking PRO
Nationally-representative daily poll with more than 30 questions on the political and economic
scenario. The polling is conducted online based on a proprietary methodology for random
selection and sample post-stratification and validation.

✓ Currently available for:

    North America        US Swing States      South America     Europe
    ▪   United States    ▪   Arizona          ▪   Argentina     ▪   France
    ▪   Mexico           ▪   Florida          ▪   Brazil        ▪   Germany
                         ▪   Georgia          ▪   Chile         ▪   Netherlands
                         ▪   Ohio             ▪   Colombia      ▪   Italy
                         ▪   Michigan         ▪   Peru          ▪   Spain
                         ▪   North Carolina                     ▪   UK
                         ▪   Pennsylvania
                         ▪   Texas
Atlas Tracking PRO is accessible in real time through a secure URL
Atlas Monitor
Atlas Monitor tracks political engagement in social media in real time.
We deploy big data tools to transform huge quantities of information
into intuitive and useful indicators that reveal the impact of network
sentiment on political developments and electoral dynamics. All of our
work carefully adheres to the privacy rights of social media users, to
platform policies, and to local and international legislation.
Atlas Monitor is accesible in real time through a secure URL
Media & Client Inquiries: info@atlasintel.org
You can also read