Use of climate reanalysis for EEA climate change assessment Blaz Kurnik - European Environment Agency (EEA)
←
→
Page content transcription
If your browser does not render page correctly, please read the page content below
Use of climate reanalysis for EEA climate change
                                      assessment

                                       Blaz Kurnik
                    European Environment Agency (EEA)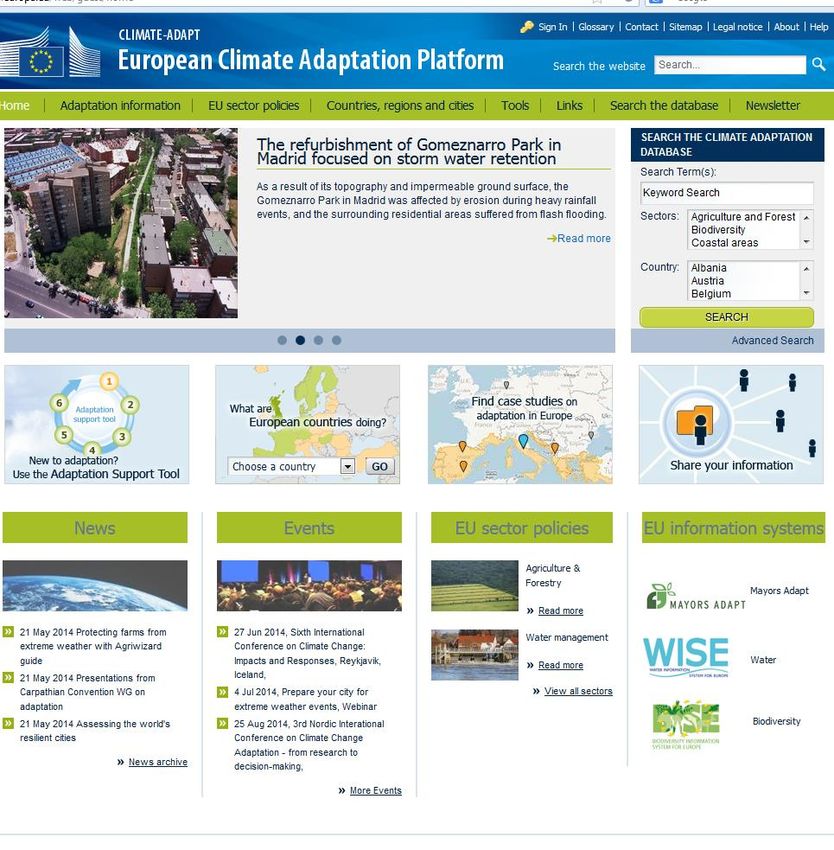
2016: EEA content priorities

•   Circular economy
•   Climate and Energy
•   Sustainable Development Goals
•   Refit Monitoring and Reporting
•   Natural Capital
•   Copernicus: land monitoring service and in-situ coordination
•   SOER2020
EEA and Copernicus Climate Change Service
Data for
                    Information for
analysing climate                           Active user
                    supporting adaptation
change impacts

   Climate
                         Climate –           Providing
    change
                          ADAPT                user
  indicators
                       information          feedback to
      and
                          system            the Service
 assessments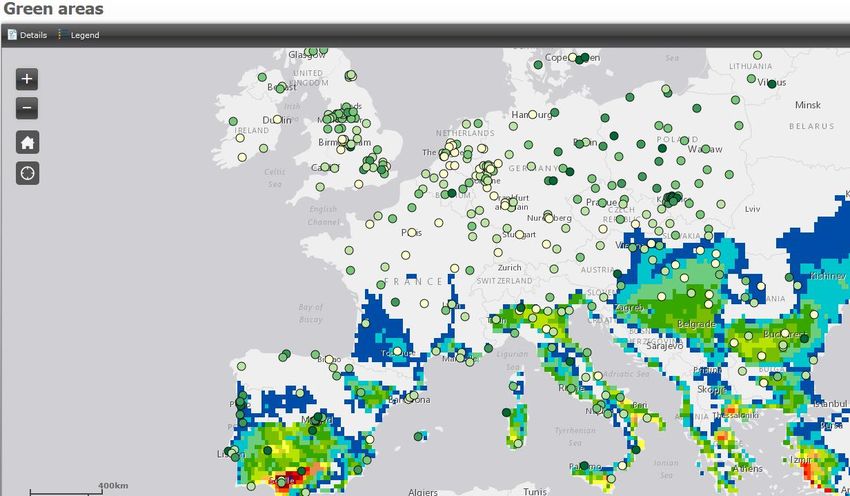
Climate change, impacts, vulnerabilities, and adaptations

• Climate change impacts indicators

• Climate change impacts report

• Report on Extreme weather and
  climate in Europe

• Climate – ADAPT
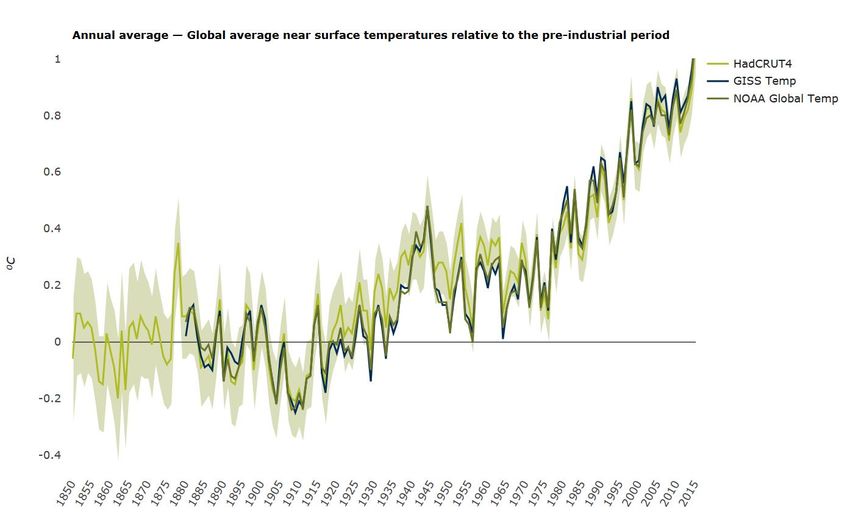
Climate indicators – Temperature

• An indicator on Global and European
  temperature
• Answering the policy question on 2 °C target
• Updated and improved annually
• Various global and European datasets used
• Uncertainty information presented in different
  ways
• 2015 the warmest year on record, according to
  different near-surface temperature observational
  analyses with anomalies close to 1oC.

• the decade 2006-2015 was between 0.83 and 0.89 oC
  warmer than the period 1850-1899 (pre-industrial)
Global temperature

EEA, UK – Met Office based on HadCRUT4 (Morice et al., 2012), NOAAGlobalTemp (Karl et al, 2015) and NASA-GISS (Hansen et al., 2010)
Reasons

 • Anthropogenic influence – C02 concentration
      close to 400 ppm (highest in last 800 000 years)
ppm

                                                          2015 values
                                                          ~ 400 ppm

                                                         2015

 Based on Luthi, et al., 2008; US EPA, 2015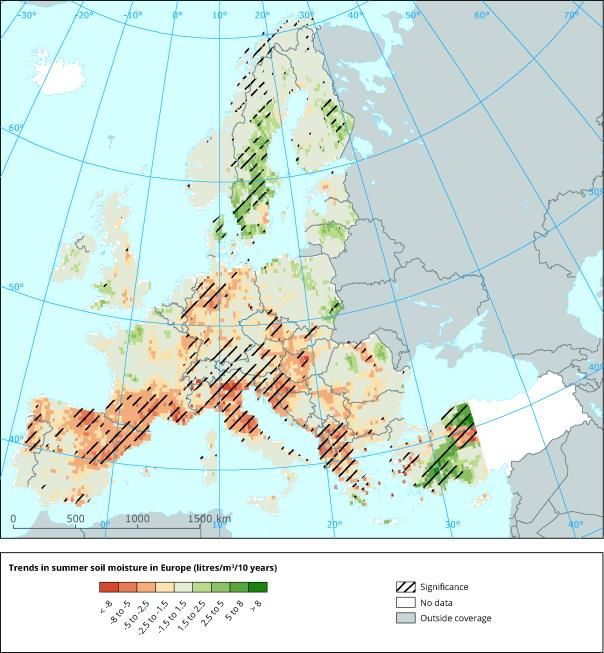
Reasons

• ENSO (strong positive phase after 1998)
Timeseries of global temperature

New data with more stations available

Based on NOAAGlobalTemp (Karl et al, 2015)
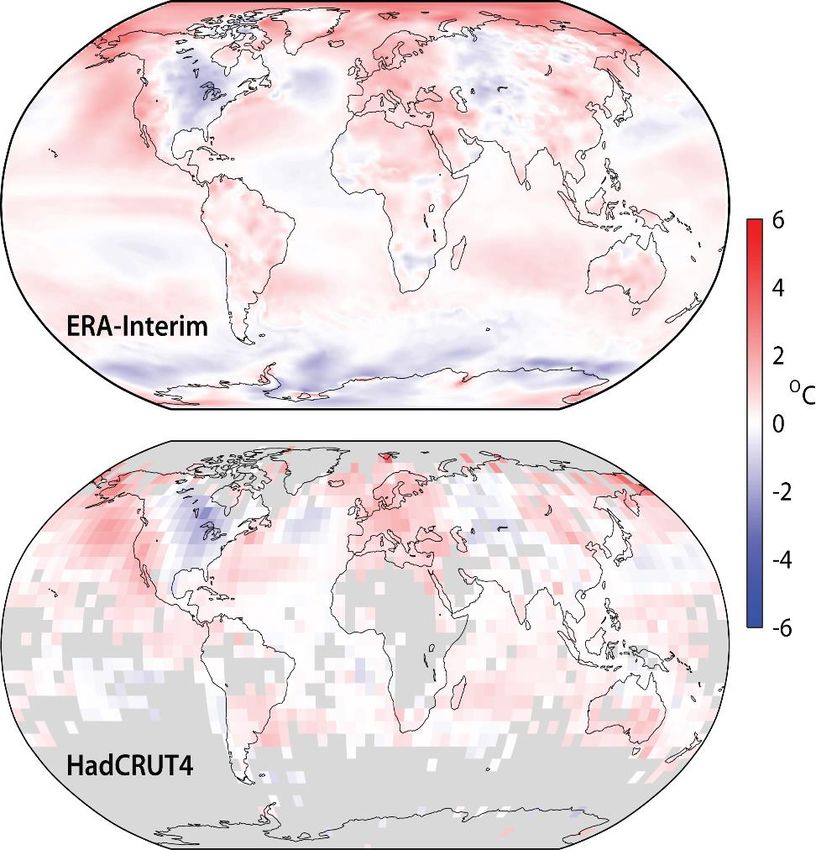
Global and European temperature using reanalysis

                               Temperature anomalies in 2015

 ERA-Iterim, Dee et al, 2011, HadCRUT4 (Morice et al., 2012)
European temperature EEA, UK – Met Office based on HadCRUT4 (Morice et al., 2012), NOAAGlobalTemp (Karl et al, 2015) and NASA-GISS (Hansen et al., 2010) and E-OBS (Haylock, 2008)
European temperature

Source: van der Schrier, 2013; Haylock, 2008
EEA report on climate extremes in Europe
Observations and projections of extreme events
Droughts
Extreme temperature
(meteorological, soil moisture
(Heat waves)
and hydrological droughts)
Hail Heavy precipitation
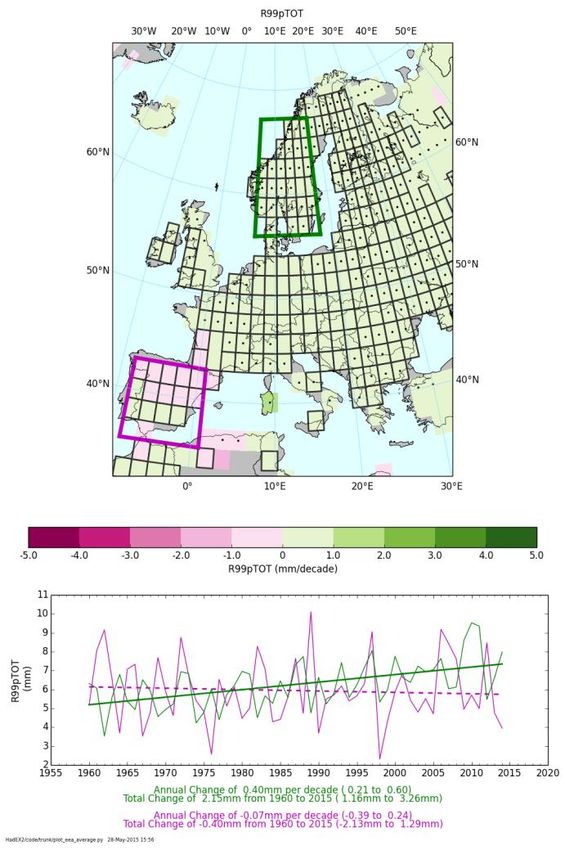
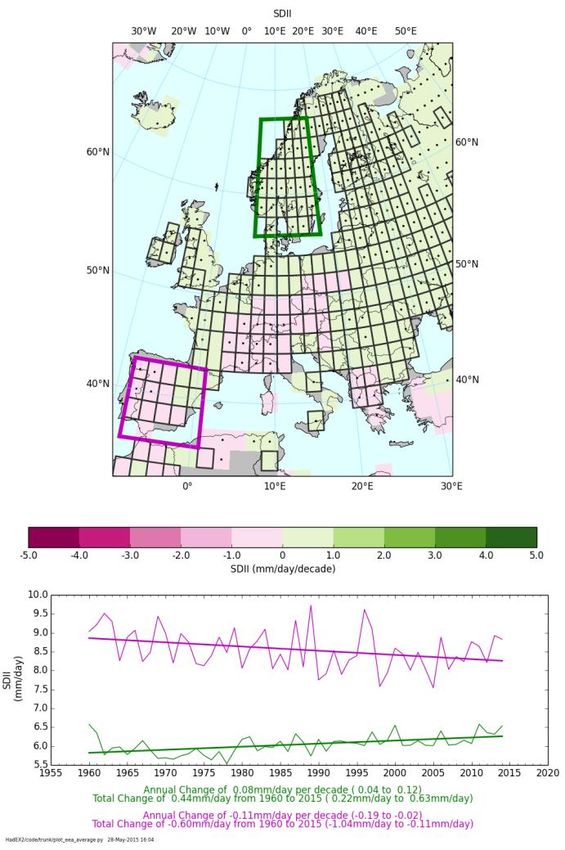
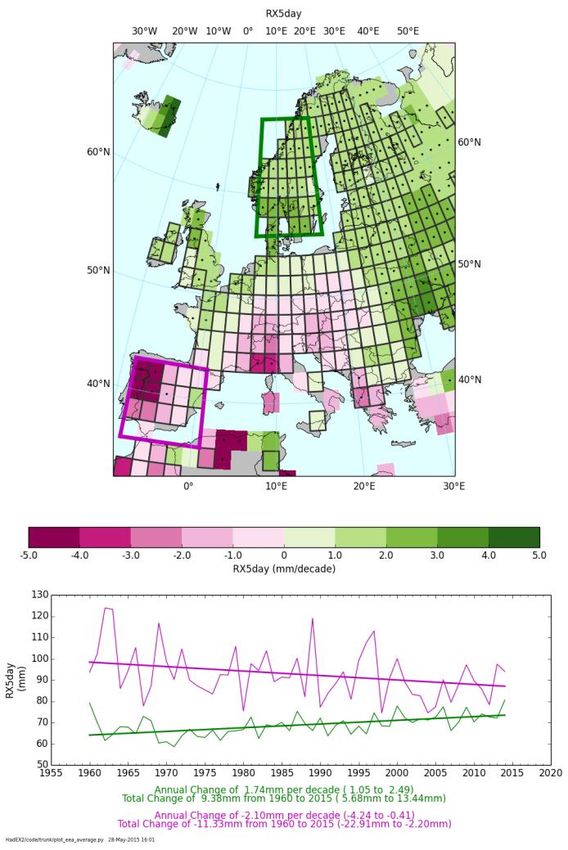
http://cca.eionet.europa.eu/docs/Precipitation extremes – use of different indices EEA, UK – Met Office based E-OBS (Haylock, 2008)
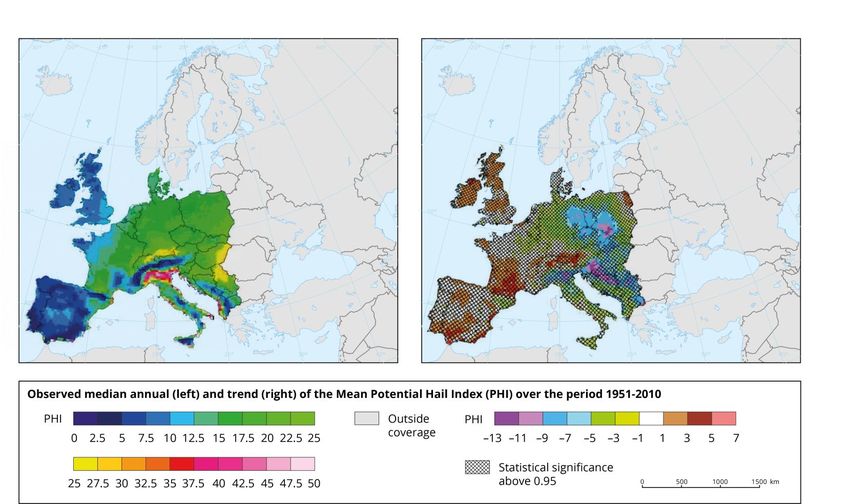
Trends in hail events

   Trends in mean potential hail index (PHI)

Based on the logistic hail model (Mohr, Kunz, and Geyer, 2015)
and reanalysis data from NCEP-NCAR (Kalnay et al., 1996).
Key messages from the report

•   Since 2003 Europe has experienced several extreme summer heatwaves (2003, 2006,
    2007, 2010, 2014 and 2015). Heat waves are projected to become the norm in the
    second half of the 21st century under a high forcing scenario (RCP8.5).

•   The length of wet spells as well as the intensity of heavy precipitation events have
    decreased in southwestern Europe but increased in northern and northeastern Europe
    since 1960s. High resolution precipitation dataset not available.

•   Since 1951 increasing hail trends have been noted in southern France parts of Spain
    and Austria, and decreasing (but not significant) trends in parts of eastern Europe. No
    observation data over Europe.
Climate Change impact report – under preparation • Assessing impacts of past and future climate change • Chapters on climate system, climate impacts on socio-economic sectors, ecosystems, and health • Vulnerability to climate change
Addressing different socio-economic sectors

• Disaster risk reduction: e.g. Number of climate
  extremes with recorded impacts
• Agriculture: e.g. Soil moisture
• Energy: e.g. Heating and cooling degree days
• Transport: e.g. Impacts of extreme events
• Tourism: e.g. Summer and winter tourism
• Urban: e.g. Impacts of heat waves
Economic losses from natural hazards

   No clear trends in damages                                      Positive trends in number
   cumulatively 400 billion Euro in                                driven primarily by better
   1980 - 2013                                                     reporting and by socio-economic factors

Munich Re NatCatService EEA member countries, inflation adjusted
values
Agriculture - Trends in soil moisture droughts

                              In the last decade 15%
                              territory and 17% population
                              affected by droughts each
                              year.

                              Droughts have increased in
                              parts of Europe, in particular
                              in south-western and central
                              Europe
Energy – Heating degree day (HDD)
Changes in HDD combined with C02 emissions from residential sector
15%
10%
5%
0%
-5%
-10%
-15%
-20%
1991
1992
1993
1994
1995
1996
1997
1998
1999
2000
2001
2002
2003
2004
2005
2006
2007
2008
2009
2010
2011
2012
2013
2014
change in HDD change in C02Vulnerability to climate change in urban regions • 70 % of Europeans reside in urban areas, also economic centres of Europe • Urban areas exposed to heat waves, urban flooding, water scarcity, forest fires • High spatial resolution datasets needed (climate + impact models)
European Climate Adaptation Platform Climate-ADAPT
Scope:
• Launched 2012, supports
developing and implementing
adaptation strategies, policies
and actions
• Complementary to national,
other platforms
Intended Users:
• Experts and decision makers on
EU, transnational, national, sub-
national levels, research
institutes
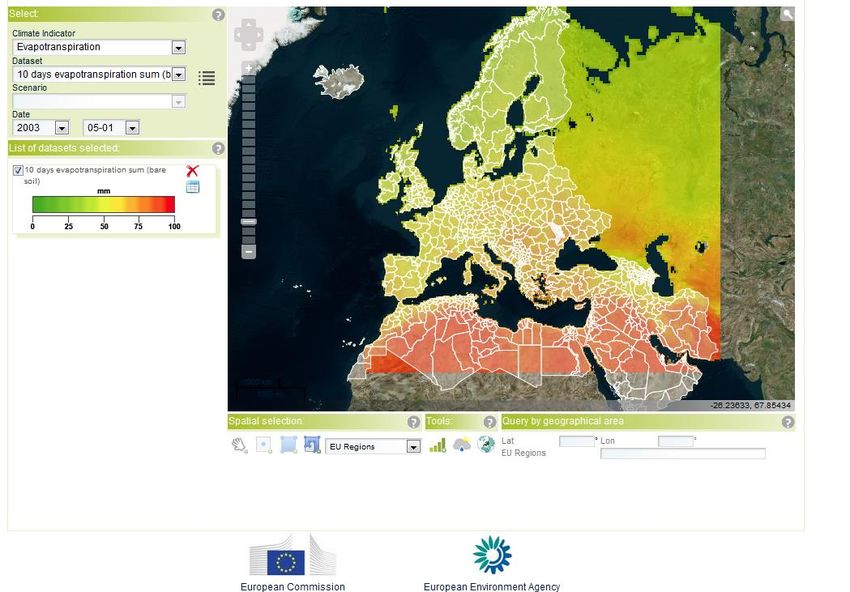
http://climate-adapt.eea.europa.euClimate information for policy makers
Selection of a
ECV or an index
for a selected
timestamp
Options for spatial aggregation
Temporal presentation of
selected ECVConclusions • Need for high resolution datasets for assessing extreme events. • Need for homogenised datasets (spatially and temporarily). • Inclusion of indices for the use in the indicators in different socio-economic sectors. • Availability of data for the regions outside Europe to assess climate change impacts on Europe. • Ready and easily available datasets for immediate use for all users.
Thank you
See for more information:

http://www.eea.europa.eu/themes/climate
http://climate-adapt.eea.europa.eu/
You can also read