Use of environmental DNA to survey the distribution of the invasive mussel Limnoperna fortunei in farm ponds - J-Stage
←
→
Page content transcription
If your browser does not render page correctly, please read the page content below
Plankton Benthos Res 16(2): 100–108, 2021
                                                                                                            Plankton & Benthos
                                                                                                                 Research
                                                                                                             © The Japanese Association of Benthology

Use of environmental DNA to survey the distribution of
the invasive mussel Limnoperna fortunei in farm ponds
Kenji Ito* & Hiroyuki Shibaike

Institute for Agro-Environmental Sciences, National Agriculture and Food Research Organization, Biodiversity Division,
3–1–3 Kannondai, Tsukuba 305–8604, Japan
Received 17 December 2019; Accepted 27 October 2020 Responsible Editor: Osamu Miura
doi: 10.3800/pbr.16.100

          Abstract: The golden mussel Limnoperna fortunei (Dunker, 1857) is an invasive freshwater bivalve species that
          exerts harmful effects on the environment, as well as man-made structures, such as water-treatment systems. By using
          conventional sampling methods, it is difficult to detect mussels under low-density conditions; however, environmen-
          tal DNA (eDNA) analysis may be a rapid and efficient method for monitoring this aquatic organism. In this study,
          we conducted surveys based on the eDNA analysis of L. fortunei in 15 farm ponds in Japan and compared the results
          with those of two conventional survey methods, visual census and plankton larval survey, to clarify the effectiveness
          of eDNA analysis for field surveys of L. fortunei. Primers and a probe specific to L. fortunei were developed, and a
          method for analysis was established. In the laboratory experiments, the species eDNA was detected in all water tanks
          containing the mussels, and the concentration of eDNA was high in the experimental tank that had high density of L.
          fortunei. In the field survey, L. fortunei eDNA was detected in all ponds where the mussels were found by conventional
          survey, and low concentrations of eDNA were also detected in several ponds where no L. fortunei were found by tradi-
          tional methods. These results suggest that eDNA analysis has greater sensitivity for the detection of L. fortunei in farm
          ponds than that of conventional methods. Environmental DNA surveys have little impact on water management and are
          suitable for surveys at water facilities that have not yet been damaged by the mussels.

          Key words: agricultural water facilities, golden mussel, environmental DNA (eDNA), Limnoperna fortunei

                                                                         is a small freshwater bivalve species native to China and
                          Introduction
                                                                         Korea (Miller & McClure 1931, Morton 1973, Tominaga &
   Non-native species introduced from their natural range                Kimura 2012), which has likely been introduced into sever-
into other habitats are important factors affecting natural               al other Southeast Asian countries (Cambodia, Laos, Thai-
ecosystems and biodiversity (Vitousek et al. 1996). For the              land, Vietnam) as a result of human displacement (Morton
control of alien species, it is important to determine their             & Dinesen 2010). This species has an epifaunal mode of
distribution quickly and accurately. However, alien species              life and exerts a harmful influence on the environment
in the early stage of invasion are generally low in density,             and man-made structures, such as water-treatment systems
often requiring much time and effort for detection. To over-              and power stations. The species now inhabits many coun-
come this issue, the method of analyzing environmental                   tries in Asia (Hong Kong, Korea, Japan, and Taiwan) and
DNA (eDNA), which is derived from target species released                South America (Argentina, Bolivia, Brazil, Paraguay, and
into the environment, has recently been developed. The de-               Uruguay) (Boltovskoy et al. 2006, de Oliveira et al. 2006,
tection of alien species using eDNA has been investigated                Morton & Dinesen 2010).
in various aquatic species (Cowart et al. 2018, Ficetola et al.             The golden mussel is usually detected in freshwater
2008, Fukumoto et al. 2015, Goldberg et al. 2013).                       systems by performing a visual census (Darrigran & de
   The golden mussel Limnoperna fortunei (Dunker 1857)                   Drago 2000, Darrigran & Pastorino 1995, Ito 2008), us-
                                                                         ing artificial substrata (Bergonci et al. 2009, Boltovskoy &
                                                                         Cataldo 1999, Ito et al. 2018), and/or collecting planktonic
* Corresponding author: Kenji Ito; E-mail, itoken@affrc.go.jp             larvae (Cataldo & Boltovskoy 2000). Using these methods,
eDNA analysis for golden mussel 101
however, makes it difficult to detect the mussel under low- this purpose, we designed primers and a probe specific
density conditions (i.e., early stage of invasion). For ex- to L. fortunei and tested its specificity and quantitative
ample, the introduction of L. fortunei into a reservoir was capability. In addition, we conducted an eDNA survey of
overlooked in a previous yearʼs visual and artificial-trap the mussel in farm ponds using the primer–probe set and
surveys (Ito 2016). To overcome this issue, research on L. compared the results to two conventional methods, visual
fortunei using eDNA analysis has been conducted in Asia census and plankton larval survey.
and South America (Pie et al. 2017, Xia et al. 2018a, Xia et
al. 2018b). These studies, however, provide little informa-
Materials and Methods
tion on the relationship between L. fortunei abundance and
field eDNA concentrations. In order to use eDNA in field
Design of species specific primers and probe
surveys of organisms, it is important to compare its effec-
tiveness to that of conventional census methods (Roussel et To design specific primers and probes, we obtained
al. 2015, Togaki et al. 2020, Tréguier et al. 2014). sequences of the cytochrome c oxidase subunit I (COI)
The aim of this study was to investigate the ability of mitochondrial gene for nine bivalve species, including L.
eDNA analysis to detect L. fortunei in field surveys. For fortunei. Sequences of Corbicula fluminea, C. japonica,
Fig. 1. Results of multiple alignment for partial COI region of nine bivalve species, Corbicula fluminae, C. japonica, Crassostrea nippona,
Limnoperna fortunei, Musculista senhousia, Mytilus galloprovincialis, M. trossulus, Perna viridis, and Xenostrobus securis. The underlined
nucleotide sequences indicate the positions of a set of primers (Forward: CATAGAACCCCAGCAGTTGACA; Reverse: AACGAACCG
CCGATTGAC) and a probe (AGCTGCTTTATCTCTTC) for TaqMan assay. A hyphen indicates a sequence gap and an asterisk indicates a
common nucleotide among the sequences.102 K.Ito & H. Shibaike
Crassostrea nippona, L. fortunei, Musculista senhousia, GCA GTT GAC A-3′; reverse primer sequence, 5′-AAC
Mytilus galloprovincialis, M. trossulus, Perna viridis, and GAA CCG CCG ATT GAC-3′; and probe sequence, 5′-
Xenostrobus securis were downloaded from Bioinforma- FAM-AGC TGC TTT ATC TCT TC-MBG-3′.
tion and DDBJ Center (accession numbers: AB498017, Quantitative PCR (qPCR) was performed in a final vol-
AB498018, AF300616, AB498011, AB498013, AB498014, ume of 25 µL, using 3 µL of template DNA, 12.5 µL Taq-
AB498016, AB498015, and AB498012, respectively). Out Man Environmental Master Mix 2.0 (Life Technologies),
of these nine bivalves, L. fortunei and C. fluminea are both 6.5 µL ddH2O, 1 µL of each primer (10 μM), and 1 µL of
freshwater species. The species most closely related to L. probe (2.5 μM) under thermal cycling at 50°C for 5 min
fortunei is X. securis (Lee et al. 2019), and C. fluminea and and 95°C for 10 min, followed by 40 cycles of 95°C for 15 s
C. japonica, from the family Corbiculidae, were found in and 60°C for 1 min. Samples were run on a StepOnePlus
habitats similar to those of L. fortunei. Real-Time PCR System (Applied Biosystems). A dilution
These sequences were aligned using Clustal W (Larkin series of L. fortunei DNA from tissues, ranging from 102
et al. 2007), and unique regions were identified by compar- to 10−4 ng/µL, was used as the qPCR standard. We con-
ing the L. fortunei sequence with those of the eight other ducted each qPCR twice with two replicates for aquarium
bivalve species. Given that DNA in aquatic ecosystems is and field samples, and four to six wells of negative control
usually highly degraded, we designed primers with frag- (double distilled H2O) were used per PCR plate. The limit
ment lengths as short as possible by using Primer Express of detection of qPCR was identified as the lowest concen-
3.0 (Thermo Fisher Scientific) based on suggestions from tration producing at least one positive detection out of the
other studies (Bohmann et al. 2014, Dougherty et al. 2016). two replicates. To avoid contamination, we conducted pre-
Figure 1 shows the positions of a set of primers and a PCR and PCR experiments in different rooms.
probe for a TaqMan assay (Thermo Fisher Scientific) to
amplify a 78 bp fragment of the COI region of L. fortunei. Quantification standard
To prepare a quantification standard, we amplified the
Specificity test for newly designed primers
78 bp nucleotide sequence of the partial COI region of L.
A well-designed primer pair should amplify only L. for- fortune using newly designed primers. After PCR prod-
tunei COI. The specificity of the primer set was evaluated ucts were excised from the 1% agarose gel (NuSieve GTG;
by performing PCR with DNA extracted from six bivalve FMC), they were cloned using a Mighty TA-cloning kit
species, C. fluminae, C. gigas, L. fortunei, M. gallopro- (TaKaRa). Double-stranded plasmid DNA was purified
vincialis, P. viridis, and X. securis, as templates. These bi- from recombinant colonies using NucleoSpin Plasmid Eas-
valve species were fixed in 99.5% ethanol and stored at 4°C yPure (TaKaRa). Purified plasmid DNAs were sequenced
until DNA extraction. Muscle tissues were collected from using a Genetic Analyzer 3130xl auto sequencer (Applied
each adult bivalve species, and total DNA was extracted Biosystems) using the BigDye Terminator v3.1 Cycle Se-
from each tissue sample using the DNeasy Blood & Tissue quencing Kit (Applied Biosystems). We then created a cali-
Kit (Qiagen), according to the manufacturerʼs instructions. bration curve using a series of dilutions of plasmid from
The region of the mitochondrial cytochrome c oxidase sub- 101 to 106 per reaction as a quantification standard and
unit I (COI) gene was amplified by PCR using the follow- converted the DNA concentration into the number of cop-
ing primers: 5′-CAT AGA ACC CCA GCA GTT GAC A-3′ ies of COI.
and 5′-AAC GAA CCG CCG ATT GAC-3′ (Fig. 1). PCR
Aquarium experiment
was conducted in a 25 µL reaction volume containing
1× PCR buffer, 10 ng of template DNA, 0.05 mM of each Animals used for the aquarium experiment were collect-
dNTP, 0.4 mM of each primer, 2.0 mM MgCl2, and 0.5 ed from the shore of Lake Kasumigaura (36°02′46.19″N,
unit of Taq Polymerase (TaKaRa Bio Inc.). PCR amplifica- 140°13′40.13″E) in June 2018. A submerged brick covered
tion was performed in an iCycler (Bio-Rad) with a ther- with golden mussels was collected and brought back to the
mal profile consisting of an initial denaturation at 94°C for laboratory in a pail with wet towels. The mussels were ac-
5 min, followed by 30 cycles of denaturation at 95°C for climated at room temperature (~24°C) under a 14 h : 10 h
20 s, annealing at 55°C for 20 s, and extension at 72°C for light–dark cycle in a 60 L aquarium tank for 5 days. Dur-
40 s, with a final extension at 72°C for 7 min. PCR prod- ing acclimation, animals were fed every 2 days with a
ucts were electrophoresed on a 2% agarose gel. Gels were commercial Chlorella sp. (Nama Chlorella v12; Chlorella
then stained with ethidium bromide. Industry Co., Ltd, Japan).
A sample containing one mussel, and a second contain-
Quantitative PCR analyses ing five animals, with three replicates for each treatment,
Limnoperna fortunei DNA was amplified using prim- and one blank control that did not include any animals were
ers and probes to amplify a 78-bp fragment of the COI used in the aquarium experiment. The average wet weight
region. The probe was synthesized with a 6-FAM reporter of mussels for the two treatments were 1.46±0.53 g and
dye at the 5′ end and MGB-NFQ as a quencher on the 6.87±0.34 g per tank (mean±SD), respectively. These ani-
3′ end: forward primer sequence, 5′-CAT AGA ACC CCA mals were flushed with distilled water, taken from the ac-eDNA analysis for golden mussel 103
climation tanks, and placed in experimental tanks filled
with 9 L of distilled water. We bleached the experimental
tanks before use to reduce DNA contamination. Healthy
animals typically began to filter within 10 min of transfer.
A 250 mL water sample was taken from each tank after 0,
2, 12, 24, and 48 h of exposure (0 h represents before expo-
sure). Throughout the experiment, the water in the tank was
well aerated and mixed. The water was filtered through a
glass-fiber filter (GF/F; GE Healthcare). Filter holders (Ster-
ifil holder, EMD Millipore Corp.) and a vacuum pump were
used for filtration. Each filter disc containing the sample
was folded inward with tweezers and wrapped in commer-
cial aluminum foil. The filter disc was immediately stored
at −23°C until further analysis. All filtration equipment
was bleached and carefully rinsed with distilled water be-
tween filtration operations to prevent cross-contamination.
The DNeasy Blood & Tissue Kit (Qiagen) was used for
DNA extraction from the filter as follows: PK-mix (10 µL
of proteinase K [600 mAU/mL], 210 µL of water, and
180 µL of Buffer AL) was added to the filter paper and
incubated at 56°C for 1 h. The filter paper was centrifuged
at 6000 × g for 1 min, and the filtrate was squeezed out.
To collect the DNA remaining on the paper, 200 µL of buf-
fer AE was added to the filter paper and centrifuged under
the same conditions. Then, 600 µL each of Buffer AL and
ethanol was added to the filtrate, and the resultant solu-
tion was placed in a DNeasy column and centrifuged at
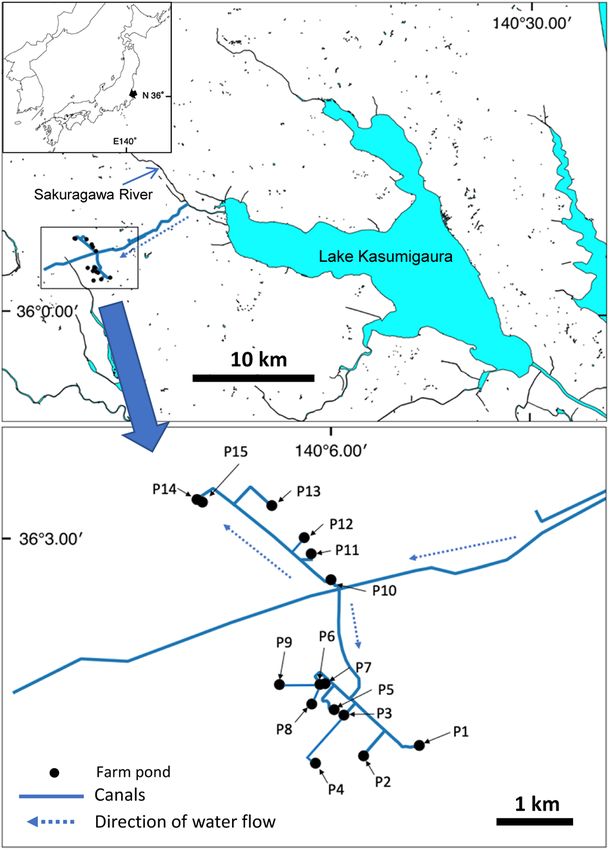
8000 rpm for 1 min. Subsequent analysis was performed Fig. 2. Water sampling and field surveys were conducted in 15
per the manufacturerʼs protocol. The DNA solution ob- ponds in Tsukuba City, Ibaraki Prefecture, Japan.
tained here was stored at −23°C.
counted under a binocular microscope in the laboratory,
Field surveys
and larval density (ind. m−3) was calculated.
We investigated 15 farm ponds in Tsukuba City, Ibaraki In addition, we collected 1 L of surface water directly
Prefecture, Japan, from August to September 2017 (Fig. from the shore using a bottle. Before use, these bottles
2). All but one of these ponds were made of concrete. Dur- were bleached for over 10 min and sterilized in an auto-
ing the study period, most ponds were full of water, and it clave to prevent contamination. The collected water was
was difficult to explore the bottom. These ponds receive cooled with refrigerants, brought into the laboratory, and
water from the downstream reach of the Sakuragawa River filtered in the same way as in the aquarium experiment on
connected to Lake Kasumigaura, and Limnoperna fortu- the day of collection. We prepared two negative controls to
nei has been found in Lake Kasumigaura since 2005 (Ito confirm that there was no contamination; one of distilled
2007, Sunoh 2006); the water intake of this channel is also water, and the other of water from a rainwater tank that did
inhabited by the mussel (Tsuchiura-shigai 15-choson land not contain mussels. DNA was extracted from the filter in
improvement district: personal communication). the same way as in the aquarium experiments.
We conducted a field survey of L. fortunei by visual
Statistical analysis
observation, larval sampling, and the eDNA method. We
searched visually for L. fortunei for 10 min using a hand- For the aquarium experiments, we compared the eDNA
net from the shore of the pond to determine the presence concentration among sampling times (after 2, 12, 24, and
or absence of the mussel. To calculate the density of free- 48 h) and between treatments (n=1 vs. n=5) with a gen-
swimming L. fortunei larvae, samples were obtained using eralized linear mixed model (GLMM), while assuming a
a plankton net (diameter: 20 cm; mesh size: 72 µm, Ri- gamma distribution (log link). Replicates for each treat-
gosha & Co.) at each sampling site. The plankton net was ment were used as a random effect. The effects of treatment
hauled vertically several times (depending on the depth) and time were analyzed using the likelihood ratio test. For
from the bottom to the surface (total volume of water fil- the field results, we used Fisherʼs exact test to compare
tered was approximately 100–200 L). The samples were the proportion of ponds in which L. fortunei was detected
preserved in 80% ethanol. Shelled-stage larvae (straight- based on conventional methods or the presence of eDNA.
hinged veliger to pediveliger; Cataldo et al. 2005) were Spearmanʼs rank correlation was performed to examine the104 K.Ito & H. Shibaike
correlation between larval density and eDNA concentra- to know the amount of template DNA present in the sam-
tion. Among the farm ponds where the species eDNA was ples. Therefore, we created a calibration curve to convert
detected, the eDNA concentrations of ponds where mus- the DNA concentration into the copy number of COI and
sels were found by conventional census and ponds where verified the results of the aquarium experiment and the
mussels were not found were compared using the Mann– field experiment. After confirming that the PCR products
Whitney U-test. We conducted all statistical analyses in amplified with the newly designed primers were formed
R version 3.4.0 (R Project for Statistical Computing). The from the expected nucleotide sequence, a calibration curve
significance of all statistical tests was set at α=0.05. was prepared using a dilution series of the plasmid con-
taining the partial COI region of L. fortunei (Fig. 4). In the
aquarium experiment, the DNA concentration varied from
Results
several ng/L to more than 10 ng/L among the samples.
When these values were converted to the copy number of
Species specificity for PCR amplification using L.
COI, it was suggested that 106 or more copies of COI were
fortunei-specific primers and probe
contained in the samples. However, in the field experiment,
PCR amplification was performed for the DNA extracted DNA concentration varied from several pg/L to more than
from six bivalve species as templates, using newly designed 100 pg/L among the samples, and it was suggested that at
L. fortunei-specific primers. When a PCR product using least several hundred copies of COI were included in the
DNA derived from L. fortunei as a template was electro- samples. Amplifications of qPCR were unstable for sam-
phoresed, a single DNA fragment was observed in lanes 6 ples obtained from the ponds of P7, P8, and P11. Therefore,
and 7 (Fig. 3), whereas when DNA extracted from five other it was considered that the detection limit was approximate-
bivalve species was used as template, no DNA fragments ly several hundred copies of COI in the 1 L of field water
were observed in the lanes from 1 to 5. Therefore, the newly samples in our study.
designed primer set for quantitative PCR was considered to
specifically amplify only the DNA derived from L. fortunei. Aquarium experiment
We detected the eDNA of L. fortunei in all the experi-
Conversion of DNA concentration to copy number of
mental tanks (Fig. 5), and found that the concentration
COI using a calibration curve
increased 2 h after the introduction of L. fortunei. The av-
In this study, we evaluated the amount of DNA derived erage eDNA concentration in tanks containing one indi-
from L. fortunei contained in the samples using DNA con-
centration. Since we are performing quantitative PCR tar-
geting a partial sequence of the COI region, it is valuable
Fig. 4. Calibration curve to convert DNA concentration to copy
Fig. 3. PCR amplification of the partial COI region in six number of the COI. Open circles indicate the copy number of COI,
bivalve species, using L. fortunei specific primer sets. Lane M: and closed circles indicate the DNA concentration. Threshold
100 bp DNA Ladder; lane 1: Corbicula fluminae; lane 2: C. gigas; cycles (vertical axis) show the number of cycles required to detect
lane 3: Mytilus galloprovincialis; lane 4: Perna viridis; lane 5: a signal from the samples. Low values indicate high amounts of
Xenostrobus securis; lanes 6 and 7: Limnoperna fortunei (different target sequence (COI), whereas high values represent low amounts.
PCR reactions of the same individual); lane 8: distilled water. A The calibration curve was determined from the copy number of
thick band indicates 500 bp. COI (y=−3.25 log10X+40.59, R2=0.988).eDNA analysis for golden mussel 105
Fig. 7. Box plot distributions of the detected environmental
Fig. 5. Time-dependent change in eDNA concentration at two DNA concentrations in farm ponds where mussels were found/not
biomass levels (one or five mussels per tank). Each data point indi- found by the conventional survey method. Box plot diagrams show
cates the eDNA concentration per tank. medians (horizontal line in the boxes) and 25th and 75th percentiles
(boxes). Upper and lower vertical lines on the boxes represent maxi-
mum and minimum values, respectively. The eDNA concentrations
were significantly different (p106 K.Ito & H. Shibaike
Table 1. Results of field surveys and quantitative real-time polymerase chain reaction (qPCR) with field water samples. For the visual cen-
sus, +means that we visually confirmed the presence of Limnoperna fortunei in the pond and −means that we did not. The qPCR results show
the number of positive results in two qPCR replicates. The environmental DNA (eDNA) concentration at each site was estimated by qPCR.
Larval density eDNA concentration
Site East longitude North latitude Visual census qPCR results
(m−3) (ng/L)
P1 140°06′48.5″ 36°01′32.4″ + 0 2/2 0.0214
P2 140°06′18.9″ 36°01′27.7″ + 0 2/2 0.0113
P3 140°06′08.3″ 36°01′45.2″ − 840 2/2 0.0991
P4 140°05′53.5″ 36°01′24.4″ − 7 2/2 0.2037
P5 140°06′03.1″ 36°01′47.5″ − 0 0/2 ND
P6 140°05′55.4″ 36°01′58.4″ − 0 0/2 ND
P7 140°05′58.2″ 36°01′58.7″ − 0 1/2 0.0022
P8 140°05′51.2″ 36°01′49.9″ − 0 1/2 0.0019
P9 140°05′33.9″ 36°01′58.2″ − 0 2/2 0.0048
P10 140°06′00.8″ 36°02′43.6″ − 30 2/2 0.0490
P11 140°05′50.1″ 36°02′54.7″ − 0 1/2 0.0015
P12 140°05′46.4″ 36°03′01.6″ − 0 0/2 ND
P13 140°05′29.0″ 36°03′15.3″ − 0 0/2 ND
P14 140°04′52.2″ 36°03′16.5″ − 0 0/2 ND
P15 140°04′49.3″ 36°03′17.6″ − 0 0/2 ND
ND, not detected
detected in several ponds where no L. fortunei individuals water may have changed dramatically due to the breeding
were found by conventional methods. These results sug- activity of some individuals in the experimental tank.
gest that the eDNA survey method in this study is an effec-
Quantification of L. fortunei with eDNA
tive tool for detecting L. fortunei in farm ponds.
There were four ponds where L. fortunei eDNA was There are some reports on the detection efficiency of
detected, but larvae and adults were not found (Table 1, L. fortunei by eDNA analysis. Pie et al. (2017) carried out
P7, P8, P9, and P11). Limnoperna fortunei has already been eDNA (real-time quantitative PCR) analysis in five reser-
found in the water source of the study sites (Tsuchiura- voirs of an electric power plant and succeeded in detecting
shigai 15-choson land improvement district: personal com- the presence and absence of L. fortunei (present at two
munication), meaning it is possible that L. fortunei had sites, absent at three sites). Xia et al. (2018b) conducted
already invaded these four ponds. There are some reports a field survey of L. fortunei using eDNA (conventional
that eDNA has been detected in places where the tar- PCR method) and detected mussels at 100% of sites with
get species has not been found by conventional surveys high mussel abundance, but only 40% of those had low
(Thomsen et al. 2012, Togaki et al. 2020), suggesting a abundance. Using conventional PCR instead of real-time
high sensitivity of eDNA survey methods. Supporting this quantitative PCR may be one of the causes of the low
view, these four ponds had lower eDNA concentrations L. fortunei detection efficiency (Xia et al. 2018a). Neither
than the sites where the presence of L. fortunei was con- previous study discussed the relationship between mussel
firmed by conventional surveys (Fig. 7). In these four farm abundance and eDNA concentration.
ponds, the density of L. fortunei may be too low to allow In our aquarium experiments, the eDNA concentration
individuals to be found visually. of L. fortunei was higher in aquaria with more individuals
In the aquarium experiment, the eDNA concentration than in those with less individuals (Fig. 5), and the field
changed little under low-density conditions, but under survey also showed that eDNA concentrations increased
high-density conditions, it increased considerably after in ponds with high larval density (Table 1, Fig. 6). These
24 h in one of three replicates (Fig. 5). One reason for this results suggest that eDNA concentrations can be used to
result may be the reproductive activity of the mussels used assess mussel abundance in farm ponds. However, the re-
in the experiment. The experiment was conducted in June, lationship between larval density and eDNA concentration
which is the breeding season for golden mussels in Japan was ambiguous in our study (Fig. 6). This could relate
(Iwasaki & Uryu 1998), and the temperature of the ex- to the larval density being very unstable in field studies
periment was sufficiently high (~24°C) to allow reproduc- (Nakano et al. 2017), or fluctuations in eDNA itself. The
tive activity. In addition, during the acclimatization period, concentration of eDNA in freshwater bivalves varies sig-
mussels spawned eggs or released sperm into the aquarium nificantly with time and space (Takahara et al. 2019). In
(Ito, personal observation). The eDNA concentration in the some cases, eDNA was undetectable when the bivalve pop-eDNA analysis for golden mussel 107
ulations were visually found (Cowart et al. 2018, Togaki et water mussel Limnoperna fortunei (Dunker, 1857) (Bivalvia:
al. 2020, Xia et al. 2018b). In order to evaluate the abun- Mytilidae) in South America. Nautilus 114: 69–73.
dance of L. fortunei using eDNA in field studies, more Darrigran G, Pastorino G (1995) The recent introduction of a
detailed information on spatiotemporal variations in eDNA fresh-water Asiatic bivalve, Limnoperna fortunei (Mytilidae)
concentration is required. into South-America. Veliger 38: 171–175.
In conclusion, compared to conventional methods, de Oliveira MD, Takeda AM, Fernandes de Barros L, Savio Bar-
eDNA analysis showed greater sensitivity for the detection bosa D, de Resende EK (2006) Invasion by Limnoperna fortu-
nei (Dunker, 1857) (Bivalvia, Mytilidae) of the Pantanal wet-
of L. fortunei in farm ponds. In general, it is difficult to
land, Brazil. Biol Invasions 8: 97–104.
drain water from farm ponds when surveying L. fortunei.
Dougherty MM, Larson ER, Renshaw MA, Gantz CA, Egan SP,
Environmental DNA surveys that use small amounts of
Erickson DM, Lodge DM (2016) Environmental DNA (eDNA)
water have little impact on water management and are suit-
detects the invasive rusty crayfish Orconectes rusticus at low
able for surveys at water facilities that have not yet been
abundances. J Appl Ecol 53: 722–732.
damaged by the mussels. Ficetola GF, Miaud C, Pompanon F, Taberlet P (2008) Species
detection using environmental DNA from water samples. Biol
Acknowledgements Lett 4: 423–425.
Fukumoto S, Ushimaru A, Minamoto T (2015) A basin-scale
We thank the staff of the Tsuchiura-shigai 15-choson application of environmental DNA assessment for rare endem-
land improvement district for information on L. fortunei ic species and closely related exotic species in rivers: a case
in water channels. We also thank the staff of the Facil- study of giant salamanders in Japan. J Appl Ecol 52: 358–365.
ity Management Division of the National Agriculture and Goldberg CS, Sepulveda A, Ray A, Baumgardt J, Waits LP
Food Research Organization for giving us permission to (2013) Environmental DNA as a new method for early detec-
investigate the farm ponds. This research was supported tion of New Zealand mudsnails (Potamopyrgus antipodarum).
by grants from the Project of the Ministry of Agriculture, Freshw Sci 32: 792–800.
Forestry, and Fisheries of Japan (Research Program on De- Ito K (2007) Spatial distribution of golden mussel, Limnoperna
velopment of Strategic Project). fortunei, in Lake Kasumigaura, Ibaraki Prefecture, Japan. Jap
J Benthol 62: 34–38. (in Japanese with English abstract)
Ito K (2008) Spatial distribution of the golden mussel, Limnoper-
References na fortunei, in the Tone River system, Kanto region, Japan. Jap
Bergonci PEA, Mansur MCD, Pereira D, Santos CnPd (2009) J Benthol 63: 30–34. (in Japanese with English abstract)
Population sampling of the golden mussel, Limnoperna for- Ito K (2016) Distribution of an invasive alien mussel, Limnoper-
tunei (Dunker, 1857), based on artificial ceramic substrate. na fortunei, in the Naka River system, Ibaraki, Japan. Japa-
Biotemas 22: 85–94. nese J conserv Ecol 21: 67–76. (in Japanese with English ab-
Bohmann K, Evans A, Gilbert MTP, Carvalho GR, Creer S, stract)
Knapp M, Yu DW, de Bruyn M (2014) Environmental DNA Ito K, Inoue A, Kimura T (2018) The effect of tube trap structure
for wildlife biology and biodiversity monitoring. Trends Ecol on sampling efficacy and accuracy for golden mussel, Lim-
Evol 29: 358–367. noperna fortunei. Plankton Benthos Res 13: 104–115.
Boltovskoy D, Cataldo DH (1999) Population dynamics of Lim- Iwasaki K, Uryu Y (1998) Life cycle of a freshwater mytilid
noperna fortunei, an invasive fouling mollusc, in the lower mussel, Limnoperna fortunei, in Uji River, Kyoto. Venus 57:
Parana river (Argentina). Biofouling 14: 255–263. 105–113.
Boltovskoy D, Correa N, Cataldo D, Sylvester F (2006) Disper- Larkin MA, Blackshields G, Brown NP, Chenna R, McGettigan
sion and ecological impact of the invasive freshwater bivalve PA, McWilliam H, Valentin F, Wallace IM, Wilm A, Lopez R,
Limnoperna fortunei in the Rio de la Plata watershed and be- Thompson JD, Gibson TJ, Higgins DG (2007) Clustal W and
yond. Biol Invasions 8: 947–963. Clustal X version 2.0. Bioinformatics 23: 2947–2948.
Cataldo D, Boltovskoy D, Hermosa JL, Canzi C (2005) Lee Y, Kwak H, Shin J, Kim S-C, Kim T, Park J-K (2019) A mi-
Temperature-dependent rates of larval development in Lim- tochondrial genome phylogeny of Mytilidae (Bivalvia: Myti-
noperna fortunei (Bivalvia: Mytilidae). J Mollusc Stud 71: lida). Mol Phylogenetics Evol 139: 106533.
41–46. Miller RC, McClure FA (1931) The fresh-water clam industry of
Cataldo DH, Boltovskoy D (2000) Yearly reproductive activity the Pearl River. Lingn Sci Jour 10: 307–332.
of Limnoperna fortunei (Bivalvia) as inferred from the occur- Morton B (1973) Some aspects of the biology and functional
rence of its larvae in the plankton of the lower Parana river morphology of the organs of feeding and digestion of Lim-
and the Rio de la Plata estuary (Argentina). Aquat Ecol 34: noperna fortunei (Dunker) (Bivalvia: Mytilacea). Malacologia
307–317. 12: 265–281.
Cowart DA, Renshaw MA, Gantz CA, Umek J, Chandra S, Egan Morton B, Dinesen G (2010) Colonization of Asian freshwaters
SP, Lodge DM, Larson ER (2018) Development and field vali- by the Mytilidae (Bivalvia): A comparison of Sinomytilus
dation of an environmental DNA (eDNA) assay for invasive harmandi from the Tonle-Sap River, Phnom Penh, Cambodia,
clams of the genus Corbicula. Manag Biol Invasion 9: 27–37. with Limnoperna fortunei. Molluscan Res 30: 57–72.
Darrigran G, de Drago IE (2000) Invasion of the exotic fresh- Nakano D, Kobayashi T, Sakaguchi I (2017) Reproduction and108 K.Ito & H. Shibaike larval developmental stages of the freshwater mussel Lim- Togaki D, Doi H, Katano I (2020) Detection of freshwater mus- noperna fortunei at three sites in a temperate reservoir. Inver- sels (Sinanodonta spp.) in artificial ponds through environ- tebr Reprod Dev 61: 128–135. mental DNA: a comparison with traditional hand collection Pie MR, Ströher PR, Agostinis AO, Belmonte-Lopes R, Tadra- methods. Limnology 21: 59–65. Sfeir MZ, Ostrensky A (2017) Development of a real-time Tominaga A, Kimura T (2012) Estimation of range expansion PCR assay for the detection of the golden mussel (Limnoperna process and invasion route of invasive alien mussel, Limnoper- fortunei, Mytilidae) in environmental samples. An Acad Bras na fortunei. Chikyukankyo 17: 143–150. (in Japanese) Ciênc 89: 1041–1045. Tréguier A, Paillisson J-M, Dejean T, Valentini A, Schlaepfer Roussel J-M, Paillisson J-M, Treguier A, Petit E (2015) The MA, Roussel J-M (2014) Environmental DNA surveillance downside of eDNA as a survey tool in water bodies. J Appl for invertebrate species: advantages and technical limitations Ecol 52: 823–826. to detect invasive crayfish Procambarus clarkii in freshwater Sunoh N (2006) Records of golden mussel, Limnoperna fortu- ponds. J Appl Ecol 51: 871–879. nei in Lake Kasumigaura (Short paper). Bull Ibaraki Prefect Vitousek PM, DʼA ntonio CM, Loope LL, Westbrooks R (1996) Freshw Fish Exp St 40: 79. (in Japanese) Biological invasions as global environmental change. Am Sci Takahara T, Ikebuchi T, Doi H, Minamoto T (2019) Using en- 84: 468–478. vironmental DNA to estimate the seasonal distribution and Xia Z, Johansson ML, Gao Y, Zhang L, Haffner GD, MacIsaac habitat preferences of a Japanese basket clam in Lake Shinji, HJ, Zhan A (2018a) Conventional versus real-time quantitative Japan. Estuar Coast Shelf Sci 221: 15–20. PCR for rare species detection. Ecol Evol 8: 11799–11807. Thomsen PF, Kielgast JOS, Iversen LL, Wiuf C, Rasmussen M, Xia Z, Zhan A, Gao Y, Zhang L, Haffner GD, MacIsaac HJ Gilbert MTP, Orlando L, Willerslev E (2012) Monitoring en- (2018b) Early detection of a highly invasive bivalve based on dangered freshwater biodiversity using environmental DNA. environmental DNA (eDNA). Biol Invasions 20: 437–447. Mol Ecol 21: 2565–2573.
You can also read