Using seafloor mapping to find missing Malaysia Airlines flight MH 370
←
→
Page content transcription
If your browser does not render page correctly, please read the page content below
Using seafloor mapping to find missing Malaysia
                          Airlines flight MH 370
On March 8th, 2014, Malaysia Airlines flight MH370 disappeared while en route from
Kuala Lumpur to Beijing. Evidence from satellite tracking suggests that the aircraft
may have crashed into the Indian Ocean several 1,000 kms west of Australia and this is
where the search is now focused. No debris or oil slick related to the aircraft has so far
been found. However, signals consistent with the “pings” of the flight data recorder
were detected in two areas, several 100 kms apart from each other. A search of the
northernmost location, using anautonomous underwater vehicle (AUV) owned and
operated by the United States Navy has so far turned up no sign of wreckage of the
aircraft. The intent of this blog post is to explain what instruments are being used to
locate the wreckage, how they work, what are their limitations, and hopefully provide
some clarity and perspective on the monumentally difficult task that lies ahead for the
searchers.

Why is finding something on the seafloor so difficult? The methods we use for
mapping and surveying on dry land (e.g., aerial photographs, satellite imagery, laser
and radar mapping) rely on the electromagnetic spectrum (e.g., radio frequencies, the
visible spectrum and even infrared photography). Electromagnetic waves attenuate
quickly in seawater, however, and can only propagate over short distances (sunlight
only penetrates the top 200 m of the ocean, known as the photic zone). The result is
is that we cannot see through water very well using electromagnetic waves, and the
oceans effectively shield us from surveying the seafloor using traditional means used
on land (and on other planets!). So, to map the seafloor, alternative techniques are
required.

On any world map that includes information on the ocean floor (e.g., Google EarthTM)
you can see features such as ridges, seamounts, the continental shelves and submarine
trenches. These features were mapped using satellite altimetry, a technique in which
orbiting satellites use radar to measure small spatial variations in sea level. The
uneven surface of the ocean results from variations in Earth’s gravitational field, which
is stronger above positive features (e.g., a volcano) on the seafloor, due to the
presence of more mass, relative to regular abyssal plain. The increased gravitational
pull causes seawater to preferentially flow to that location, resulting in an elevated
ocean surface height directly above the volcano, or a dip in ocean surface height above
a trench. These sea surface variations can be translated into a map of topographic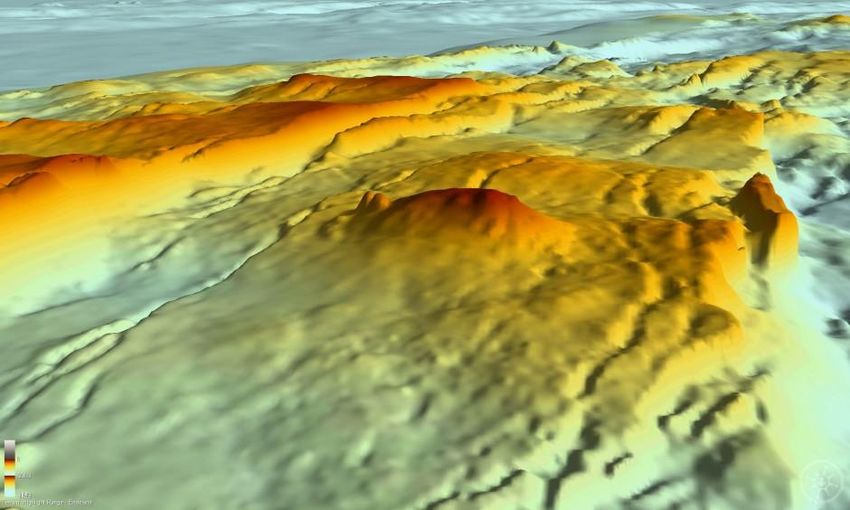
features on the seafloor (Fig. 1). The resolution of the map, however, is only 1-3 km,
which means features on the seafloor smaller than a few kilometers cannot be resolved
(note that most media outlets covering the Malaysia Airlines search have been
inaccurately reporting the resolution as 20 km).

Figure 1: Global seafloor topography map derived from satellite altimetry data. Source:
http://topex.ucsd.edu/WWW_html/mar_grav.html

To generate maps of the seafloor with higher resolution, hydroacoustic or SONAR
(Sound Navigation And Ranging) methods are used. Unlike visible light or radio waves,
sound waves are compression waves and can travel greater distances in water, and
hydroacoustic techniques (e.g., the “pinging” of a flight data recorder) are the standard
methods used for underwater mapping and communication. Multibeam sonar is a
mapping technique where a series of acoustic beams are emitted simultaneously
downward to the seafloor in a fan-shaped geometry perpendicular to the direction of
travel of a ship, submarine or other carrier platform. The time taken for the acoustic
signals to reflect off the seafloor back to a receiver is converted into a depth. By using
multiple beams, a swath underneath the ship that is roughly equally to 2 to 7 times the
depth can be mapped, producing a 3-D topographic image of the seafloor beneath a
vessel as it moves forward. Modern multibeam systems can produce maps with a
resolution of ~30 m (actual resolution is dependent on several parameters including
depth and speed of the vessel). It would take a fleet of 10 ships 15 to 45 years of
continuous surveying to map the entire ocean floor at a resolution of ~40 m. Although
the resolution of multibeam mapping is significantly higher than the global satellite
map, it is still inadequate to be of any use for finding a downed aircraft.
Higher resolution maps can be generated if the multibeam transmitter and receiver are
closer to the seafloor.    This is achieved by mounting multibeam systems onto
instruments towed deep beneath a ship by a cable, or, more recently, using AUVs such
as the U.S. Navy’s Bluefin-21, which are effectively underwater drones that can be
programmed to fly at prescribed altitudes above the seafloor. From heights of 50-100
m above the seafloor, resolutions of less than 1 m can be achieved, which is good
enough to find objects on the seafloor such as sunken ships, containers that have
fallen off cargo ships, or aircraft wreckage (Fig. 2).

Figure 2: Example of a 2 m resolution image of the seafloor, derived from autonomous
underwater vehicle (AUV) multi-beam SONAR data. This image is from the Juan de Fuca
Ridge, in the NE Pacific Ocean. The mound in the foreground has a diameter of ~75m
and a height of 26 m.

A related hydroacoustic method that is commonly used (including for the Malaysia
Airlines search) is side scan sonar. Instead of emitting acoustic beams downwards,
beams are emitted outward and downward at a wider angle, relative to multibeam
sonar. The intensity of the reflected signal is measured, producing an acoustic “image”
of the seafloor. The advantage of side scan sonar is that hard, solid objects stand out
clearly, and, because the survey “swath” is wider than that for a multibeam survey, a
larger area can be covered.
The initial search area for MH370 was a 314 km2 area where a pinging consistent with
that of the Boeing 777’s black box was detected. This area was surveyed with a U.S.
Navy Bluefin-21 AUV using side-scan sonar, covering an area of ~40 km2 per day.
This initial survey turned up no evidence of the missing aircraft. As the search radius
expands, the area of seafloor to be covered increases exponentially. For example,
expanding the survey area to cover 60,000 km2 of seafloor, which is likely the next
step, would take over two years with a single AUV. However, this area will first be
mapped using ship-based multibeam (a process that has already started), before
choosing new targets to survey more thoroughly with an AUV.
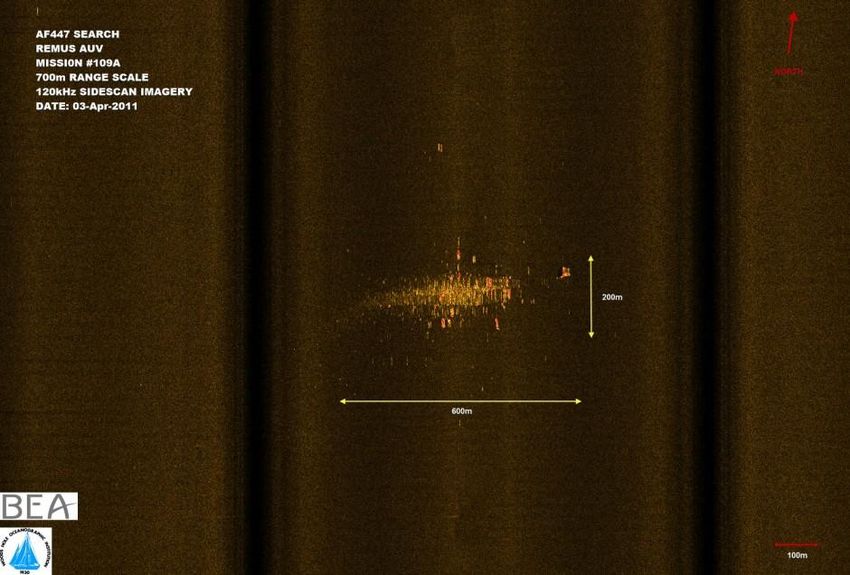
In 2009, Air France flight AF447 crashed in the Atlantic Ocean en route from Rio de
Janeiro to Paris. The wreckage of the aircraft, including the flight data recorder, was
found two years later after searching nearly 17,000 km2 with 3 REMUS6000-type AUVs
(one from GEOMAR in Kiel, Germany, and two from Woods Hole Oceanographic
Institution, in Massachusetts, USA). Figure 3 shows side scan reflections that were the
first images of wreckage on the seafloor from the Air France flight. Luckily, the
wreckage came to rest in a flat, featureless area within a very mountainous region of
seafloor near the Mid-Atlantic Ridge, so that the reflections seen in the image stood
out easily. Had the wreckage come to rest in an area such as that shown in Figure 2,
the wreckage would not necessarily stand out so clearly.

Figure 3: Side scan image of initial discovery of Air France 447. The debris appears as
bright     reflections     on      an     otherwise        flat   seafloor.     Source:
http://www.bea.aero/docspa/2009/f-cp090601e3.en/pdf/f-cp090601e3.en.pdf

A major difference with the Air France search, compared to the Malaysia Airlines
search, is that floating debris was discovered within a week of the crash, providing
searchers a clear target from which to base their search. The current search location in
the Indian Ocean is constrained by satellite data, which defines a broad area spanning
1,000s of kms, and two separate reports of potential acoustic flight recorder pings,
spaced 100 kms from each other. With no physical sign of any wreckage, this search is
indeed daunting and may take many years.

About the author:

John Jamieson is a research scientist at GEOMAR – Helmholtz Centre for Ocean
Research, in Kiel, Germany. John obtained his B.Sc. in geology from the University of
Alberta in 2002, his M.Sc. in isotope geochemistry from the University of Maryland in
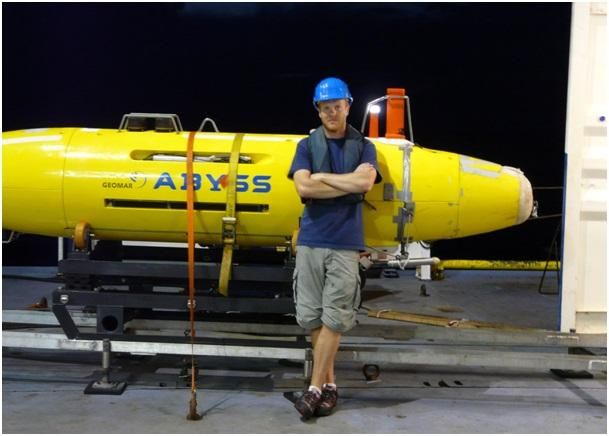
2005, and his Ph.D. in marine geology from the University of Ottawa in 2013. John
specializes in the study of mineral deposits that form at hydrothermal vents (or “black
smokers”) on the seafloor, and the development of technology and methods for
submarine exploration. His research has led to participation on several research
cruises and projects in the Pacific, Atlantic and Indian Oceans. He has twice dived in
the ALVINsubmersible on the Juan de Fuca Ridge in the NW Pacific to depths of over
2,000 m. His research currently focuses on the use of autonomous and remotely-
operated vehicles and their mapping capabilities to locate and understand the
geological controls on the formation of mineral deposits on mid-ocean ridges. He
works with governments, international organizations and industry on aspects related
to seafloor mining.

The author, on board the French research vessel Pourquoi Pas?, with the GEOMAR
REMUS6000-class AUV “Abyss” which was used in the search for the Air France flight
AF447 wreckage.

Source: http://blogs.egu.eu/geosphere/
You can also read