Using social media to understand the impact of weather on skiing and snowboarding in Utah - National Outdoor Recreation Conference | Burlington ...
←
→
Page content transcription
If your browser does not render page correctly, please read the page content below
Using social media to
understand the impact of
weather on skiing and
snowboarding in Utah

National Outdoor Recreation Conference |
Burlington, VT | April 23, 2018
SOCIAL MEDIA USE

                   32%   31%
        79%

                   29%   24%
                               Greenwood et al. (2016)
SOCIAL MEDIA DATA
Analysis types
    • Text-based
    • Photo-based
    • Geotagged spatial

• Tweets to understand how people frame climate change1
• Photos from Instagram and Flickr at a national park to understand
  visitor preferences2
• Geotags to track visitation3

                                 1 Jang   & Hart (2015) 2 Hausmann et al. (2017) 3 Wood et al. (2013)
SOCIAL MEDIA DATA
Tracking visitation
    • Flickr is useful for estimating visitation and home location at
        836 tourism sites globally1
    • Flickr shows temporal trends in US national park visitation2
    • Flickr data shows a strong relationship with survey data for
        visitation to Iowa lakes3
    • Instagram/Twitter/Flickr data are highly associated with
        monthly park visitation in Finland and South Africa4

                     1 Wood   et al. (2013) 2 Sessions et al. (2016) 3 Keeler et al. (2015) 4 Tenkanen et al. (2017)
OBJECTIVES
1. Examine the feasibility and uses of geotagged
   Twitter data for outdoor recreation management
2. Investigate how Twitter post volume at Utah ski
   areas changes due to snow conditions
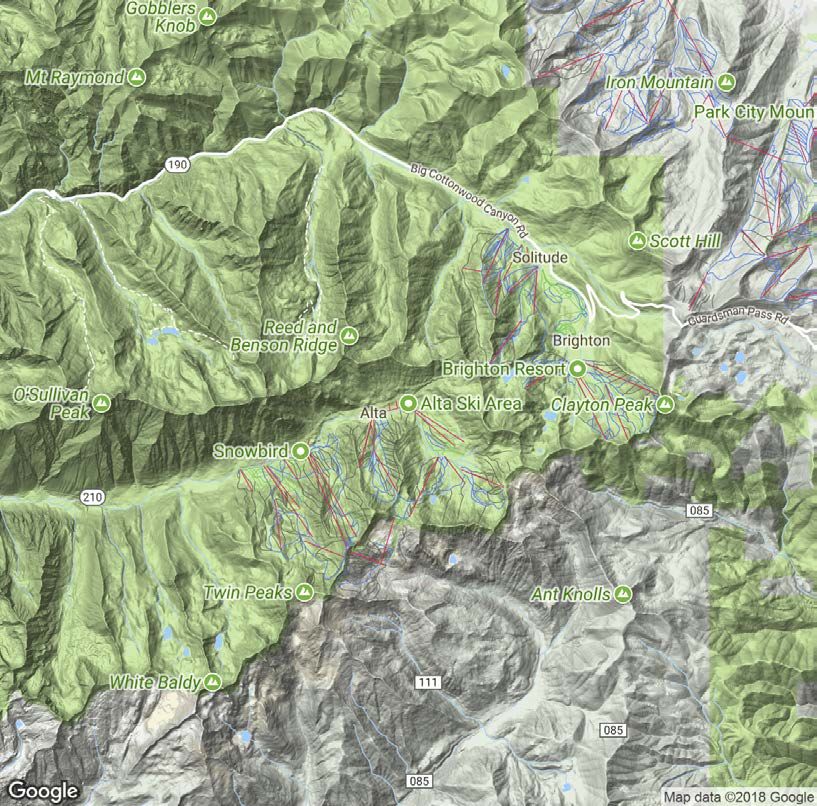
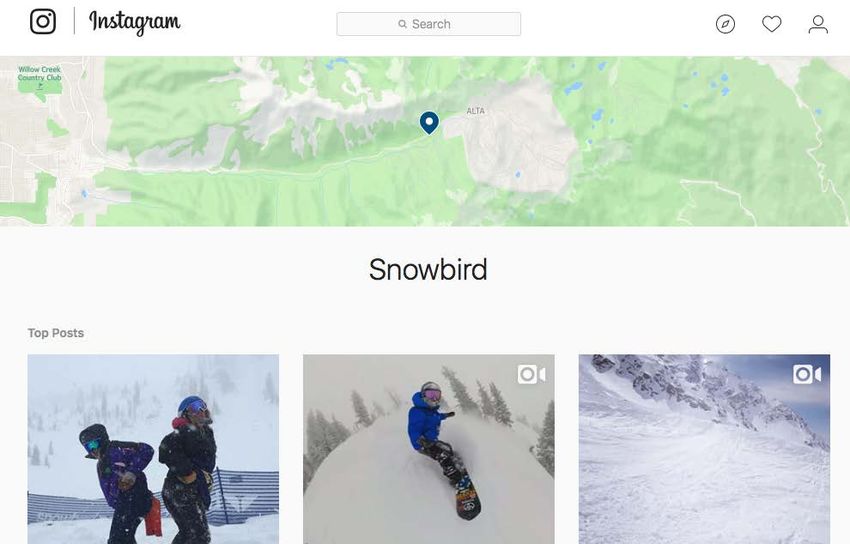
STUDY SITE Solitude, Brighton, Alta, & Snowbird
DATA COLLECTION: TWITTER
• Rest API or streaming API
• All tweets within resort boundaries
• Tweet text
   • Date/time
   • Geotag (coordinates)
   • Number of followers
   • Number of retweets
   • Home location
   • User name
   • User profile description
PLATFORM DIFFERENCES
PLATFORM    ACCESSABILITY        TIME FRAME                    DATA SCALE
Twitter     Live streaming,      Present + 7 days past 500 million tweets
            7 days past                                per day, 1% available
Instagram   Live streaming      Present                        95 million
            (ending 12/11/2018)                                photos/videos a day
Facebook    None                 NA                            NA

Flickr      Open access          2005 - Present                5 billion photos

Panoramio   Open access          2005-2016                     94 million photos
            No longer exists

                               Twitter, Inc. (2018); Instagram (2018); Flickr (2018); Kaiser (2018)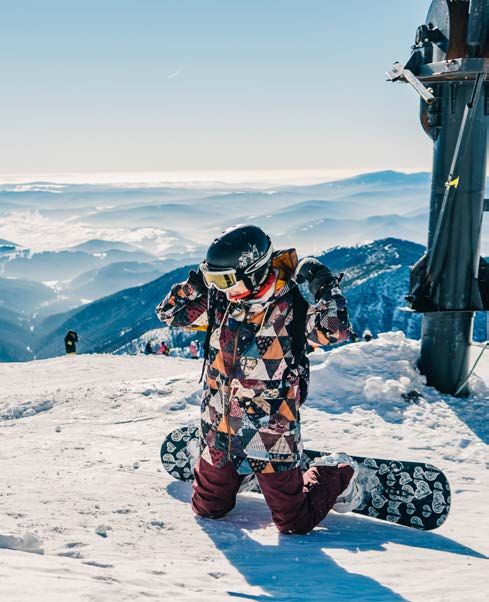
TEMPORAL SCALES

 n = 594           n = 223
PUD = 325         PUD = 196
TWITTER DATA

                                     3/18/18 – 4/7/18

               Snow data in inches                      NOAA (2018)
SPATIAL SCALES
n = 3,344
PUD = 1,417
n = 594
PUD = 325MANAGEMENT IMPLICATIONS Track Visitation #Preferences Communicate
DOWNLOADING DATA
• Easily collect Twitter or Instagram data
• Up to 100 posts every hour
• Hashtag or location (5 km radius)
• Saves to a csv file
• Up to 5 datasets
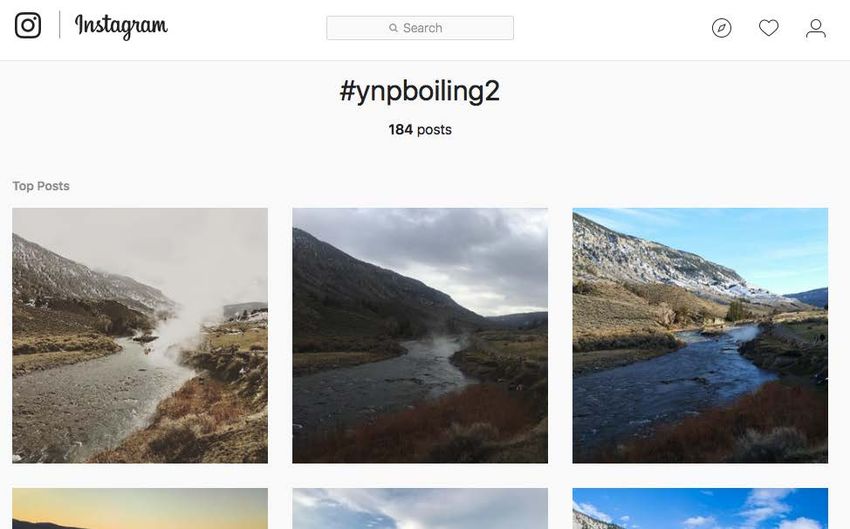
Gruzd (2016)#HASHTAG DATA COLLECTION
LOCATION DATA COLLECTION
            • Create locations
            • Search social media for location tag
            • Instagram locations taken from Facebook
COMMUNICATION TOOL
Wilkins, Smith, & Keane (in review)Emily J. Wilkins
Jordan W. Smith
Contact : emily.wilkins@aggiemail.usu.edu
: @WilkinsScienceREFERENCES Flickr. (2018). The Flickr Developer Guide. Available from https://www.flickr.com/services/developer Greenwood, S., Perrin, A., & Duggan, M. (2016). Social media update 2016. Washington, DC: Pew Research Center. Gruzd, A. (2016). Netlytic: Software for Automated Text and Social Network Analysis. Available at http://Netlytic.org Hausmann, A., Toivonen, T., Slotow, R., Tenkanen, H., Moilanen, A., Heikinheimo, V., & Di Minin, E. (2017). Social Media Data Can Be Used to Understand Tourists’ Preferences for Nature‐Based Experiences in Protected Areas. Conservation Letters. Instagram (2018). Instagram API Overview. Available from https://www.instagram.com/developer. Jang, S. M., & Hart, P.S. (2015). Polarized frames on “climate change” and “global warming” across countries and states: Evidence from Twitter big data. Global Environmental Change, 32, 11-17. Kaiser. (2018). Panorank – Global stats. Available from www.panorank.com/index.php?lang=en&op=global Keeler, B.L., Wood, S. A., Polasky, S., Kling, C., Filstrup, C.T., Downing, J.A. (2015). Recreational demand for clean water: evidence from geotagged photographs by visitors to lakes. Frontiers in Ecology and the Environment, 13(2), 76-81. NOAA (2018). National Centers for Environmental Information: Climate Data Online. Available at https://www.ncdc.noaa.gov/cdo-web/customoptions Sessions, C., Wood, S. A., Rabotyagov, S., & Fisher, D. M. (2016). Measuring recreational visitation at U.S. National Parks with crowd-sourced photographs. Journal of Environmental Management, 183, 703-711. doi:10.1016/j.jenvman.2016.09.018 Tenkanen, H., Di Minin, E., Heikinheimo, V., Hausmann, A., Herbst, M., Kajala, L., & Toivonen, T. (2017). Instagram, Flickr, or Twitter: Assessing the usability of social media data for visitor monitoring in protected areas. Scientific Reports, 7(1), 17615 Twitter, Inc. (2018). Getting started. Available from https://developer.twitter.com/en/docs/basics/getting-started Wilkins, E. J., Smith, J. W., & Keane, R. (in review). Social media communication preferences of national park visitors. Manuscript submitted to Applied Environmental Education & Communication. Wood, S. A., Guerry, A. D., Silver, J. M., & Lacayo, M. (2013). Using social media to quantify nature-based tourism and recreation. Scientific reports, 3, 2976. doi:10.1038/srep02976
You can also read